Heard County in west-central Georgia is predominantly wooded in the 2025 land-cover data. Forest covers 63.87% of the county, while farmland, grassland, shrubland, and small developed areas break up the green surface. The Chattahoochee River is another defining feature, running through the county toward West Point Lake in the south. The four maps on this page separate today’s cover, forest and farmland, impervious surfaces, and mapped differences from 1985 to 2025.
The four original JPG maps are available together in one ZIP download below. They are useful for printing, presentations, classroom work, or simply enlarging the Franklin area, the river corridor, and the rural western side without relying on the smaller web previews.
Table of Contents
Forest is the county-wide constant, but farms and small settlements keep the pattern varied
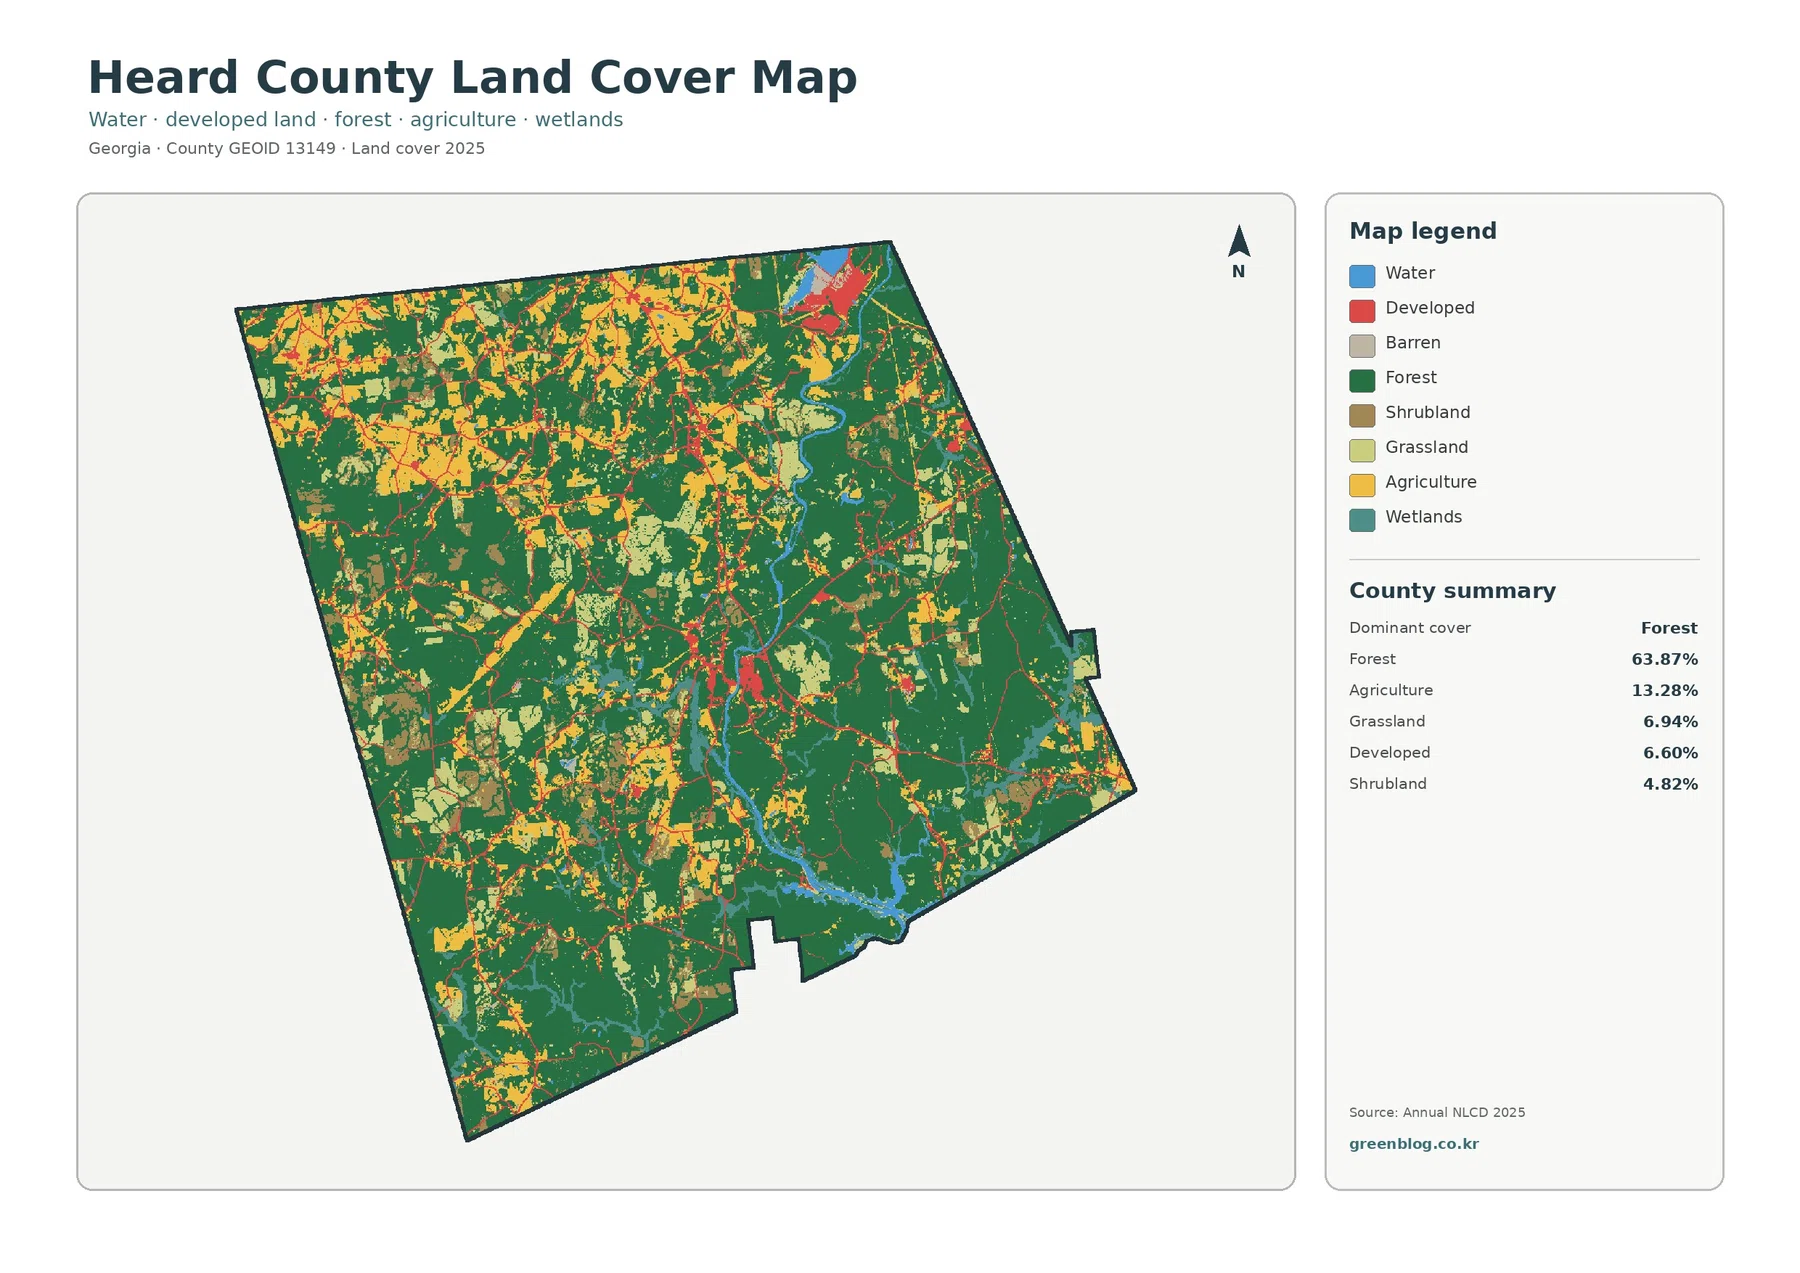
The 2025 summary identifies forest as the dominant cover at 63.87%. Agriculture accounts for 13.28%, grassland 6.94%, developed land 6.60%, and shrubland 4.82%. Water and wetlands are smaller by area, but they form distinctive linear features along the Chattahoochee River and its southern expansion toward West Point Lake. Looking at the map as a whole, Heard County is clearly rural and forested rather than dominated by a single large urban footprint.
The wooded surface is not continuous. Agricultural patches are frequent in the west and northwest, and lighter grass or shrub classes appear between fields and forest blocks. Developed cover follows a different pattern. It is concentrated in several small centers and along connecting roads, with a more visible cluster around Franklin and additional built patches in northern parts of the county. This makes settlement easy to distinguish without letting the red developed class dominate the entire map.
Local sources provide a useful frame for those patterns. Heard County government identifies Franklin as the county seat and lists Centralhatchee and Ephesus as the other incorporated communities. UGA Extension places Heard County in west-central Georgia and also identifies Franklin as the county seat. These references help orient the reader, but the land-cover colors should not be treated as municipal boundaries. A developed pixel near a town may sit outside the legal city limit.
The Chattahoochee adds a different kind of structure. Georgia’s Department of Community Affairs describes a Chattahoochee River corridor as one of Heard County’s character areas and notes that West Point Lake begins in the southern portion of the county. On the map, blue water narrows through the interior and becomes broader toward the south, with wetland cover appearing along parts of the same corridor. The river therefore helps explain why water-related classes are spatially important even though they occupy much less area than forest.
Cropland is only one part of Heard County’s open rural land
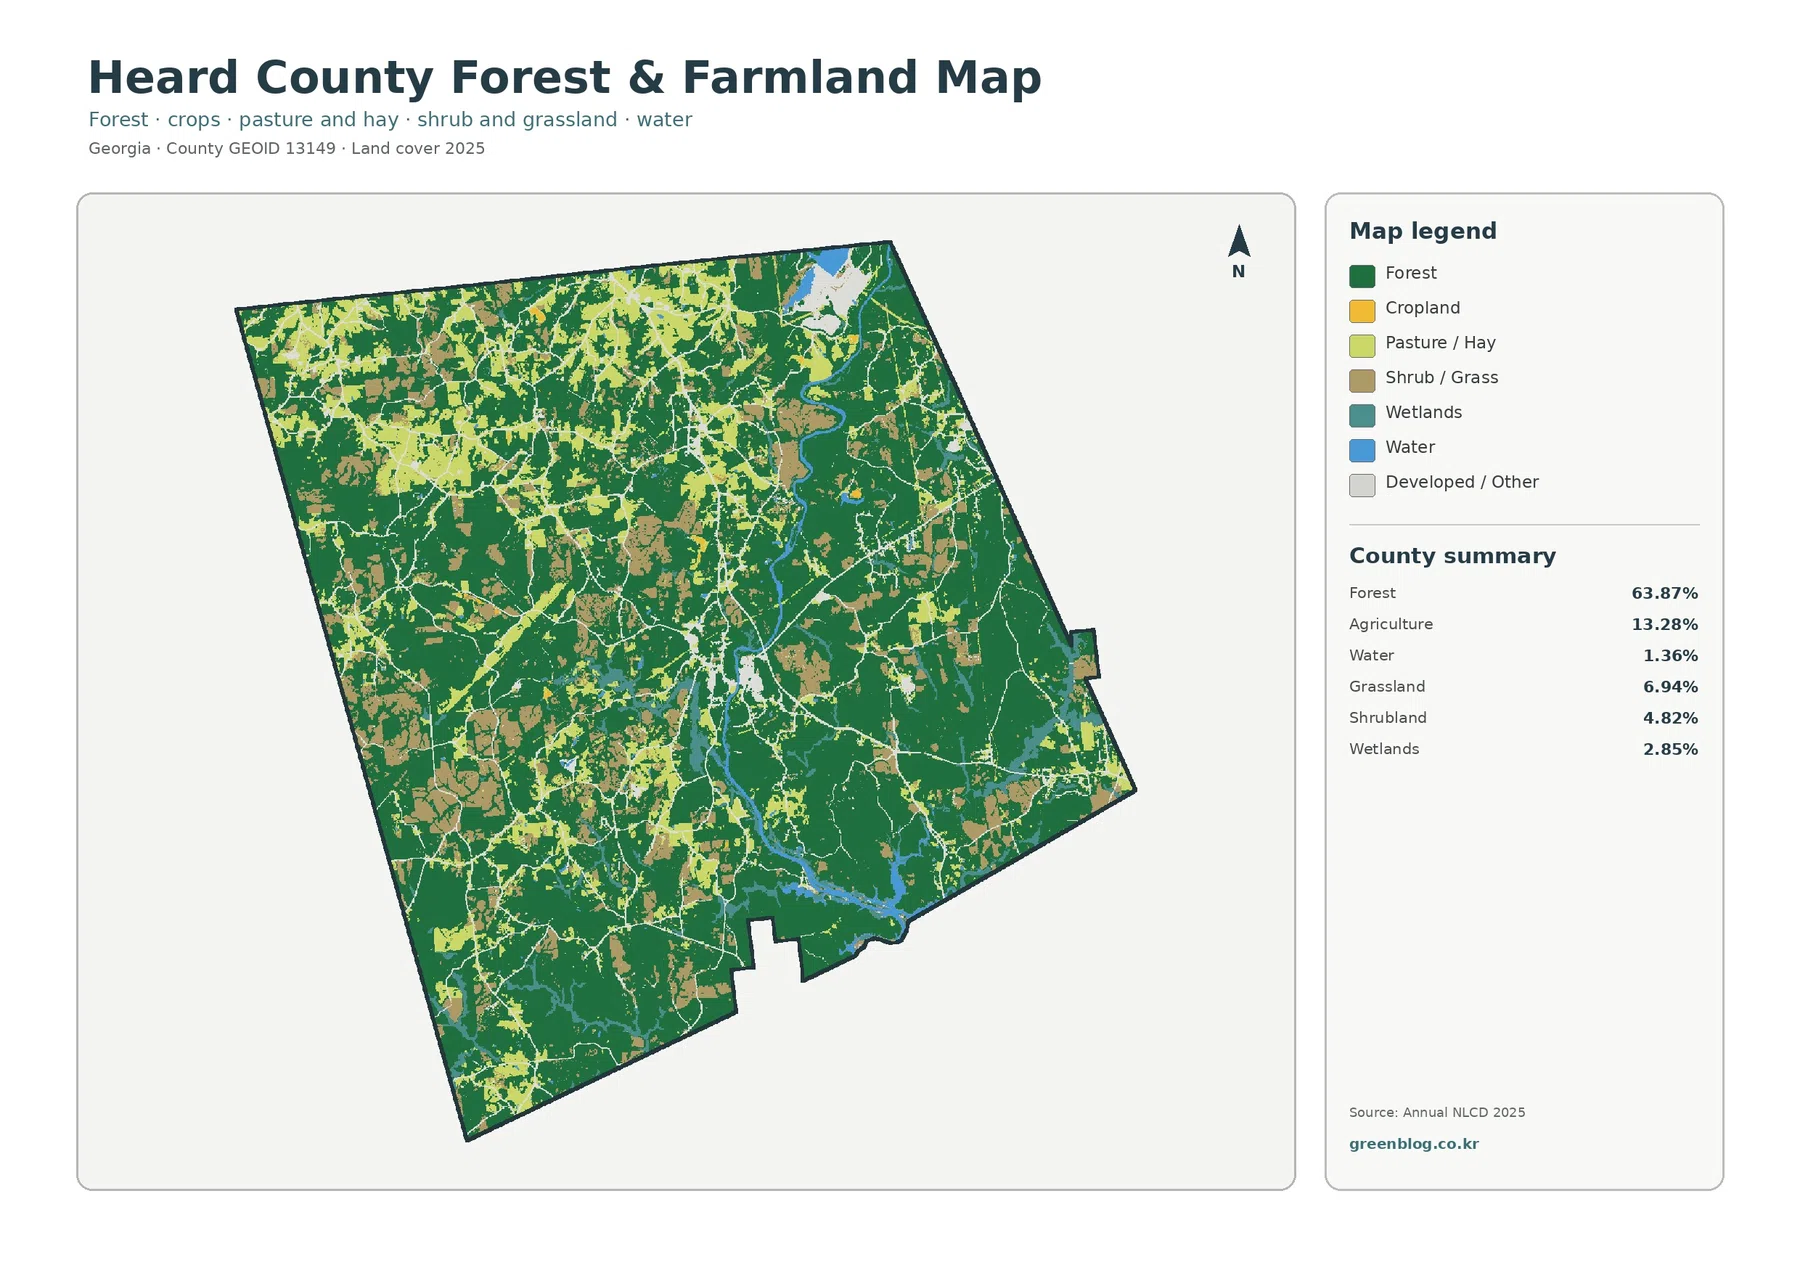
Agriculture is the second-largest named class in the general summary at 13.28%, but the forest-and-farmland map shows why that number should not be used as a stand-in for every open field. Pasture and hay are mapped separately from cropland, and shrub or grass cover has its own class. In the supplied county summary, grassland is 6.94% and shrubland is 4.82%. Together they account for a substantial part of the lighter-colored landscape between forest blocks.
The western half of the county contains many of these mixed patches. Dark forest remains extensive, yet it is interrupted more often by cropland, pasture, and shrub or grass areas than in some of the larger wooded blocks to the east and south. The result is a rural mosaic rather than a simple forest-versus-farm division. Smaller developed/other areas thread through the same landscape where homes, local roads, and settlements occur.
Water and wetlands are easier to separate in this view as well. Water accounts for 1.36% of the supplied summary and wetlands 2.85%. Both become more visible along the Chattahoochee system and near the broader southern water body. Because the classes are distinct, a blue open-water cell should not be combined automatically with a wetland cell when describing the county. They represent different surface conditions and can respond differently to changes in water level or vegetation.
Land cover also should not be confused with legal land use. A yellow cropland cell is not a surveyed farm boundary, and a forest cell does not tell you whether the parcel is privately managed timberland, protected land, or another ownership type. Heard County’s official history notes a long local relationship with forestry and smaller-scale farming, which gives useful background for the present map. It does not, however, prove that any individual 2025 pixel has the same use it had historically.
The Chattahoochee corridor changes character as it approaches West Point Lake
The river is easiest to follow when the general and forest-and-farmland maps are viewed side by side. Through much of the interior it appears as a relatively narrow blue corridor bordered by forest and intermittent wetlands. Farther south, the water broadens and branches, creating longer edges where forest, wetland, open water, and occasional developed cover meet. This southern pattern is consistent with the comprehensive plan’s description of West Point Lake beginning in the southern portion of Heard County.
That plan also identifies the Chattahoochee River corridor as a conservation-oriented character area. It mentions Brush Creek Park and Snake Creek Park in the southern lake area, giving real-world context to the broad blue and teal patterns on the map. The land-cover layer does not mark park boundaries or recreation facilities, so those details should be obtained from park or county information rather than inferred from pixel colors.
For environmental education, the corridor is a useful example of why percentage totals and location answer different questions. Water is only 1.36% of the county, yet the river stretches across a large north-south distance and influences where wetland cover appears. A class can therefore occupy a small percentage while still forming a prominent geographic feature. The same idea applies to developed land, which is limited in total area but easy to spot where it is concentrated.
The map should not be used to claim that nearby development has caused a particular wetland or water change. It only shows where classes are located relative to one another. Water-quality effects, flood behavior, or habitat impacts require additional evidence such as stream records, elevation, soils, rainfall, permits, and field observations. The county map is a good screening tool for choosing places that deserve closer study.
A 1.32% mean impervious value reveals how lightly developed most of the county remains
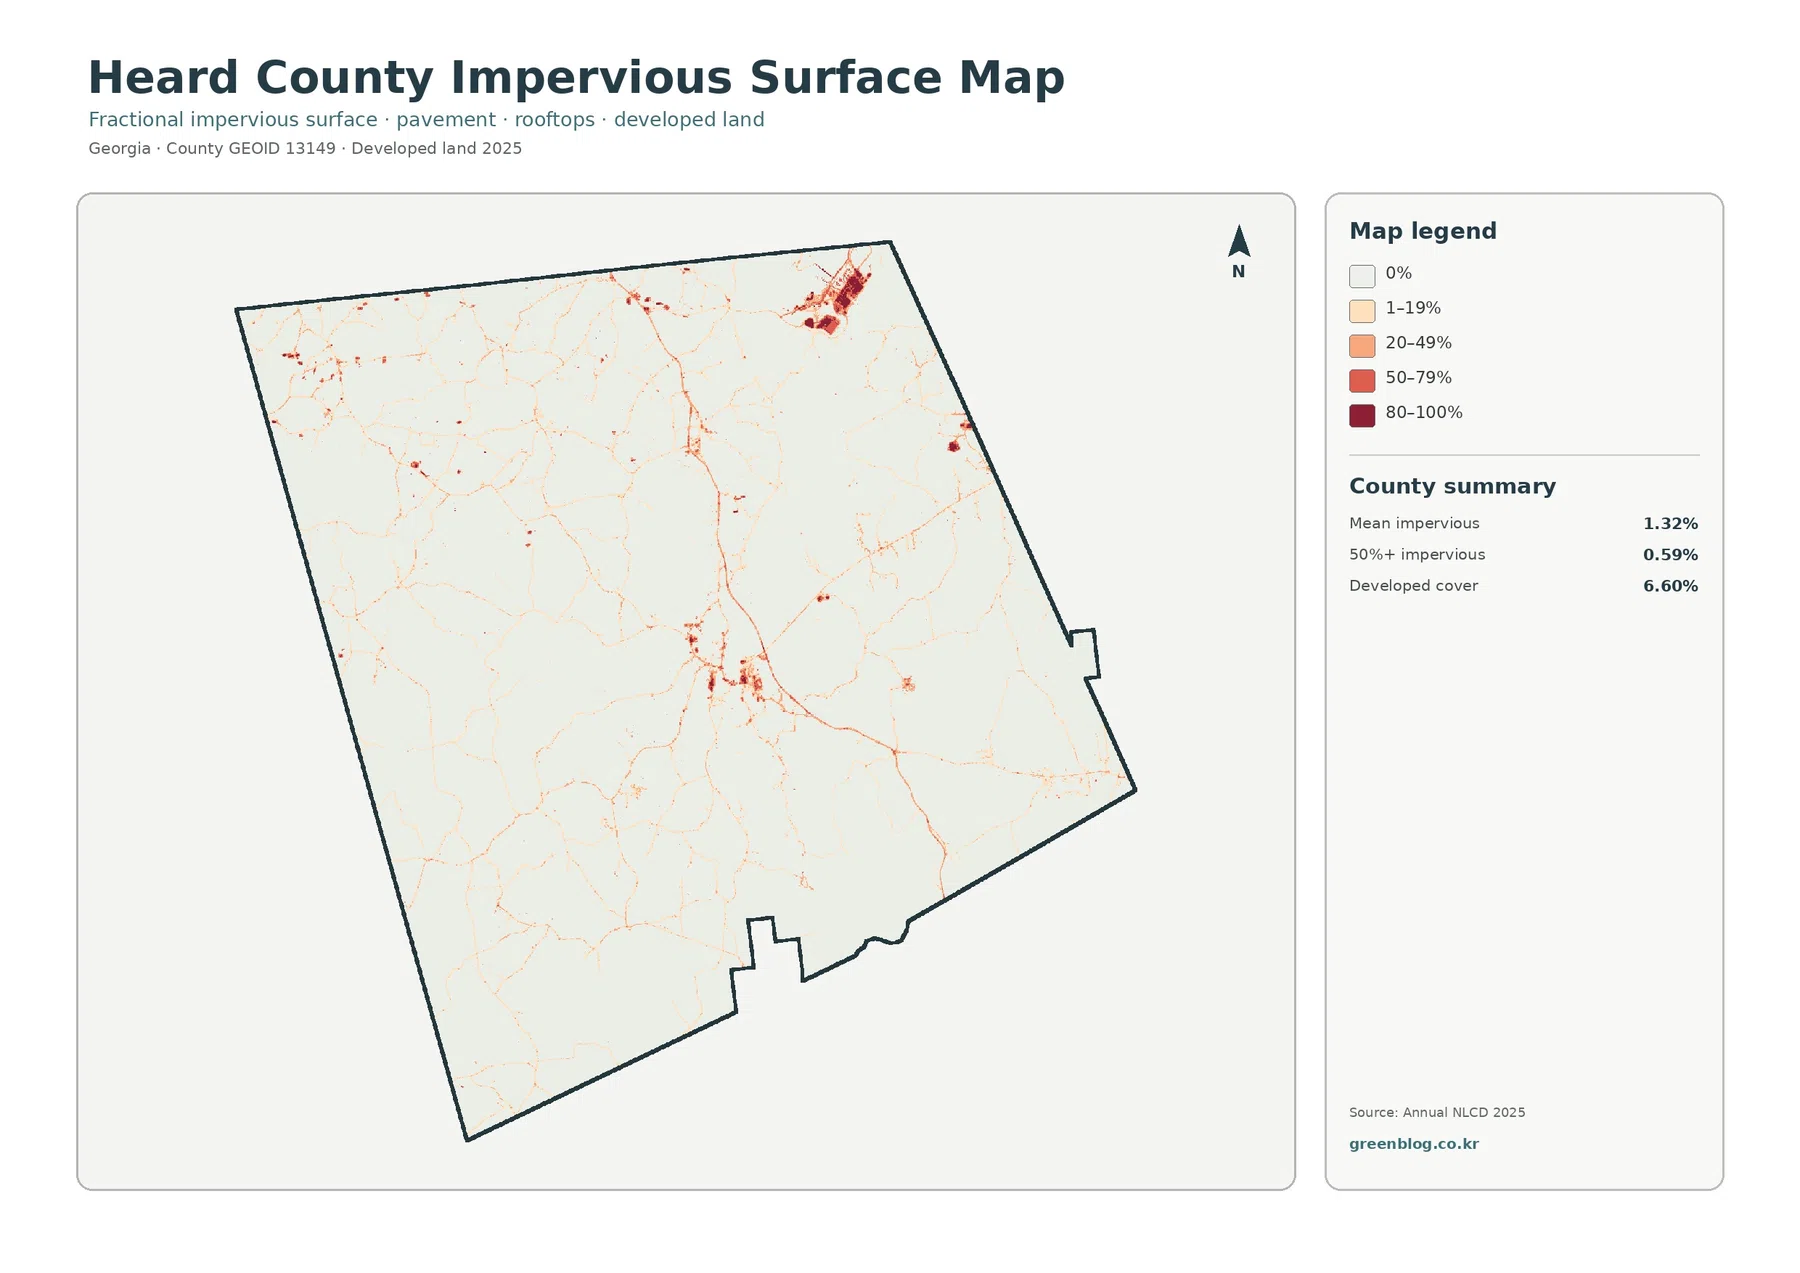
Impervious surface refers to pavement, rooftops, parking lots, and other hard materials that prevent water from soaking readily into the ground. Heard County’s mean impervious value is 1.32%, and only 0.59% of mapped cells are at least 50% impervious. Those figures are far below the 6.60% developed-cover share because a developed land-cover class can include lawns, trees, bare soil, and other permeable surfaces around buildings and roads.
Most of the impervious map is very light. Darker values are limited to a few compact areas and thin lines. One of the clearest concentrations is around Franklin, while additional hard-surface features appear in northern settlement areas and along road corridors. The contrast is sharp: a small built center can stand out strongly even though forest and rural cover still dominate the county-wide average.
Franklin’s role is supported by local sources rather than inferred from the raster alone. It is the county seat, and the local development authority describes it as a junction of U.S. 27, Georgia 34, and Georgia 100. The impervious map places hard surfaces in the same general area, which is useful for orientation. It would still be an overreach to say that a particular highway caused the mapped development without a separate historical or planning study.
The county average can also hide local extremes. A mean of 1.32% does not mean every part of Heard County is 1.32% paved. Many forest and farm cells are near zero, while portions of a town center may exceed 50%. For stormwater or heat studies, the location of high-value cells is usually more informative than the county mean. A real risk analysis would need terrain, rainfall, drainage infrastructure, soils, and stream conditions in addition to impervious cover.
The 38.38% class difference includes more than confirmed physical land conversion
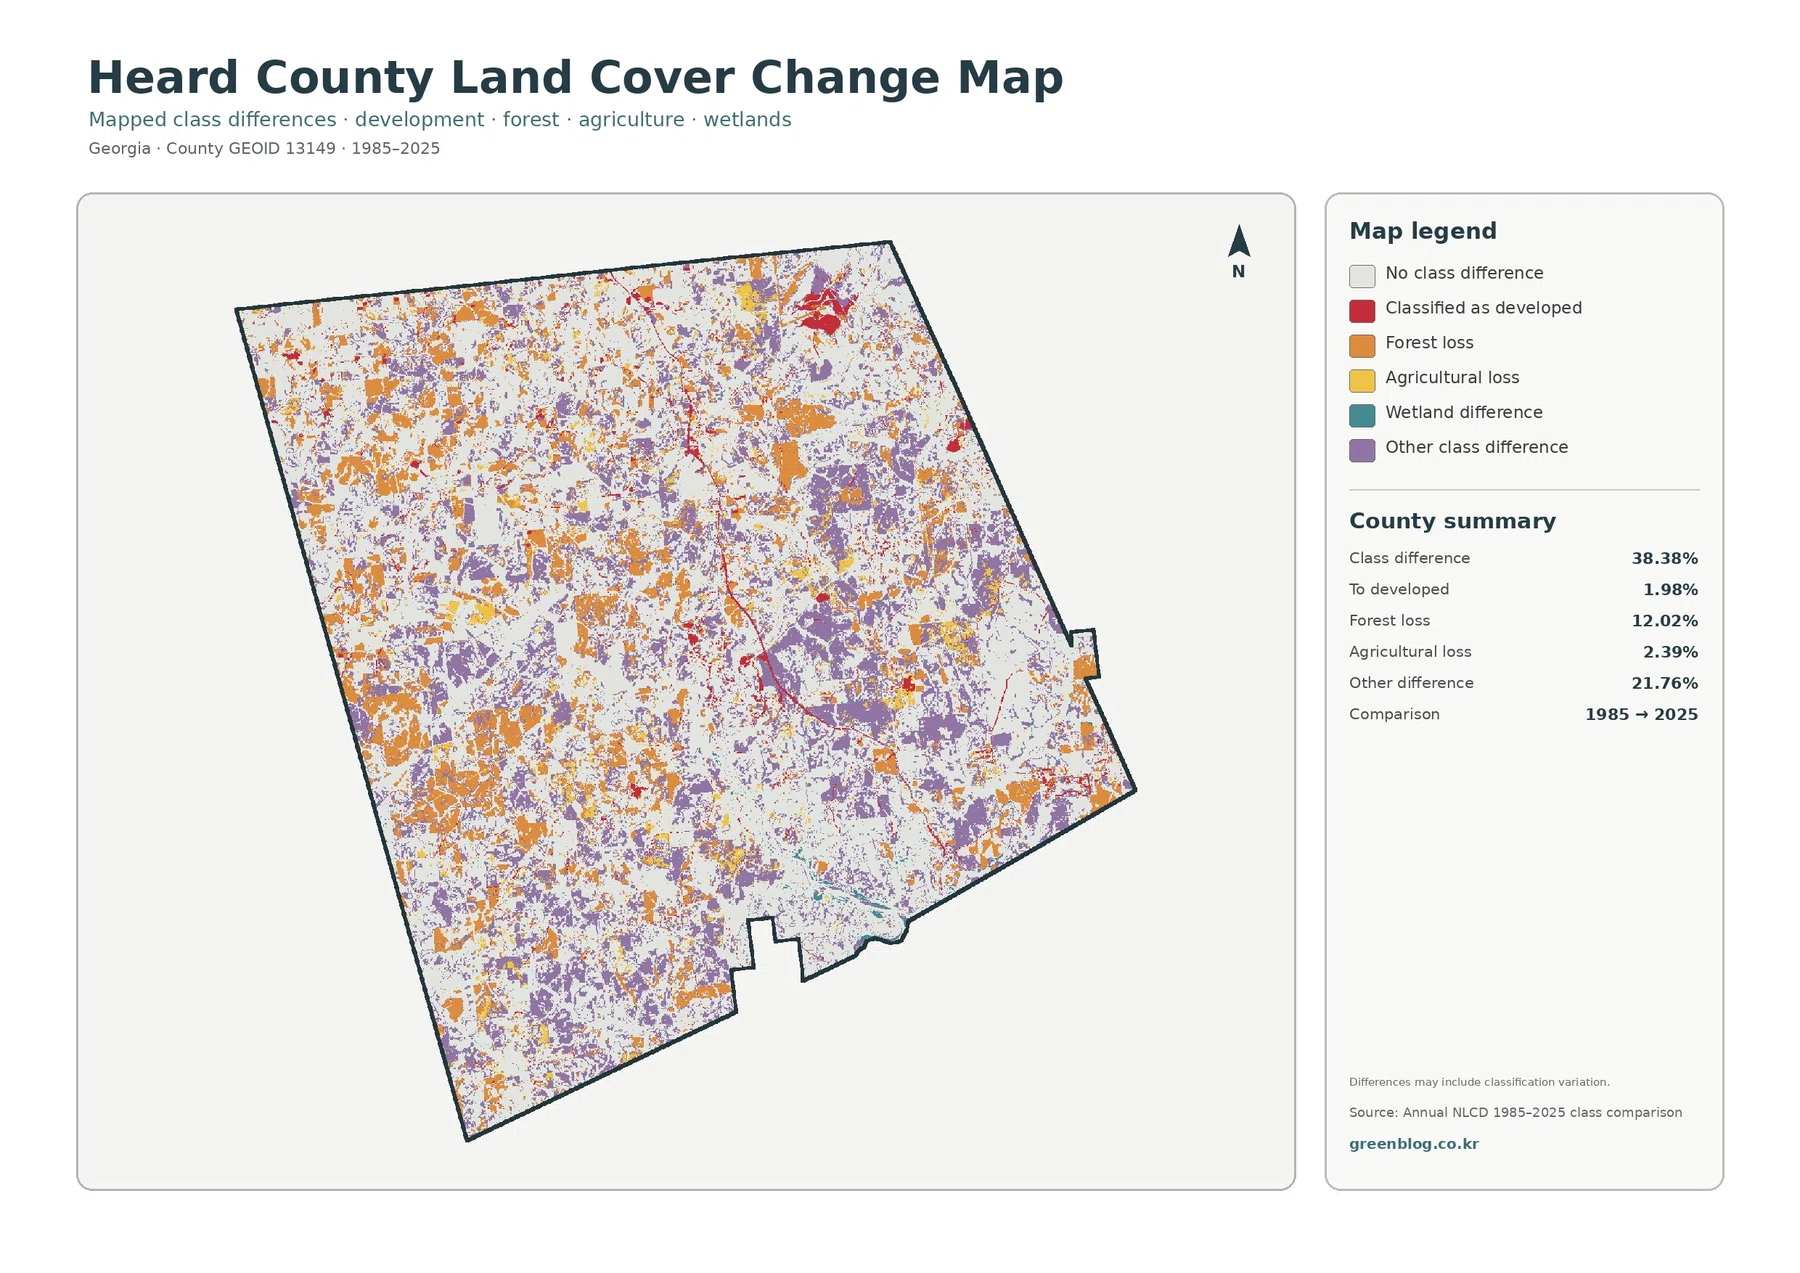
The supplied 1985–2025 comparison reports a total class difference of 38.38%. Its summary also lists 1.98% classified to developed, 12.02% forest loss, 2.39% agricultural loss, and 21.76% other class difference. Orange forest-loss patches and purple other differences are widespread, while red areas classified to developed are more concentrated around settlements and connecting corridors.
The headline number needs to be handled carefully. The map itself states that differences may include classification variation. A cell may genuinely have changed surface cover, but imagery conditions, classification methods, or mixed land-cover signals within a 30-meter cell can also produce a different class between dates. The 38.38% value is therefore a mapped class-difference statistic, not a parcel-by-parcel measurement of verified land-use conversion.
Forest loss at 12.02% is the largest specifically named change category in the summary. It appears in many separate patches rather than one continuous cleared area. Some are near fields or settlement corridors, while others occur inside parts of the county that remain broadly forested in 2025. Determining whether an individual patch represents timber harvest, clearing, storm effects, regeneration cycles, or classification noise requires older aerial imagery and additional records.
The 1.98% classified-to-developed value is much smaller than the present 6.60% developed share. Red change areas do appear near Franklin and other settlement locations, but they are only one part of the long-term pattern. Heard County’s comparison is therefore better described as a mixture of forest change, other class differences, agricultural changes, and localized development rather than a simple story of urban expansion.
Use the four maps in sequence to keep present-day cover separate from long-term change
Begin with the general land-cover map when the goal is to understand the county at a glance. It establishes the 63.87% forest majority, the scattered agricultural and grassland areas, the river corridor, and the relatively small developed footprint. Large color blocks are more meaningful at this stage than isolated pixels. The general map is the best place to decide which part of the county deserves a closer look.
Next, the forest-and-farmland view helps separate cropland from pasture/hay and shrub/grass. That distinction is useful in Heard County because open rural cover is widespread and not all of it is mapped agriculture. The impervious map answers a different question by identifying where hard surfaces concentrate inside the broader developed class. Comparing 6.60% developed cover with a 1.32% mean impervious value makes that difference clear.
Review the 1985–2025 map last. Once the current landscape is familiar, the change categories are easier to interpret without treating every colored patch as confirmed conversion. This order also works well in teaching and presentations: current cover first, rural vegetation detail second, hard surfaces third, and long-term classification differences last.
For print or slide use, consider pairing a county-wide image with an enlargement of Franklin, the Chattahoochee corridor, or the southern approach to West Point Lake. The original JPG files preserve the legends and summary boxes at a larger size than the web previews. They are useful for regional comparison, environmental education, planning context, and general reference, but they are not substitutes for parcel, zoning, or engineering maps.
Thirty-meter cells are useful for county patterns, not parcel boundaries
Annual NLCD is a raster product designed for consistent land-cover mapping across large areas. USGS documentation describes the product at 30-meter resolution. Each cell receives a representative class even when the ground inside that square contains a mixture of trees, grass, pavement, roofs, soil, or water. Zooming in does not turn the cell edge into a surveyed property line.
This matters in Heard County because forest, pasture, cropland, shrub or grass, and rural development often meet along irregular edges. A small yellow patch should not automatically be labeled as a specific farm, and a red pixel should not be treated as a particular building. The maps are strongest when they are used to compare larger wooded blocks, open rural areas, settlement concentrations, and the river corridor.
The change product needs even more caution because it compares classifications from two dates. Its warning about classification variation means the mapped difference can include more than physical land conversion. Forest loss or agricultural loss at the cell level should be verified with historical aerial imagery, land records, forestry information, or field evidence before a cause is assigned.
Finally, land cover is not zoning or development permission. A forest class does not tell you what regulations apply, and a developed class does not indicate that neighboring land can be built on. Parcel ownership, permits, zoning, floodplain requirements, and conservation rules come from separate county and state records. Keeping those data types separate prevents the most common misuse of a land-cover map.
Frequently Asked Questions
What is the dominant land-cover class in Heard County?
Forest is the dominant 2025 class at 63.87%. Agriculture accounts for 13.28%, grassland 6.94%, developed cover 6.60%, and shrubland 4.82%. Water is only 1.36% by area, but the Chattahoochee River forms a long and visually important corridor through the county.
Why is developed cover 6.60% while mean impervious surface is only 1.32%?
Developed land cover can include lower-density places where roads and buildings are mixed with trees, lawns, and soil. Impervious surface measures the hard portion more directly. That is why the mean is much lower than the developed share, while the highest impervious values are confined to smaller settlement centers such as Franklin and selected corridors.
Does the 38.38% class difference mean that much of Heard County definitely changed use?
No. The supplied change map states that differences may include classification variation. The 38.38% figure is a mapped class-difference statistic, and categories such as 12.02% forest loss or 1.98% classified to developed should be treated as screening information until specific locations are checked against historical imagery and other records.
Map File Information
This ZIP contains the four original JPG maps for Heard County: land cover, forest and farmland, impervious surface, and 1985–2025 land-cover change.
- Included Files: Four JPG maps shown on this page
- File Type: JPG files bundled in a ZIP archive
- Intended Use: Printing, education, presentations, and map-based projects
Related Maps
- Appling County Georgia Land Cover Map
- Atkinson County Georgia Land Cover Map
- Bacon County Georgia Land Cover Map
Sources and References
- MRLC Annual NLCD Data – official access and background for Annual NLCD land-cover and impervious products.
- USGS Annual NLCD Land Cover Classification – classification guidance and 30-meter raster context.
- Georgia Department of Community Affairs – Heard County Comprehensive Plan – official planning context for the Chattahoochee River corridor, West Point Lake, and county character areas.
- Heard County Government – History – local background for Franklin, Centralhatchee, Ephesus, farming, and forestry.
- UGA Extension – Heard County – county location and local agriculture and environmental services.
- U.S. Census Bureau TIGER/Line Shapefiles – official geographic boundary data.
Green Map creates custom-edited map images using open geographic data sources such as geoBoundaries, Natural Earth, OpenStreetMap, and government open data. These maps are edited visual materials, not raw data files, and are provided for education, documents, presentations, and graphic reference.