You can download the Marion County map files on this page as a ZIP containing four high-resolution A3 JPGs: a general county map, a ranked city map, a terrain-and-water map, and an elevation map. The previews are designed for quick reading on screen, while the JPG files are better suited to printing, presentations, and larger regional reference work.
Marion County is easiest to understand as a set of valleys, river bends, and upland blocks rather than as one flat area centered on a single town. Jasper sits near the southern middle of the county, close to Kimball and the Tennessee River. South Pittsburg lies farther southwest near the broad river corridor, while Whitwell and Powells Crossroads occupy a separate northeastern part of the county. The western projection around Monteagle adds another distinct piece to the county outline.
The package also provides useful scale figures. The 2020 census count is 28,837, and the July 2025 Census Bureau estimate included with the source material is 29,804. The 2025 Gazetteer figures list 498.3 square miles of land and 14.1 square miles of water. Those countywide numbers are helpful for comparison, but the maps show why people, roads, and developed places are not distributed evenly across the entire 512-square-mile footprint.
Table of Contents
Roads converge near Jasper, then follow different valleys
The general map places Jasper at a useful crossroads for reading the county. Kimball is immediately to the west, South Pittsburg is farther southwest, and Sequatchie appears north of Jasper. From there, the county stretches toward Whitwell and Powells Crossroads in the northeast. Monteagle sits in the narrow western extension, while Orme, New Hope, and Whiteside help define the southern and southeastern edges. Looking at all of these labels together prevents the common mistake of treating the Jasper area as if it represented the whole county.
Several numbered routes show how travel is shaped by the terrain. Route 24 runs across the southern part of the map near the Jasper–Kimball area. Routes 41 and 28 lead away from Jasper toward the interior, and 108 and 283 appear around Whitwell and Powells Crossroads. The Monteagle side is tied to routes 64 and 2, while 72, 134, and 156 appear in the southern and southeastern part of the county. On a map with steep ridges and major water crossings, the direction of the road matters as much as the straight-line distance between two places.
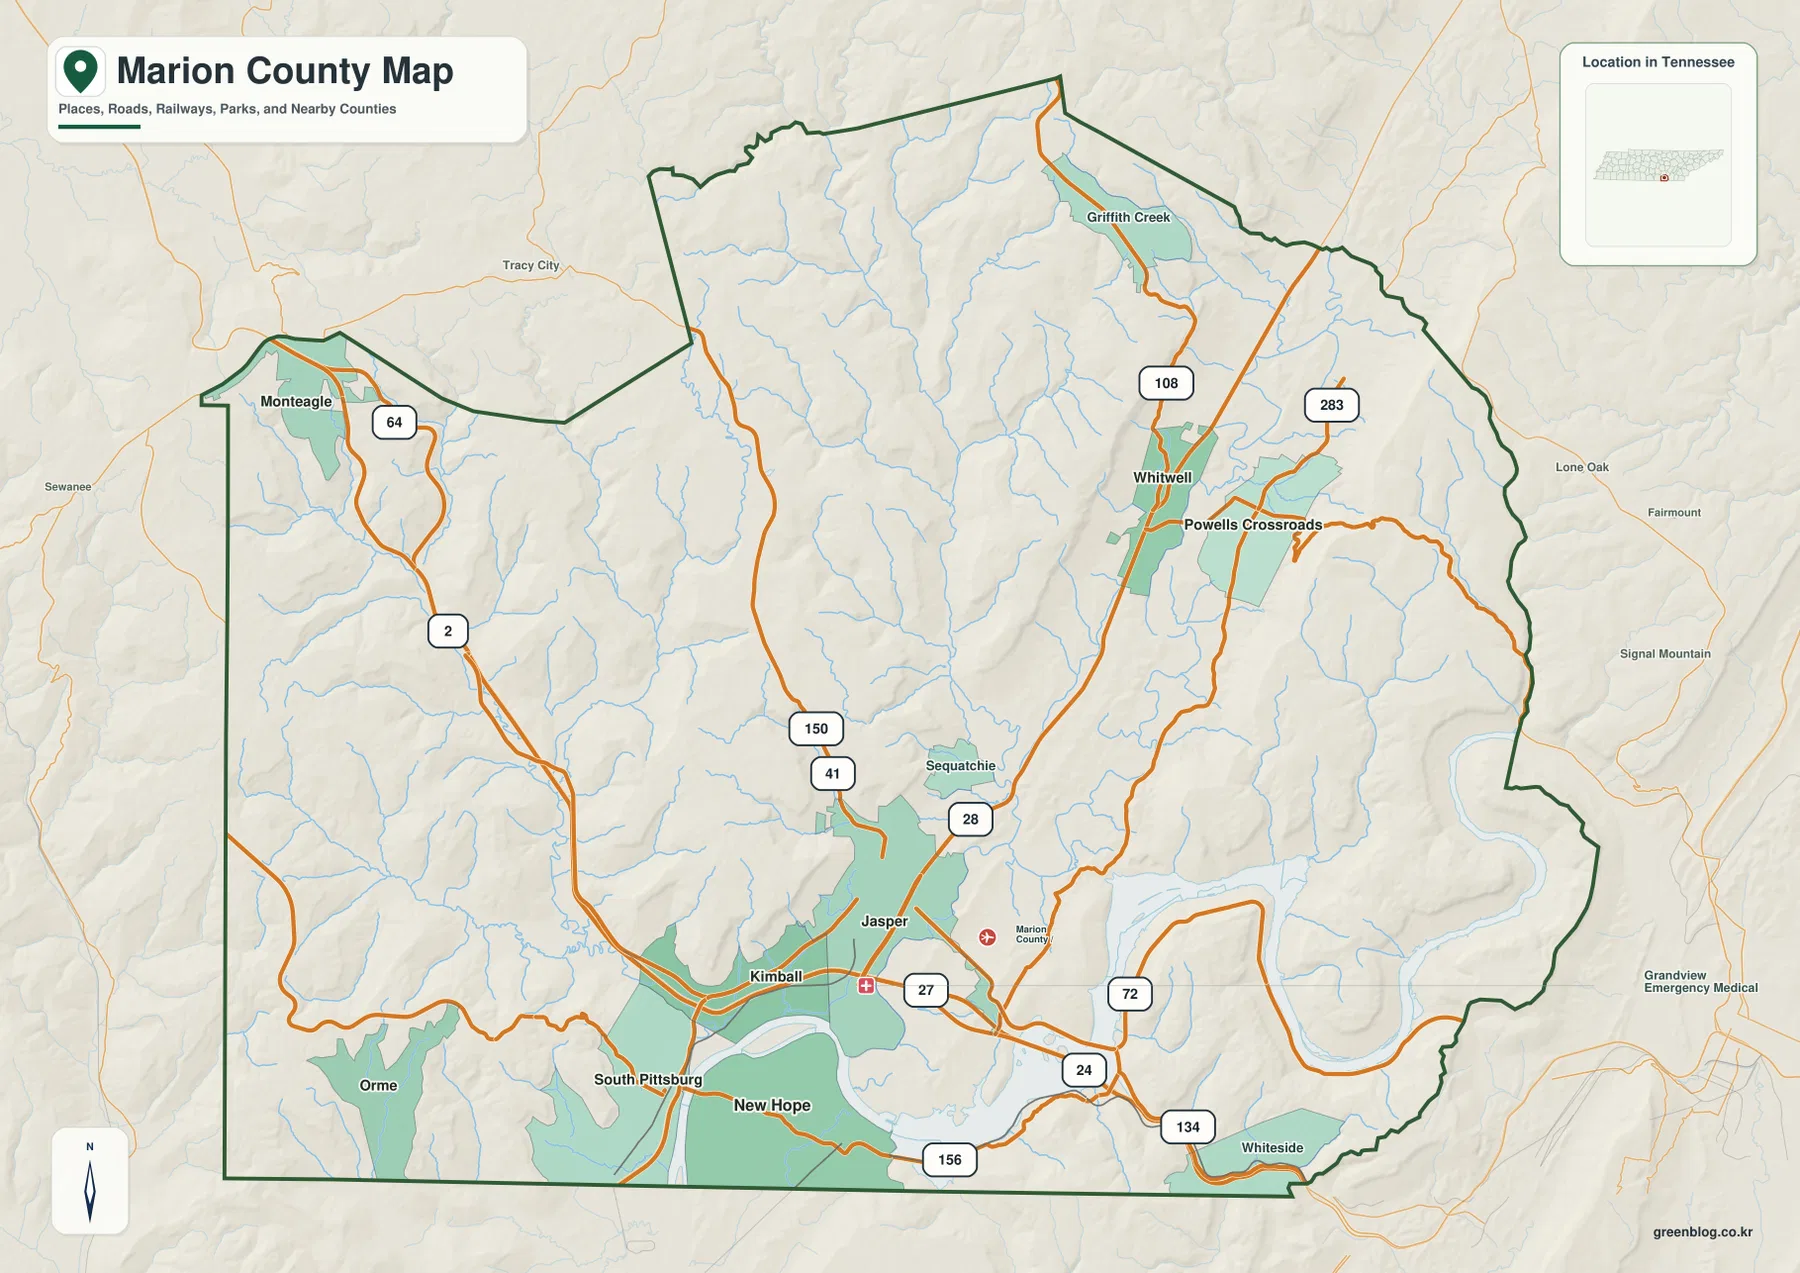
This map is the best starting point when the task is simply to locate a community, compare routes, or see how the county boundary bends around the surrounding landscape. It also shows nearby labels outside the boundary, which are helpful for orientation. For turn-by-turn navigation, bridge status, construction, or property-line work, however, a static county map should be paired with the appropriate current transportation or land-record source.
The city index separates the southern cluster from Whitwell
The city map ranks six labeled places, giving a quick sense of where the larger population centers sit. Jasper is listed first at 3,612, followed by South Pittsburg at 3,013 and Whitwell at 2,052. Kimball is fourth at 1,639, Powells Crossroads fifth at 1,498, and New Hope sixth at 862. The important point is not the ranking by itself; it is the geography behind the ranking. Four of the labels are concentrated in or near the southern river-and-road system, while Whitwell and Powells Crossroads form a visibly separate northeastern pair.
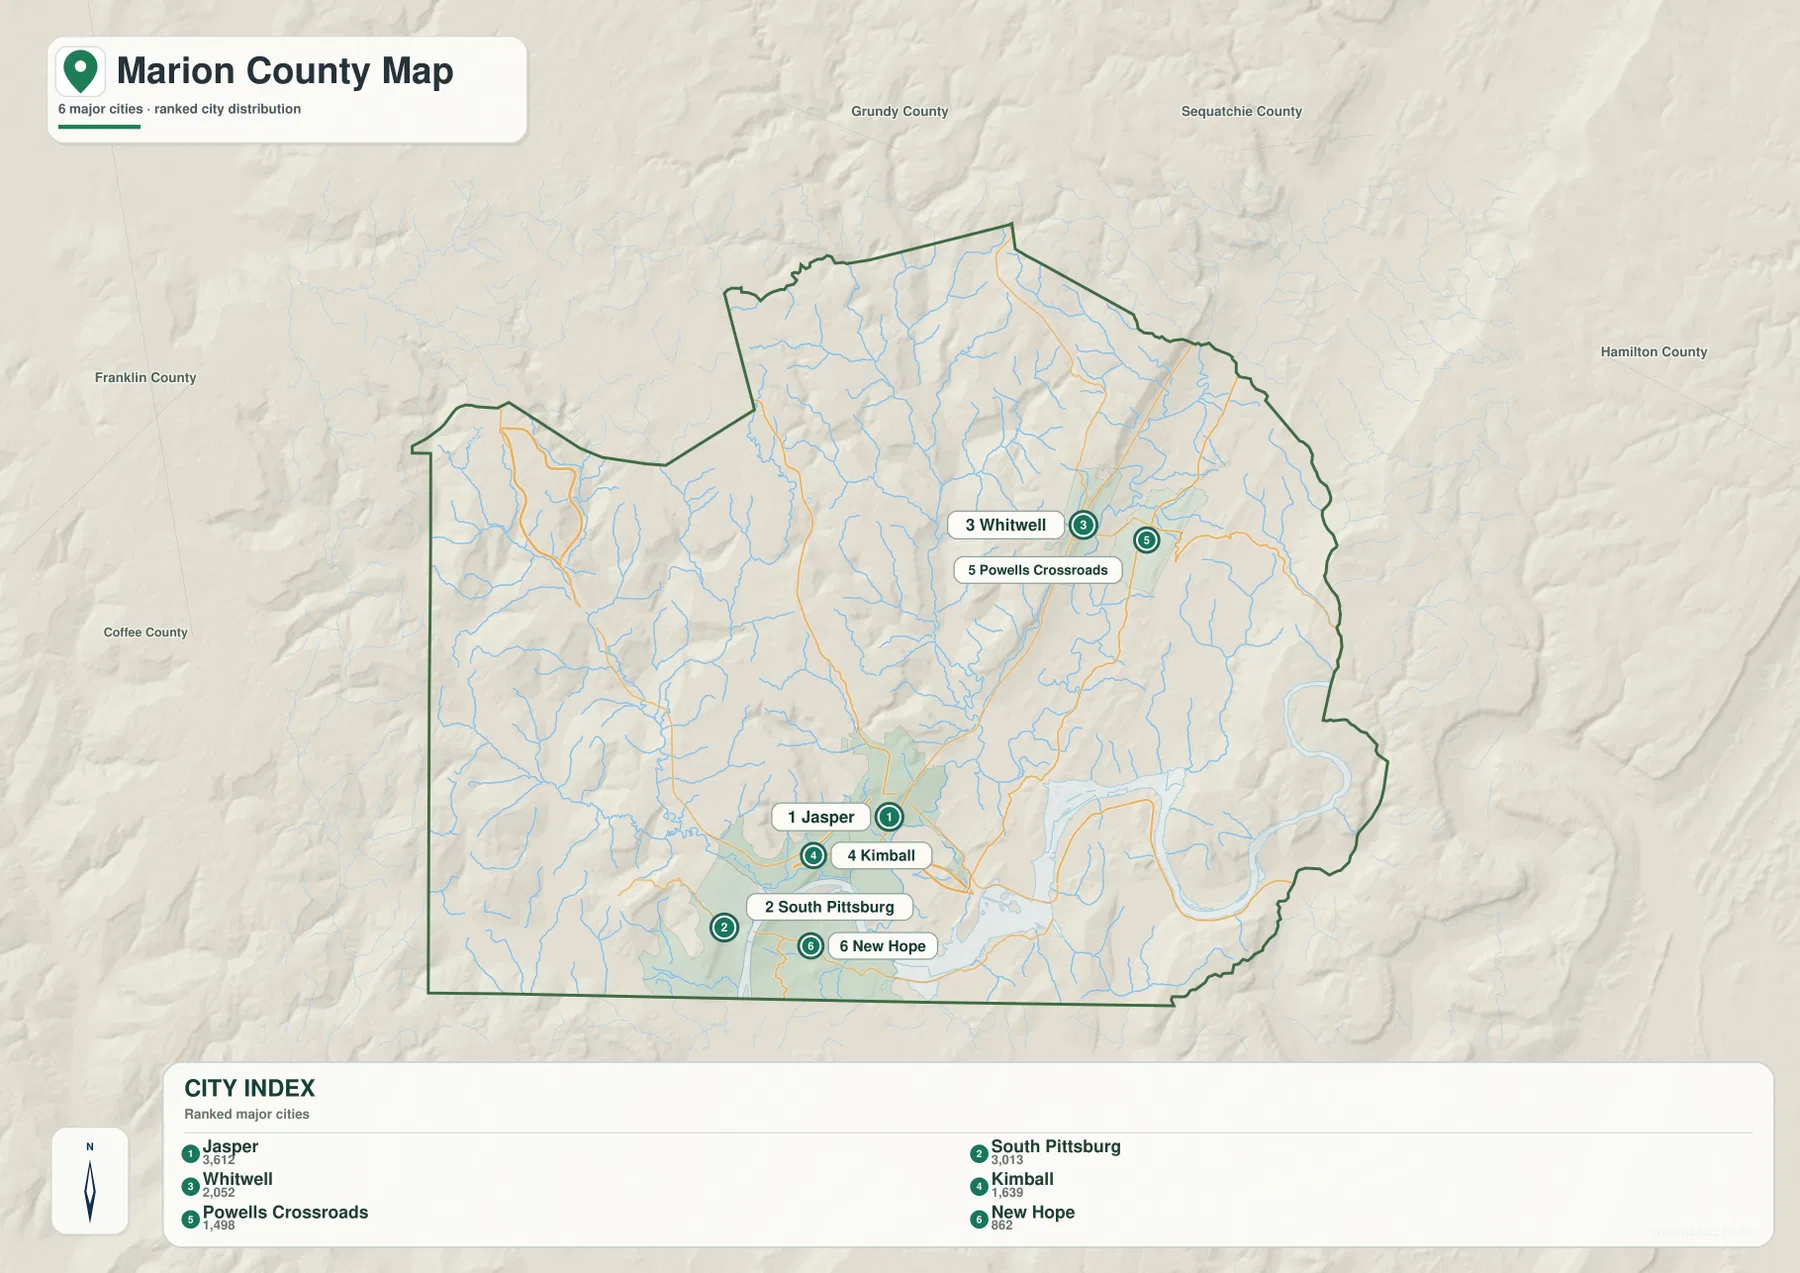
Jasper is also the county seat, so it has an administrative role that the population ranking alone does not explain. South Pittsburg is a better reference for the southwest river corridor, and Whitwell is the stronger reference for the northeastern valley. Kimball helps connect the Jasper area to the southern highway network, while New Hope sits close to the broad water corridor. When a place name is being used to describe location, these relative positions are usually more informative than treating all six labels as equivalent dots.
Nickajack Lake and the Tennessee River dominate the southern water map
The water map makes the southern part of Marion County look very different from the northern uplands. The Tennessee River bends across the lower county, and Nickajack Lake spreads through the same corridor as a broad, easily recognized body of water. Guntersville Lake is labeled at the southwest edge of the map, while Browns Lake and Cummings Lake appear to the southeast and Baylor Lake is shown beyond the eastern side. These large water shapes explain why nearby roads are funneled toward a limited number of crossings instead of running in straight lines across the county.
Farther north, the drainage network is defined by narrower rivers and creeks. The Little Sequatchie River descends through the central-northern area, while the Sequatchie River curves through the northeast and continues toward the Tennessee River. The map also labels Little Gizzard Creek, Big Fiery Gizzard Creek, Battle Creek, and Big Dry Creek. Their branching forms line up closely with the lower channels visible on the elevation map, making the two map types especially useful when viewed together.
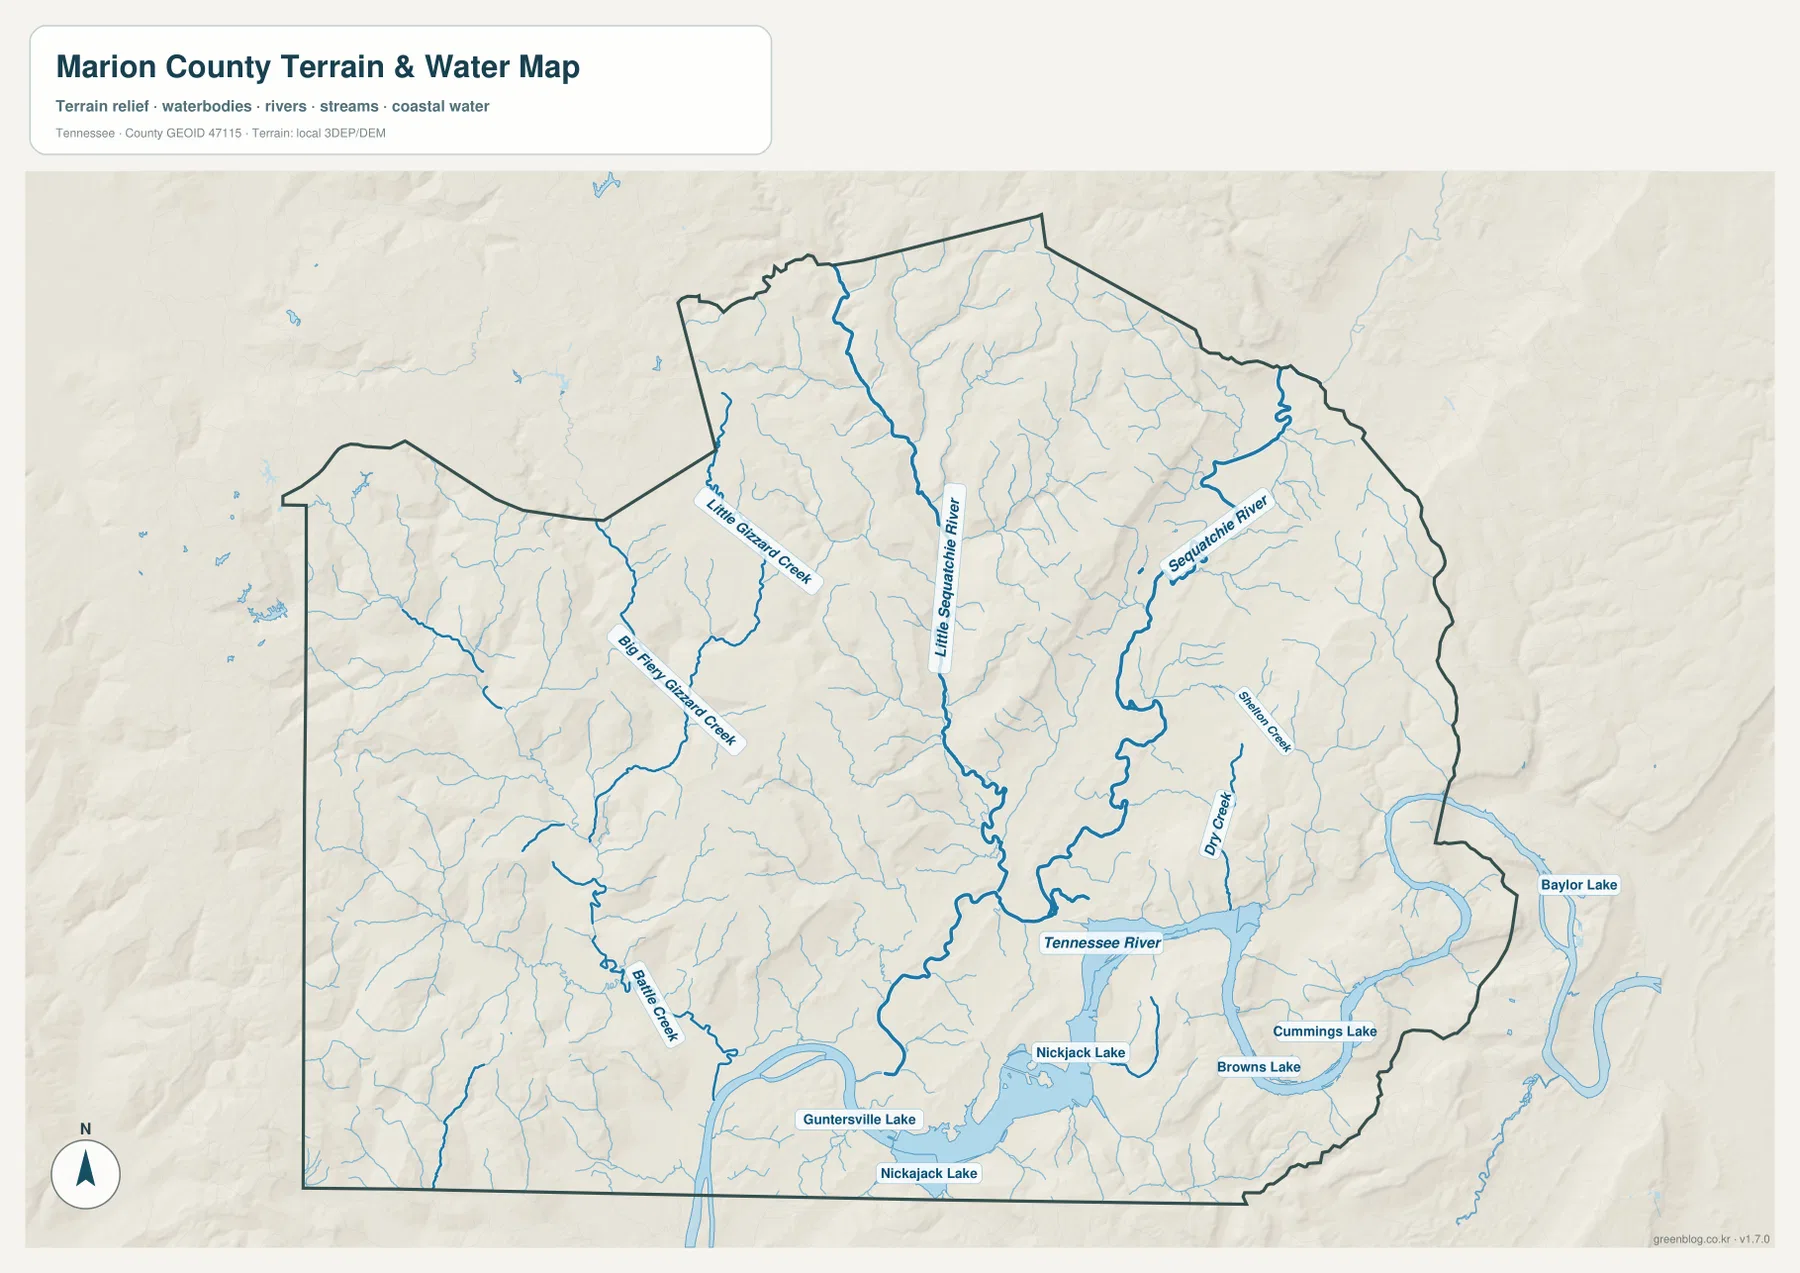
For recreation or field planning, this map is useful as a regional reference rather than a live water-conditions map. Shorelines, access points, launch availability, and river conditions can change. Its strongest value on this page is showing where the major water corridor sits in relation to Jasper, South Pittsburg, New Hope, the surrounding ridges, and the road network.
A 182–727 m elevation range explains the county’s sharp relief
The elevation legend reports an actual range of about 182 to 727 meters, with a mean near 399 meters. That span is large enough to create a strong visual split between valley floors and surrounding high ground. A long green lowland runs through the central and northeastern part of the county, while brown and tan uplands rise on both sides. Higher terrain is especially prominent across the north and along several western and eastern ridge blocks. The Tennessee River and Nickajack Lake corridor is among the lower parts of the mapped landscape.
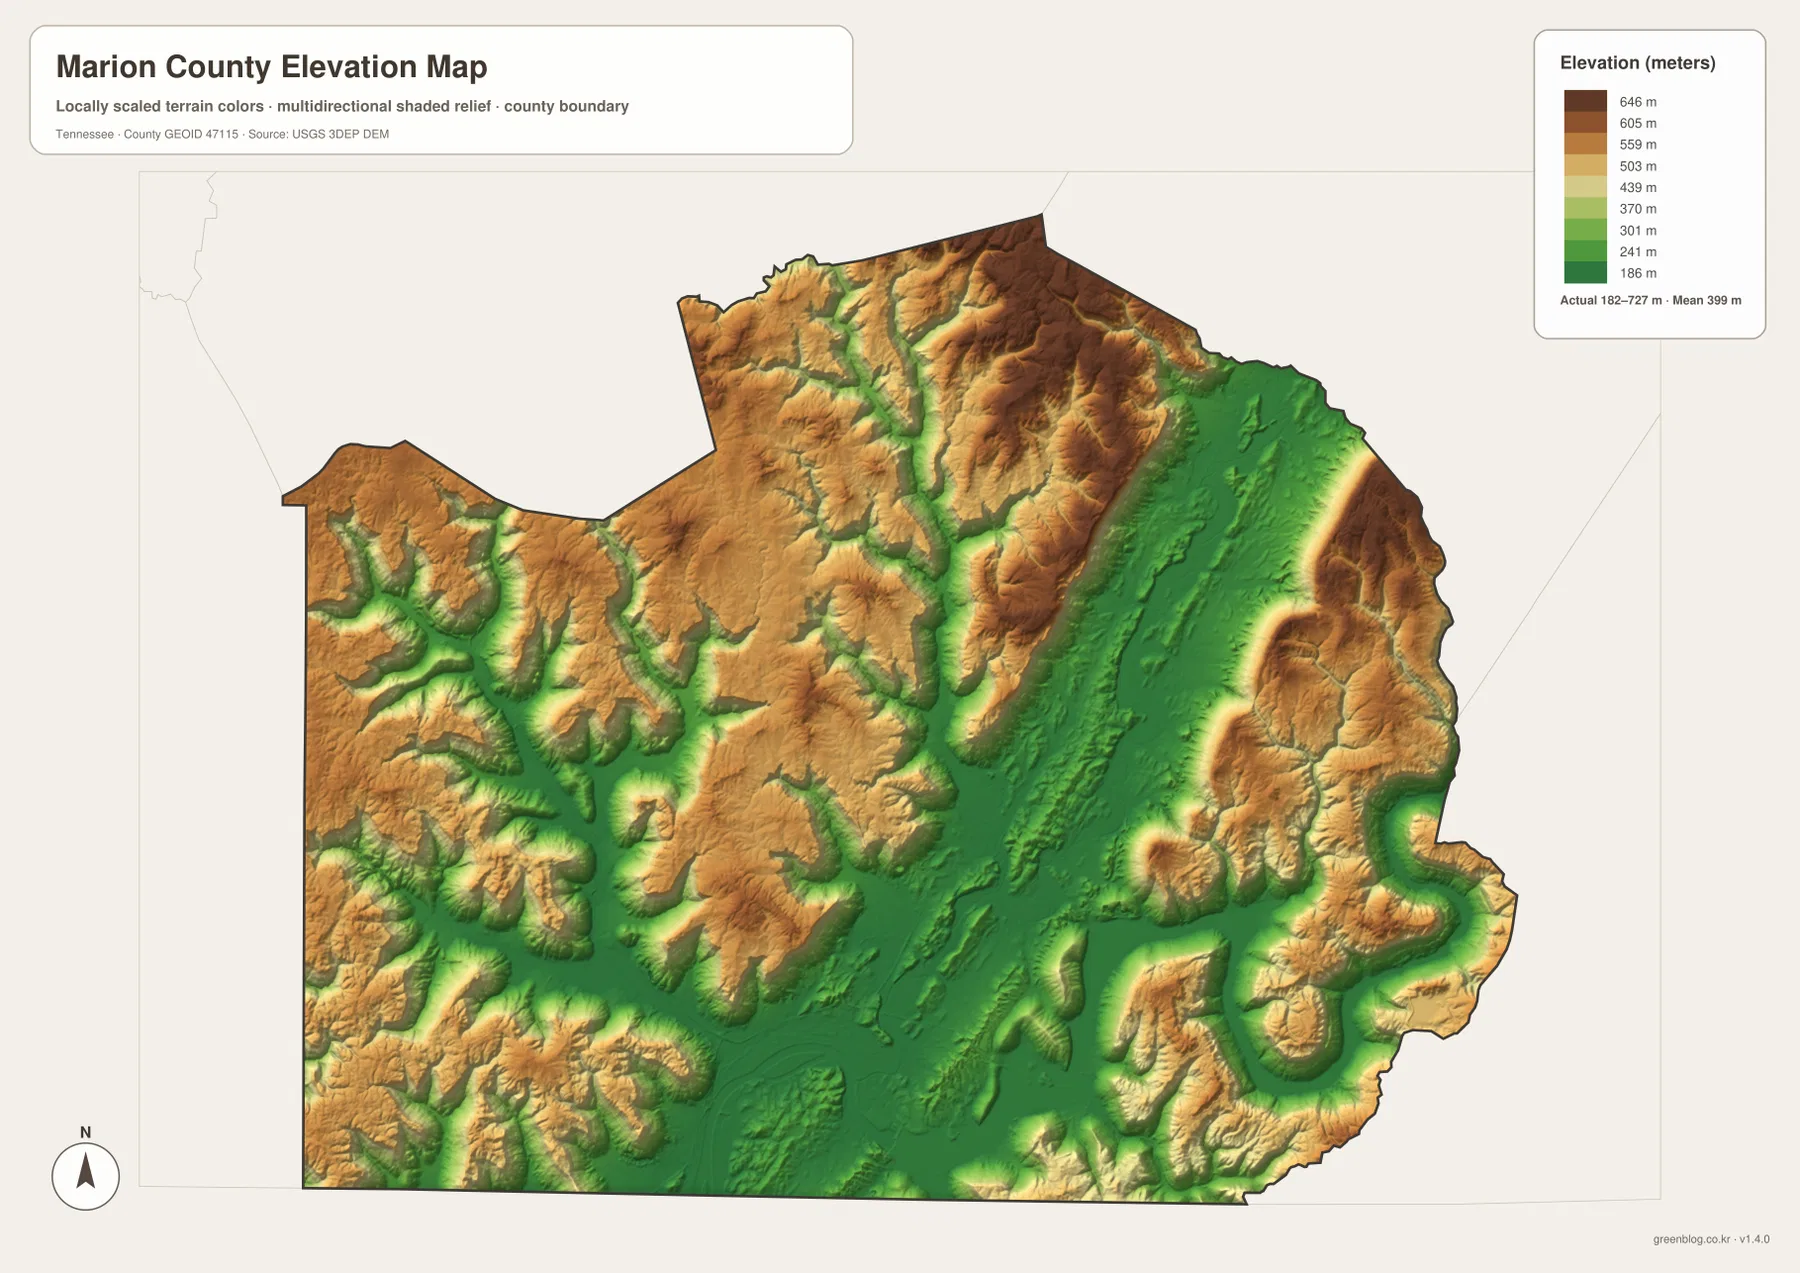
This relief helps explain several patterns that are less obvious on the general map. Whitwell sits within the long northeastern lowland rather than on the surrounding high ridges. Jasper and Kimball occupy a lower southern setting near the river system. Roads often trace valleys, cross water at selected points, or bend around steep ground. The elevation image therefore adds practical context: it explains why two places that look close in a simple outline may not be connected by the shortest possible road.
The western projection and curved eastern boundary make orientation important
Marion County’s outline is distinctive. The Monteagle area forms a narrow western projection, and the northern boundary steps around high ground before turning toward the northeast. On the eastern side, the county line bends through rugged terrain toward the Hamilton County direction. The southern boundary follows a very different setting, with Orme at the southwest end, the broad Tennessee River system through the middle, and Whiteside toward the southeast. Those contrasting edges are useful landmarks when comparing this map with neighboring counties.
The city map places Grundy County, Sequatchie County, Hamilton County, Franklin County, and Coffee County around Marion County for orientation. Those surrounding labels are not a substitute for a legal boundary survey, but they make regional direction much easier to understand. A reader can quickly see that Whitwell points toward the northeast side of the county, Monteagle belongs to the western projection, and Jasper is much closer to the southern river corridor than to the northern edge.
Choose the map by the question you need to answer
Use the general county map for boundaries, major roads, and a broad place-name reference. The city map is cleaner when the goal is to compare Jasper with South Pittsburg, Whitwell, Kimball, Powells Crossroads, or New Hope. The water map is the better choice for the Tennessee River, Nickajack Lake, the Sequatchie system, and named creeks. The elevation map is most useful when route shape, valley position, or the difference between lowland and ridge terrain matters. Switching between them is more informative than trying to force every detail onto one crowded image.
The JPGs are intended for larger viewing and reuse in ordinary reference materials. They are not substitutes for parcel surveys, real-time navigation, flood warnings, or current boating regulations. For those tasks, the official agency sources linked below should be treated as the current reference.
Population and area figures add scale without flattening the geography
Using the 2020 population of 28,837 and the 498.3-square-mile land figure gives an average of roughly 57.9 residents per square mile. That average is useful for broad county comparisons, but it does not describe what the city map actually looks like. The populated places are visibly concentrated in particular valleys and road corridors, while large ridge areas contain far fewer labeled centers. The 14.1 square miles of water are also not spread evenly; the Tennessee River and reservoir corridor creates a large concentration in the south.
The July 2025 estimate of 29,804 should also remain distinct from the 2020 census count. One is an estimate for a later date and the other is a decennial census result. Keeping those labels clear matters on a map page because readers often reuse numbers in school, planning, or regional comparison work. The figures are best treated as context for the mapped geography rather than as a replacement for the map itself.
Frequently Asked Questions
Which place is the county seat on the Marion County map?
Jasper is the county seat. It appears in the southern-middle part of the county, close to Kimball and north of the main Tennessee River and Nickajack Lake corridor. Its administrative role is separate from the city ranking, so it is the best first reference when locating county government.
Where is Nickajack Lake in relation to Jasper and South Pittsburg?
Nickajack Lake is shown across the southern part of Marion County along the Tennessee River system. Jasper is north of the broad water corridor, while South Pittsburg lies farther southwest near the river. The water map makes this relationship much easier to see than a city-only map.
What does the elevation map reveal that the road map does not?
It shows why the county’s roads and settlements favor certain corridors. The mapped elevation ranges from about 182 to 727 meters, with a long lower valley through the center and northeast and higher ridges on both sides. That relief helps explain Whitwell’s valley setting, the low Jasper–river area, and the winding road geometry across the county.
Sources and Reference Data
The following official sources are useful for checking county history, roads, population, hydrography, and elevation. Because this page presents static reference maps, consult the relevant agency directly when a current legal boundary, transportation restriction, water condition, or other time-sensitive detail is required.
- Tennessee State Library and Archives – Marion County fact sheet
- Tennessee Department of Transportation – Marion County road reference
- U.S. Census Bureau QuickFacts – Marion County, Tennessee
- USGS National Hydrography
- USGS 3D Elevation Program
Map File Information
The download contains the Marion County general map, city map, water map, and elevation map as high-resolution A3-proportion JPG files in one ZIP archive.
- File Type: Four JPG files in one ZIP
Related Maps
- Polk County Tennessee map | Benton and Ocoee Gorge
- Alamo to Gadsden: A Crockett County Tennessee Map
- Altamont, Monteagle, and Plateau Valleys — Grundy County Tennessee Map
Green Map creates custom-edited map images using open geographic data sources such as geoBoundaries, Natural Earth, OpenStreetMap, and government open data. These maps are edited visual materials, not raw data files, and are provided for education, documents, presentations, and graphic reference.