The Imperial County California Land Cover Map is defined by contrast. Desert shrubland and barren ground cover most of the county, while a broad agricultural area stands out south and southeast of the Salton Sea. Developed land occupies a much smaller share and appears in concentrated patches rather than across the desert. The four maps on this page let readers compare the 2025 surface, agriculture, impervious cover, and mapped differences between 1985 and 2025.
The four original JPG maps are available together in one download near the end of the page. The on-page WebP images are lighter versions for quick viewing. Land cover describes the physical surface class assigned to a raster cell, such as shrubland, agriculture, water, or developed land. It does not establish zoning, ownership, parcel boundaries, water rights, or whether a site can legally be developed.
Table of Contents
Shrubland, barren ground, irrigated fields, and a large inland water body define the 2025 map
Shrubland is the largest mapped class at 40.51%. It covers broad parts of the east and northeast and appears in additional desert areas elsewhere in the county. The category represents land where shrub vegetation is the dominant surface signal. It should not be read as a detailed botanical map, because the class does not identify individual plant communities, ownership, or management status.
Barren land is almost as important, accounting for 32.35%. Large pale areas occupy much of the western desert and extend through portions of the central and eastern county. In a land cover classification, barren does not mean that the land has no environmental value or no vegetation at all. It is a broad surface class for places with sparse plant cover and extensive exposed soil or rock.
Agriculture accounts for 17.28%, but its shape makes it more visually prominent than the percentage alone might suggest. Yellow agricultural cells form a large, organized block south of the major northwestern water body and continue through the south-central part of the county. Straight edges and a field-like grid contrast sharply with the irregular shrubland and barren terrain around them. The map identifies agricultural cover, not individual crops or annual production.
Water covers 5.77% of the county. The largest blue area in the northwest corresponds to the Salton Sea, a major Imperial County landmark discussed in county planning documents and local resource programs. Smaller water features occur elsewhere, including near the eastern edge. At this scale, canals, small ponds, and narrow watercourses may be generalized or omitted, so the map should not be used as a detailed hydrographic boundary source.
Developed land represents 2.99% of the 2025 classification. Red areas are concentrated inside and around the agricultural region and near the southern border, with smaller developed patches elsewhere. Imperial County’s official overview lists cities including El Centro, Brawley, Calexico, Imperial, and Holtville. A county-scale land cover map cannot label every street or neighborhood, but it clearly shows that developed surfaces are clustered around a limited part of the county rather than spread evenly through the desert.
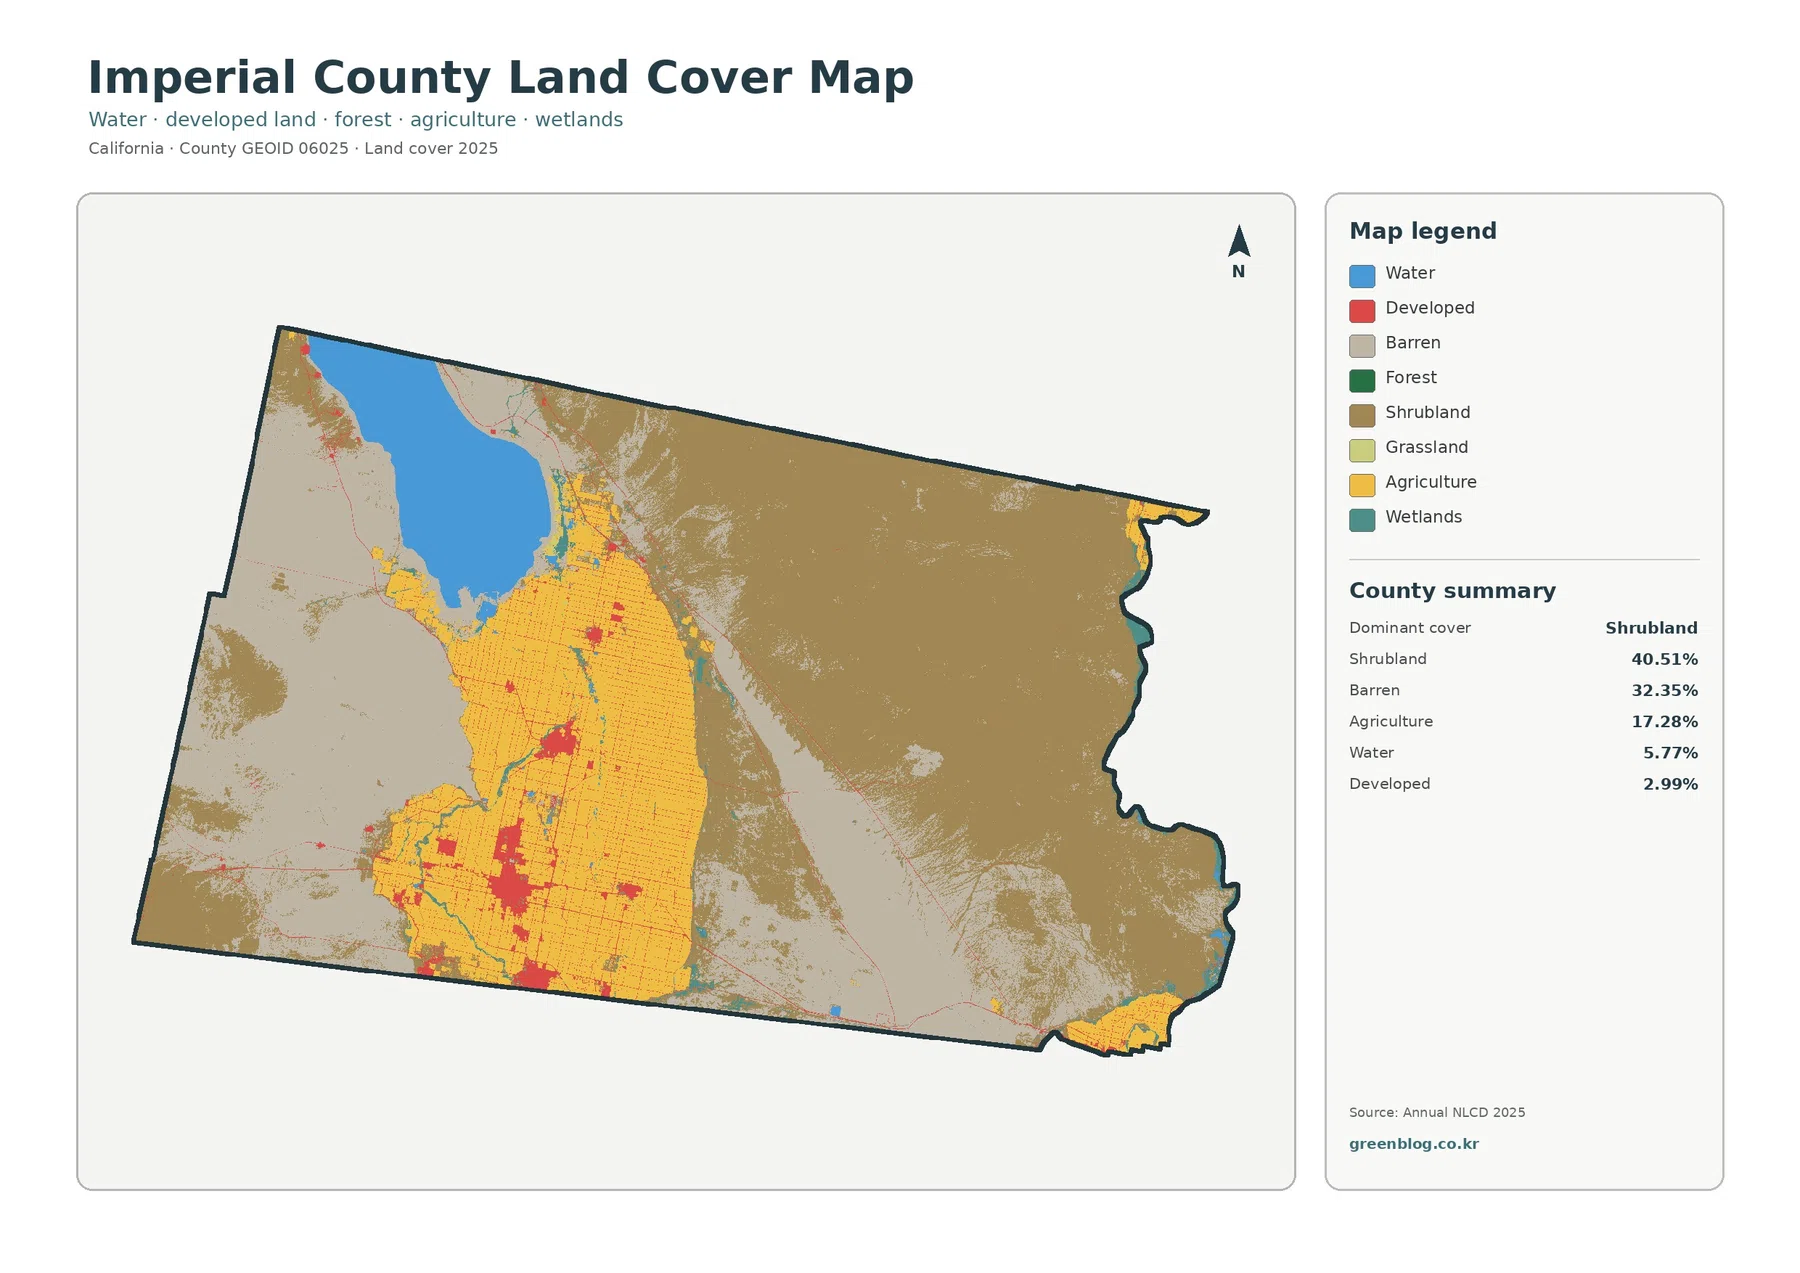
The most useful reading sequence is to start with the two desert classes, then locate the agricultural block and the Salton Sea, and finally identify the smaller developed areas. That approach shows how most of the county remains shrubland or barren ground even though agriculture and settlement are visually concentrated. It also keeps the map focused on observable surface conditions rather than legal land-use categories.
The change map highlights an 8.88% difference without explaining the cause
The 1985–2025 comparison reports a class difference across 8.88% of Imperial County. “Other class difference” is the largest component at 6.90%, followed by 1.05% classified as a transition to developed land and 0.79% agricultural loss. Forest loss is 0.00%. These numbers describe differences between two mapped classifications, not a complete history of what happened on every changed cell.
Purple other-difference cells are especially noticeable around the large northwestern water body and appear in scattered clusters across the south and east. Because the category combines changes that are not assigned to the named development, forest-loss, or agricultural-loss groups, it should remain a broad flag for further review. A purple cell does not by itself reveal whether the underlying cause was a water-level change, exposed ground, vegetation change, or a classification difference.
Red transition-to-developed cells appear in and around portions of the agricultural region and near the southern part of the county. Some of those areas also contain stronger impervious values on the 2025 impervious surface map. The overlap is useful for orientation, but the 1.05% value is not a building-permit total, an annexation figure, or a measured expansion of city boundaries. It is the share assigned to the mapped transition-to-developed category in this two-date comparison.
Agricultural loss is 0.79% and appears as smaller yellow patches along field edges and in scattered locations within the agricultural area. Crop condition, fallow land, image timing, and classification rules can affect whether a cell is assigned to agriculture in a particular year. A reader interested in actual farmland conversion should compare multiple years and consult county agricultural records rather than treating the two-date map as a complete farm history.
The map itself warns that differences may include classification variation. That caution matters around complex boundaries such as shorelines, canals, agricultural edges, and sparsely vegetated desert. The best use of this layer is to identify places that deserve closer examination. Historical imagery, intermediate Annual NLCD years, water-level records, and local planning documents can then be used to investigate a specific location.
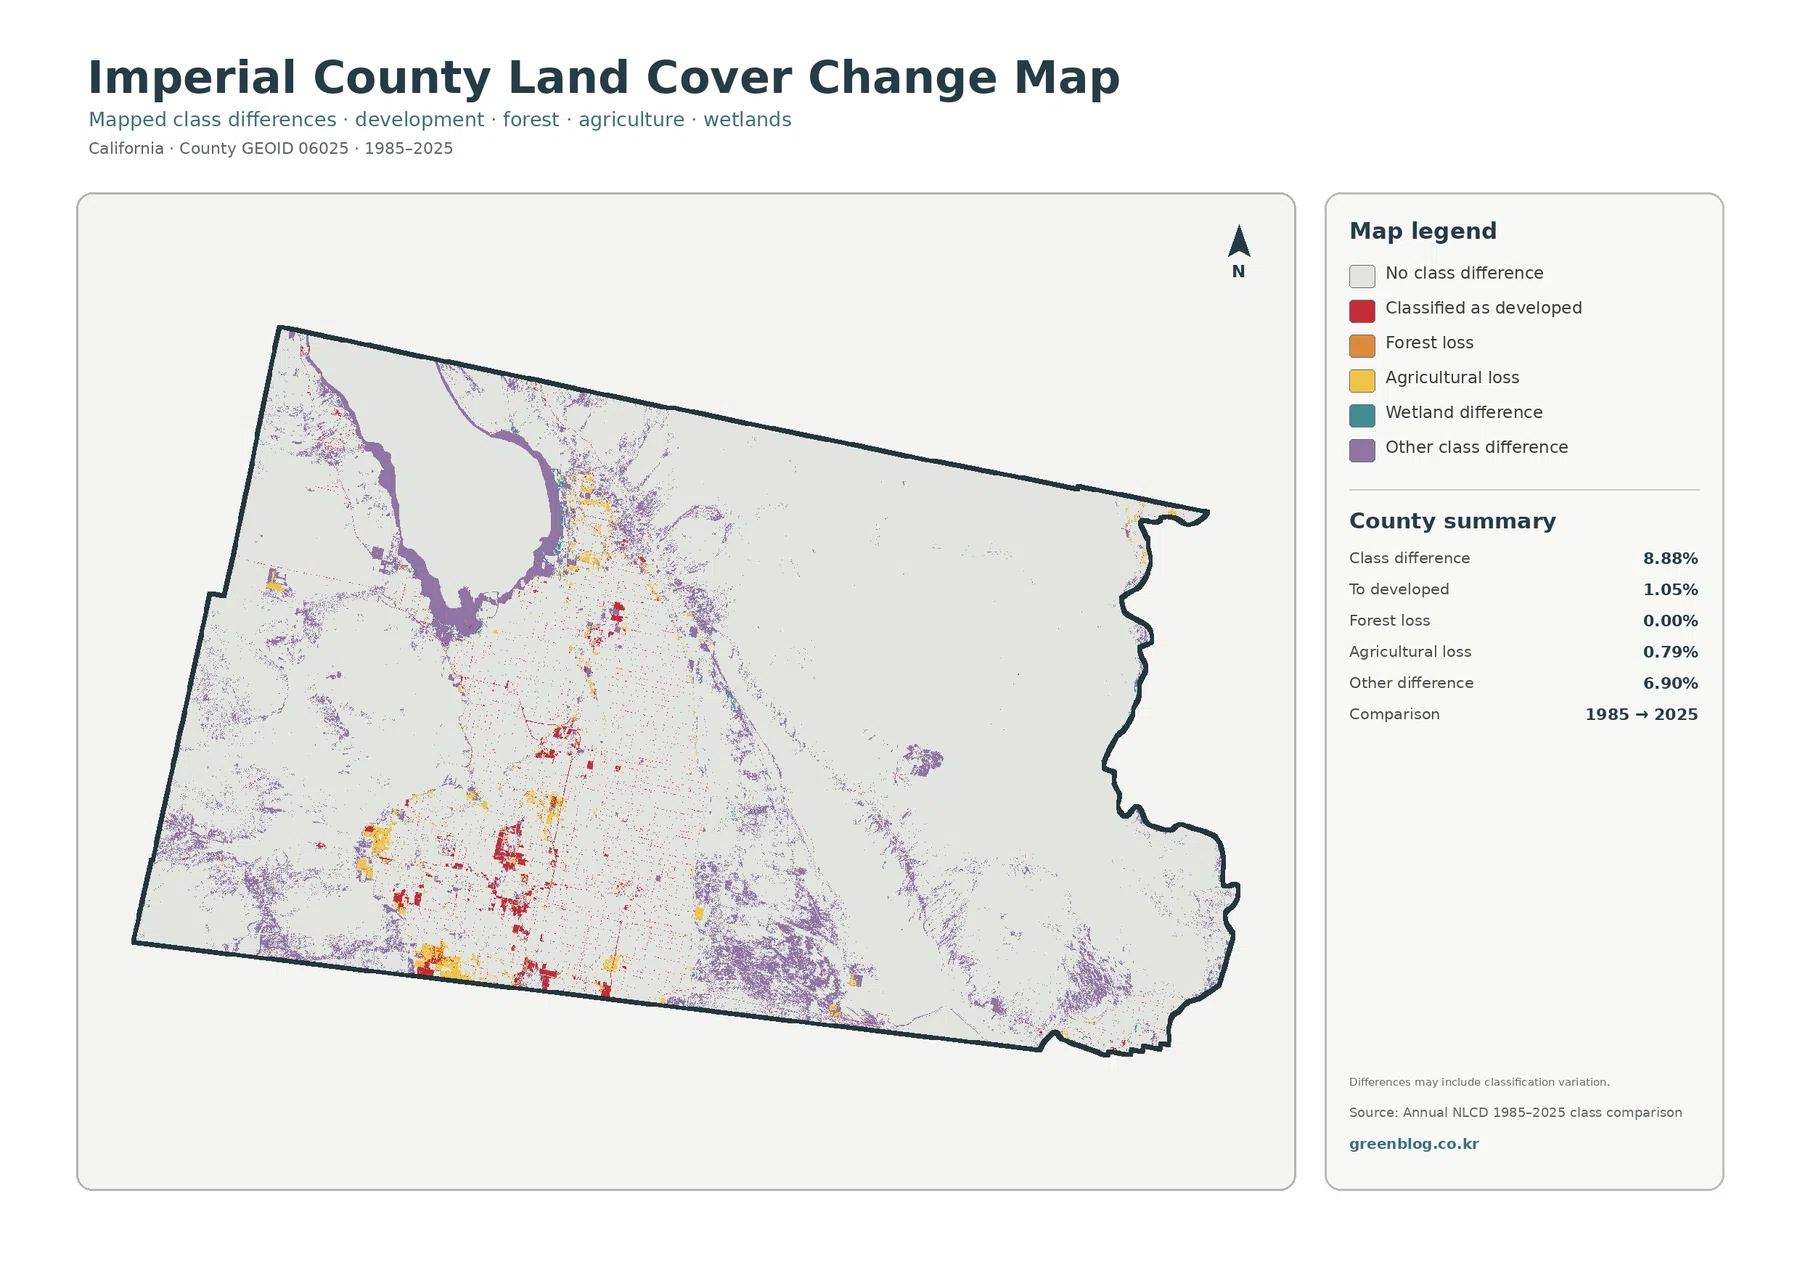
Reading the change map after the 2025 land cover map makes the colors easier to understand. The current map shows what each location is classified as now, while the change layer only indicates that two dates differ. Keeping those two questions separate is especially important around the Salton Sea and agricultural edges, where a visible difference may have several possible explanations.
Forest is effectively absent from the county summary, while agriculture forms a large mapped block
The forest and farmland map simplifies the legend to emphasize vegetation, agriculture, water, wetlands, and developed or other land. Forest is reported at 0.00% and grassland at only 0.06%. Shrubland remains dominant at 40.51%, and agriculture remains 17.28%. In Imperial County, this map is therefore more useful as a desert-versus-agriculture comparison than as a traditional forest-versus-farmland map.
The Imperial County Air Pollution Control District describes the county’s agricultural core as an intensively cultivated area south of the Salton Sea extending toward the international border. That description closely matches the large yellow agricultural zone visible in the map. The official Agricultural Commissioner also publishes annual Crop & Livestock Reports, which provide the production and economic details that a land cover image cannot supply.
The 17.28% agricultural share should therefore be treated as a surface-class percentage, not as a substitute for harvested acreage or crop statistics. A parcel may be temporarily fallow, recently planted, or classified differently depending on the observation date and the rules used by the land cover product. Anyone studying Imperial County agriculture in detail should use this map for location and the county crop reports for production information.
Water accounts for 5.77% and wetlands for 1.03%. Wetland colors appear near parts of the major water body and in smaller strips or patches around the agricultural area. The map can help a reader notice where wet surfaces occur relative to fields and desert cover, but it does not provide regulatory wetland boundaries. Narrow canals and drainage features can also be simplified by the raster resolution.
The shrubland area is much larger than the agricultural area and dominates the east and northeast. Its irregular boundaries contrast with the block-like agricultural pattern. That visible difference provides a simple way to explain how a highly productive farming area can occupy an important part of the county while still being surrounded by a much larger desert landscape.
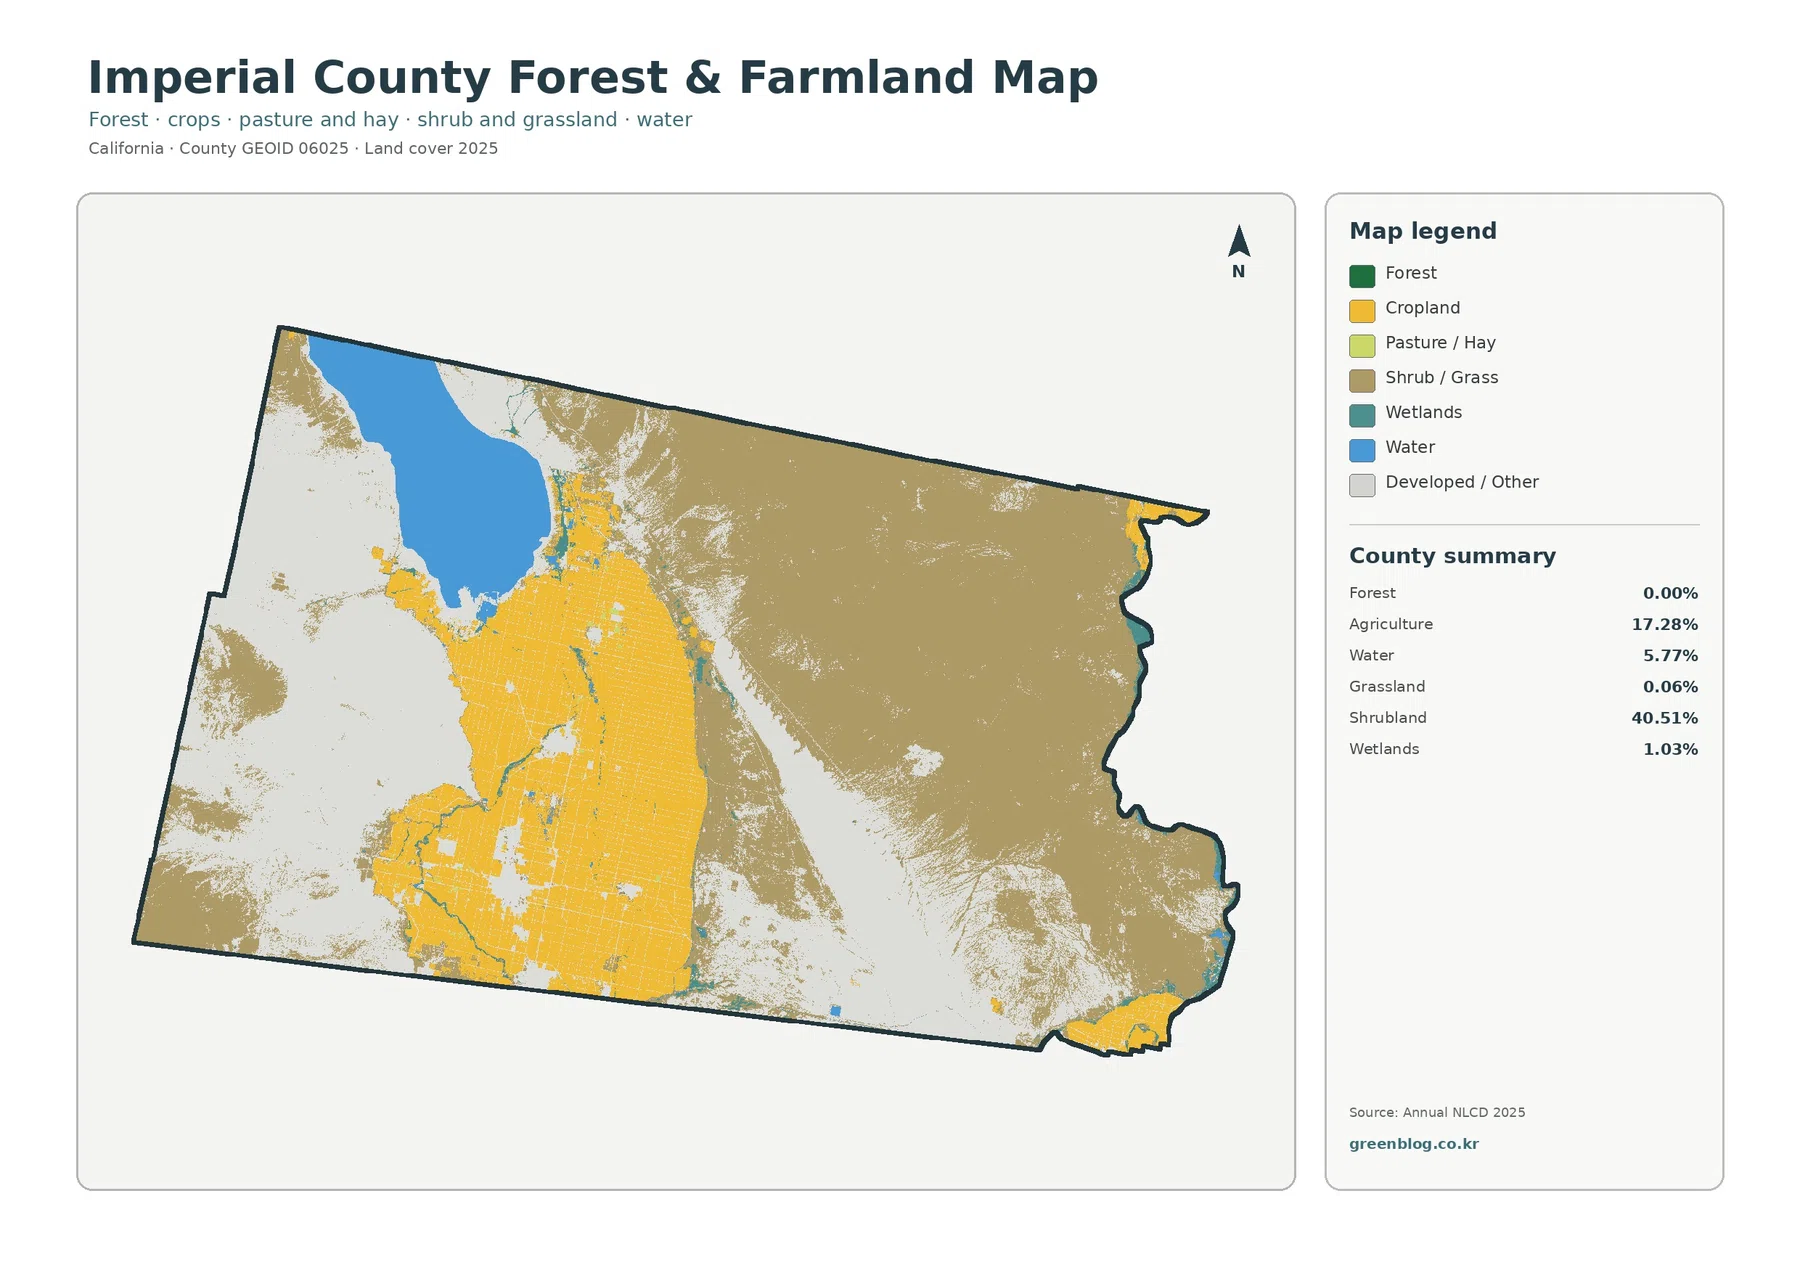
For education or presentation use, this version is effective because the major categories are easier to distinguish than in the full land cover legend. It can introduce the agricultural area, the surrounding desert shrubland, and the Salton Sea before more specialized layers are added. Questions about crop value, irrigation supply, or land-use policy require additional official sources because those subjects are outside the purpose of the land cover classification.
Impervious cover is low countywide but concentrated around settlements and transportation routes
Impervious surface is the percentage of a cell covered by materials such as pavement and rooftops that do not readily absorb water. Imperial County has a mean impervious value of 0.90% in 2025, and 0.49% of the county is at least 50% impervious. Developed cover is 2.99%, which is a broader land cover measure. Developed cells can still contain soil, vegetation, landscaped areas, and other permeable surfaces.
Most of the impervious map is white or very pale. Stronger orange and red values appear in compact clusters through the agricultural region and near the southern border, with thin traces extending along transportation routes. The broad eastern shrubland and barren areas contain very little high impervious cover. This distribution explains why the countywide average remains below 1% even though several local clusters are clearly visible.
The map is not a building footprint layer. A red cell means that a relatively large share of that raster cell is impervious; it does not mark one specific building or provide a survey-grade road width. Calculating imperviousness for El Centro, Calexico, Brawley, or another individual city would require the source raster and the correct city boundary rather than a visual estimate from this countywide image.
Comparing the impervious layer with the general land cover map is useful because it separates two related ideas. Developed land tells readers where a broader developed class occurs. Impervious surface shows how much of the ground is actually covered by hard materials. The two layers overlap in many settlement areas, but they should not be treated as interchangeable measurements.
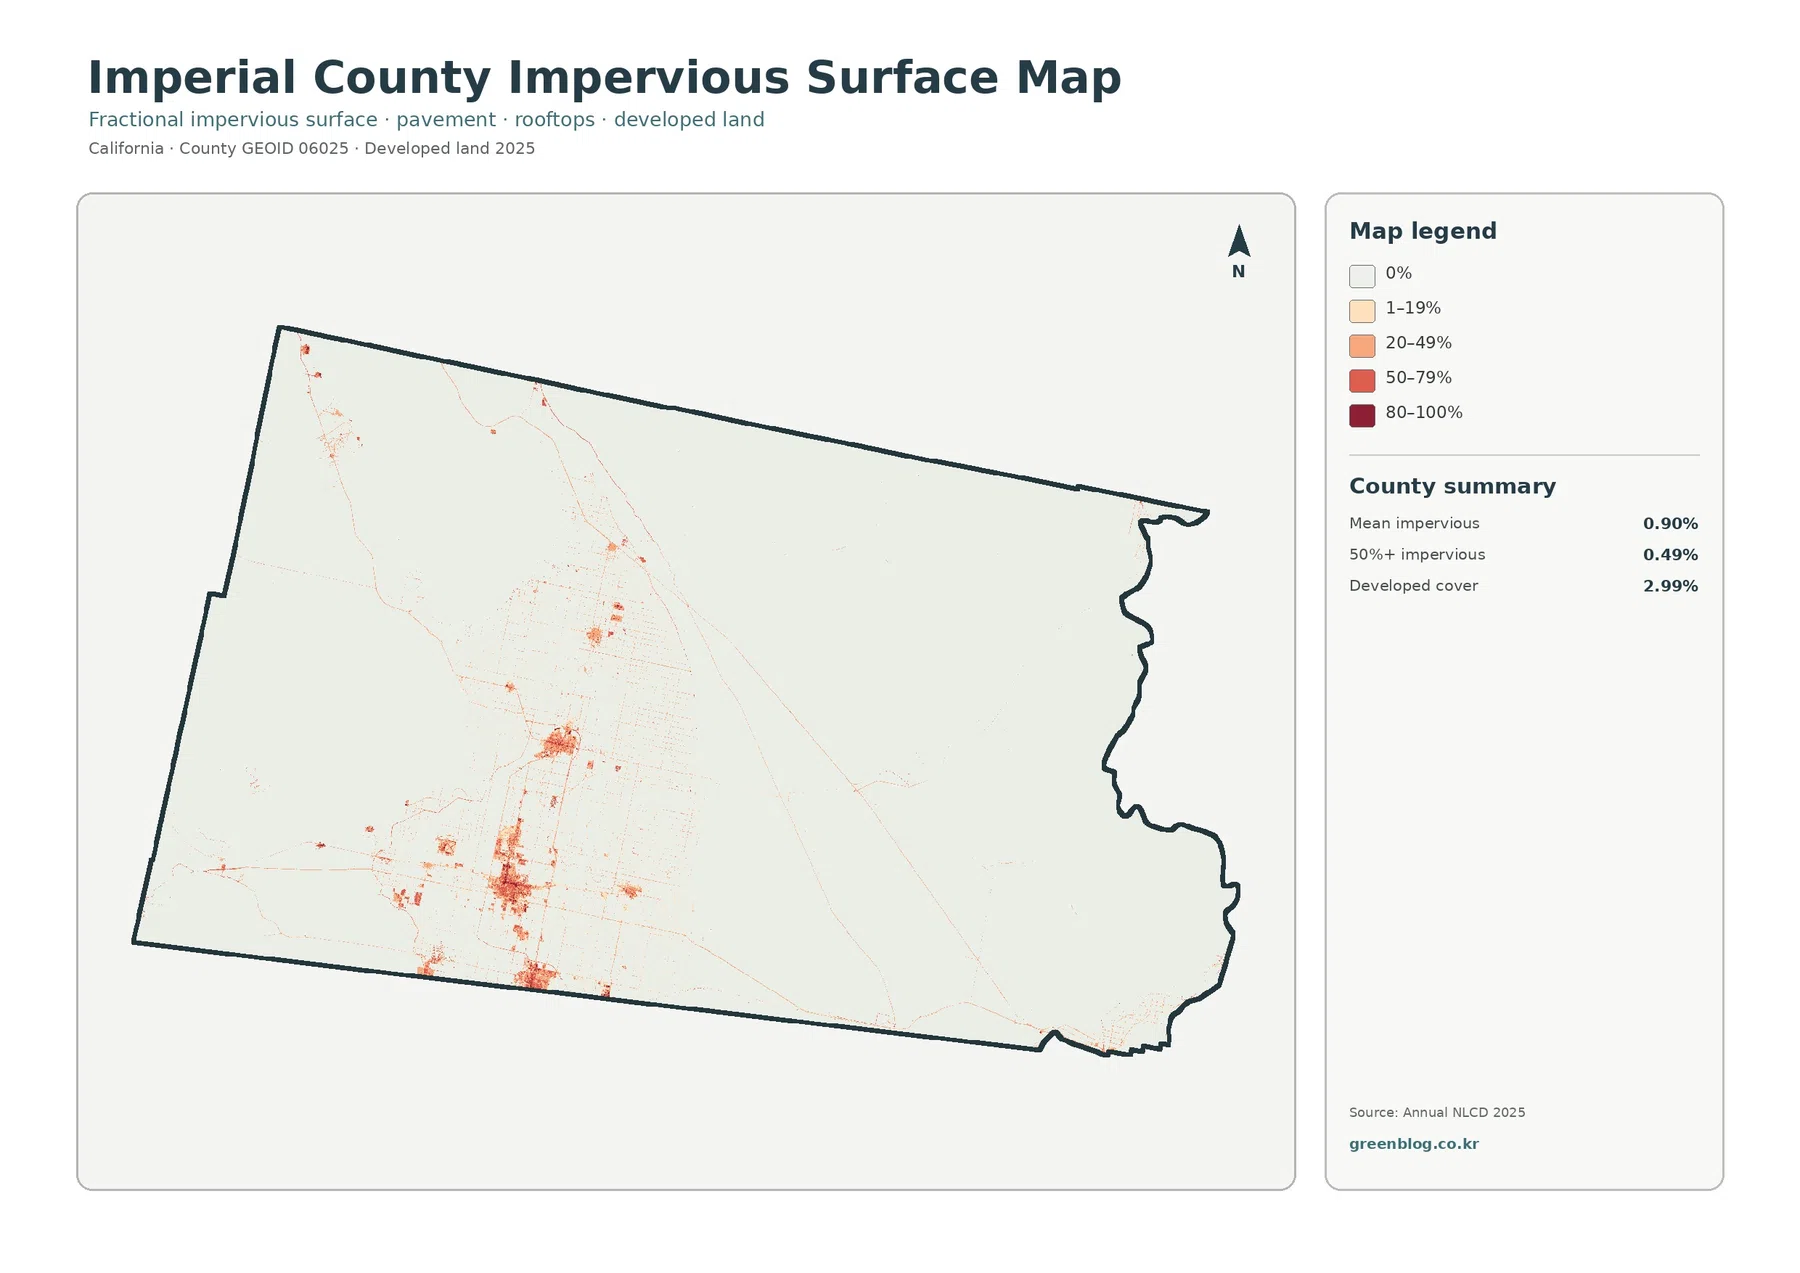
Impervious data can support introductory discussions of urban development, stormwater, and infrastructure, but it does not predict flood risk on its own. Rainfall, soil, topography, drainage systems, canals, and waterways all affect runoff. The map is best used to locate hard-surface concentrations before a more detailed local analysis.
Using the four maps for countywide comparison
A general county profile should begin with the 2025 land cover map because it contains the broadest set of classes. Shrubland at 40.51% and barren land at 32.35% establish the desert setting, while agriculture at 17.28%, water at 5.77%, and developed land at 2.99% identify the most prominent non-desert features. This single view is useful for orientation before a reader moves to a specialized layer.
For agriculture, the forest and farmland map is simpler and easier to explain. It removes some of the detailed categories and makes the contrast between the large agricultural zone and surrounding shrubland clear. Pairing it with the Imperial County Agricultural Commissioner’s Crop Reports creates a better research workflow: use the map for location and the reports for crop-specific statistics.
For settlement and infrastructure, the impervious layer provides a different measure from the developed class. A presentation can show 2.99% developed cover on one map and a 0.90% countywide mean impervious value on another. That comparison demonstrates why a developed landscape does not mean that every surface is paved or roofed.
For environmental change, the 1985–2025 map is most useful after the present-day layers have been reviewed. Purple differences around the Salton Sea and scattered changes elsewhere can then be checked against the current surface class. County planning documents discuss Salton Sea restoration and desert conservation, providing policy context without turning the land cover map into a regulatory plan.
These maps also work well as a set because they use the same county outline. A reader can compare the agricultural block, desert classes, developed clusters, and long-term differences without mentally adjusting to a new boundary each time. The main limitation is scale: countywide patterns are clear, but parcel-level decisions require more detailed data.
Download the four original JPG maps
The WebP images on the page are intended for fast browsing. The download ZIP contains the four original JPG files for general land cover, forest and farmland, impervious surface and developed land, and the 1985–2025 land cover change comparison. The set is suitable for reports, slide decks, lessons, and personal research notes where the same county boundary needs to be compared across several themes.
Keep the title, legend, and dates when reusing the images. The first three maps describe 2025 conditions, while the change map compares 1985 and 2025. Removing the legend can make similar colors difficult to interpret, and removing the date can cause a current-condition map to be confused with a historical comparison.
These files are reference graphics for county-scale comparison. They are not substitutes for parcel records, survey plans, zoning maps, legal wetland boundaries, agricultural preservation maps, or engineering studies. A site-specific decision should begin with the appropriate current agency dataset after the area of interest has been identified on the county map.
Scale, classification, and date limits
Annual NLCD products generally organize land cover as raster cells about 30 meters across. A raster cell is a small square unit in the dataset. Several real surfaces can exist inside one cell, yet the final map must assign a class or an impervious percentage. Narrow canals, small buildings, field edges, and desert vegetation boundaries can therefore appear simpler than they are on the ground.
Imperial County contains many sharp visual transitions between fields, canals, bare ground, and shrubland. Those transitions are useful at county scale but should not be treated as legal parcel boundaries. A yellow agricultural cell identifies mapped agricultural cover; it does not establish property ownership, crop rights, zoning, or the exact edge of a farm parcel.
The countywide mean impervious value has the same limitation. A 0.90% average combines extensive desert and farmland with a smaller number of more intensely developed locations. It should not be reported as the value for an individual city or neighborhood. Local analysis requires the source raster, the correct local boundary, and often additional infrastructure data.
Date matters as much as resolution. The current maps are labeled 2025, so development, cropping changes, shoreline conditions, or vegetation changes after that year are not represented. The change map uses only 1985 and 2025. A place may have changed several times between those dates or returned to a similar class, neither of which can be reconstructed from a two-date comparison alone.
With those limits in mind, the four-map set provides a strong overview of Imperial County. The county is dominated by shrubland and barren desert, contains a large and visually distinct agricultural area, includes the Salton Sea as a major water feature, and has developed and impervious surfaces concentrated in a comparatively small part of its area. The change layer adds locations where the 1985 and 2025 classifications differ without claiming a specific cause.
Frequently Asked Questions
What is the largest land cover class in Imperial County in 2025?
Shrubland is the largest class at 40.51%, followed by barren land at 32.35%. Agriculture accounts for 17.28%, water for 5.77%, and developed land for 2.99%. The map makes the contrast between the broad desert and the concentrated agricultural area easy to see.
Does the 17.28% agricultural value equal official farmland acreage?
No. It is the share of 2025 land cover cells classified as agriculture. Harvested acreage, crop types, production, and agricultural value should be checked in sources such as the Imperial County Agricultural Commissioner Crop Reports.
Does the 8.88% class difference mean all of that land physically changed?
Not necessarily. Real land change may be included, but classification methods, mixed pixels, image conditions, and date differences can also affect the result. The change map is best used to locate areas for further review with imagery and additional years of data.
Sources and reference links
Land cover and impervious classifications can be reviewed through MRLC Annual NLCD Data and the USGS Annual NLCD Land Cover Classification. County boundary and FIPS reference data are available from the U.S. Census Bureau TIGER/Line Shapefiles.
County-specific context is available from the Imperial County Agricultural Commissioner Crop Reports, the County of Imperial overview, and the Imperial County General Plan Amendments. These sources address agriculture, communities, conservation, and planning rather than replacing the satellite land cover classification.
Map File Information
The ZIP includes four original JPG maps for Imperial County: 2025 general land cover, forest and farmland, impervious surface and developed land, and 1985–2025 land cover change.
- Included Files: Use only the versions confirmed in the article and supplied images
- File Type: Use the confirmed download contents
- Intended Use: Printing, education, presentations, and map-based projects
Related Maps
- Alameda County California Land Cover Map
- Alpine County California Land Cover Map
- Amador County California Land Cover Map
Green Map creates custom-edited map images using open geographic data sources such as geoBoundaries, Natural Earth, OpenStreetMap, and government open data.
These maps are edited visual materials, not raw data files, and are provided for education, documents, presentations, and graphic reference.