Henry County sits in the fast-changing part of Georgia southeast of Atlanta, and its 2025 surface pattern is split between a large developed footprint and a nearly comparable amount of forest. Developed cover accounts for 40.65% of the county, while forest makes up 36.10%. The four maps on this page separate that broad picture into current cover, vegetation and farming, hard surfaces, and the difference between 1985 and 2025, so the county can be studied without treating every red or green cell as the same kind of place.
The maps are available here as WebP previews, and the matching four original JPG files are packaged together in one ZIP for download. Each JPG is 2480 × 1754 pixels. They work well for county profiles, classroom comparisons, reports, and presentation graphics where the goal is to show county-scale patterns rather than individual parcels. The download includes a 2025 land-cover map, a forest-and-farmland view, an impervious-surface map, and a two-date land-cover-change map.
Land cover is a description of what the ground is classified as being covered by at the observation date. It is not a zoning map, ownership map, parcel survey, or statement about where development is legally allowed. A developed cell may contain lawns and trees as well as buildings and pavement. A forest or agricultural cell is also a generalized raster classification, not a property boundary. Keeping that distinction in mind makes the four images much more useful.
Table of Contents
Start with the west-to-east contrast in the 2025 county pattern
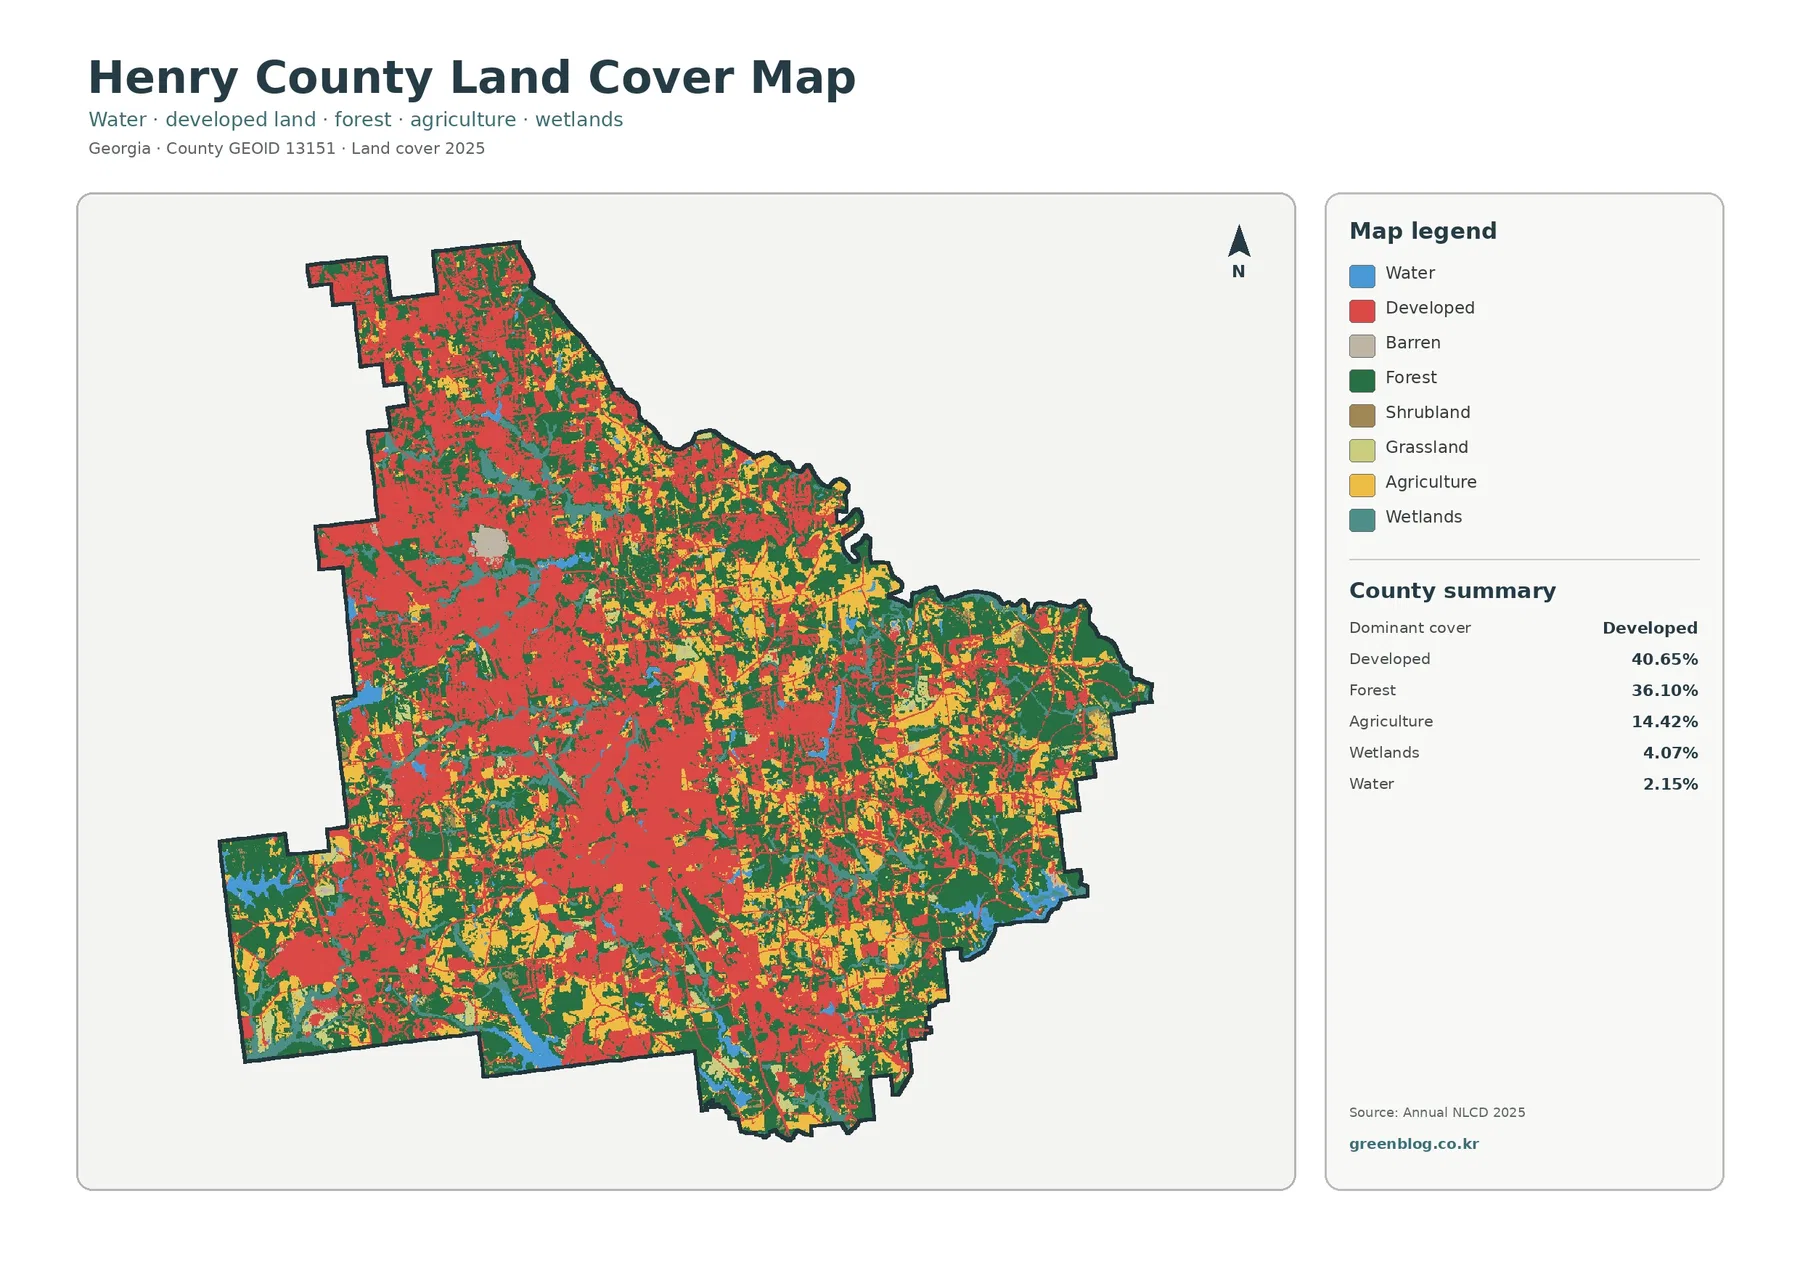
The strongest visual feature is not a single isolated town-shaped patch but a broad developed concentration across much of the western and central part of the county. Red cells also extend through the northwest projection and form a large connected area toward the south-central portion. The eastern side looks different. Forest occupies larger, more continuous blocks there, especially near the east and southeast edges, while developed cover breaks into narrower strips and smaller clusters.
Hard surfaces reveal a more concentrated development footprint
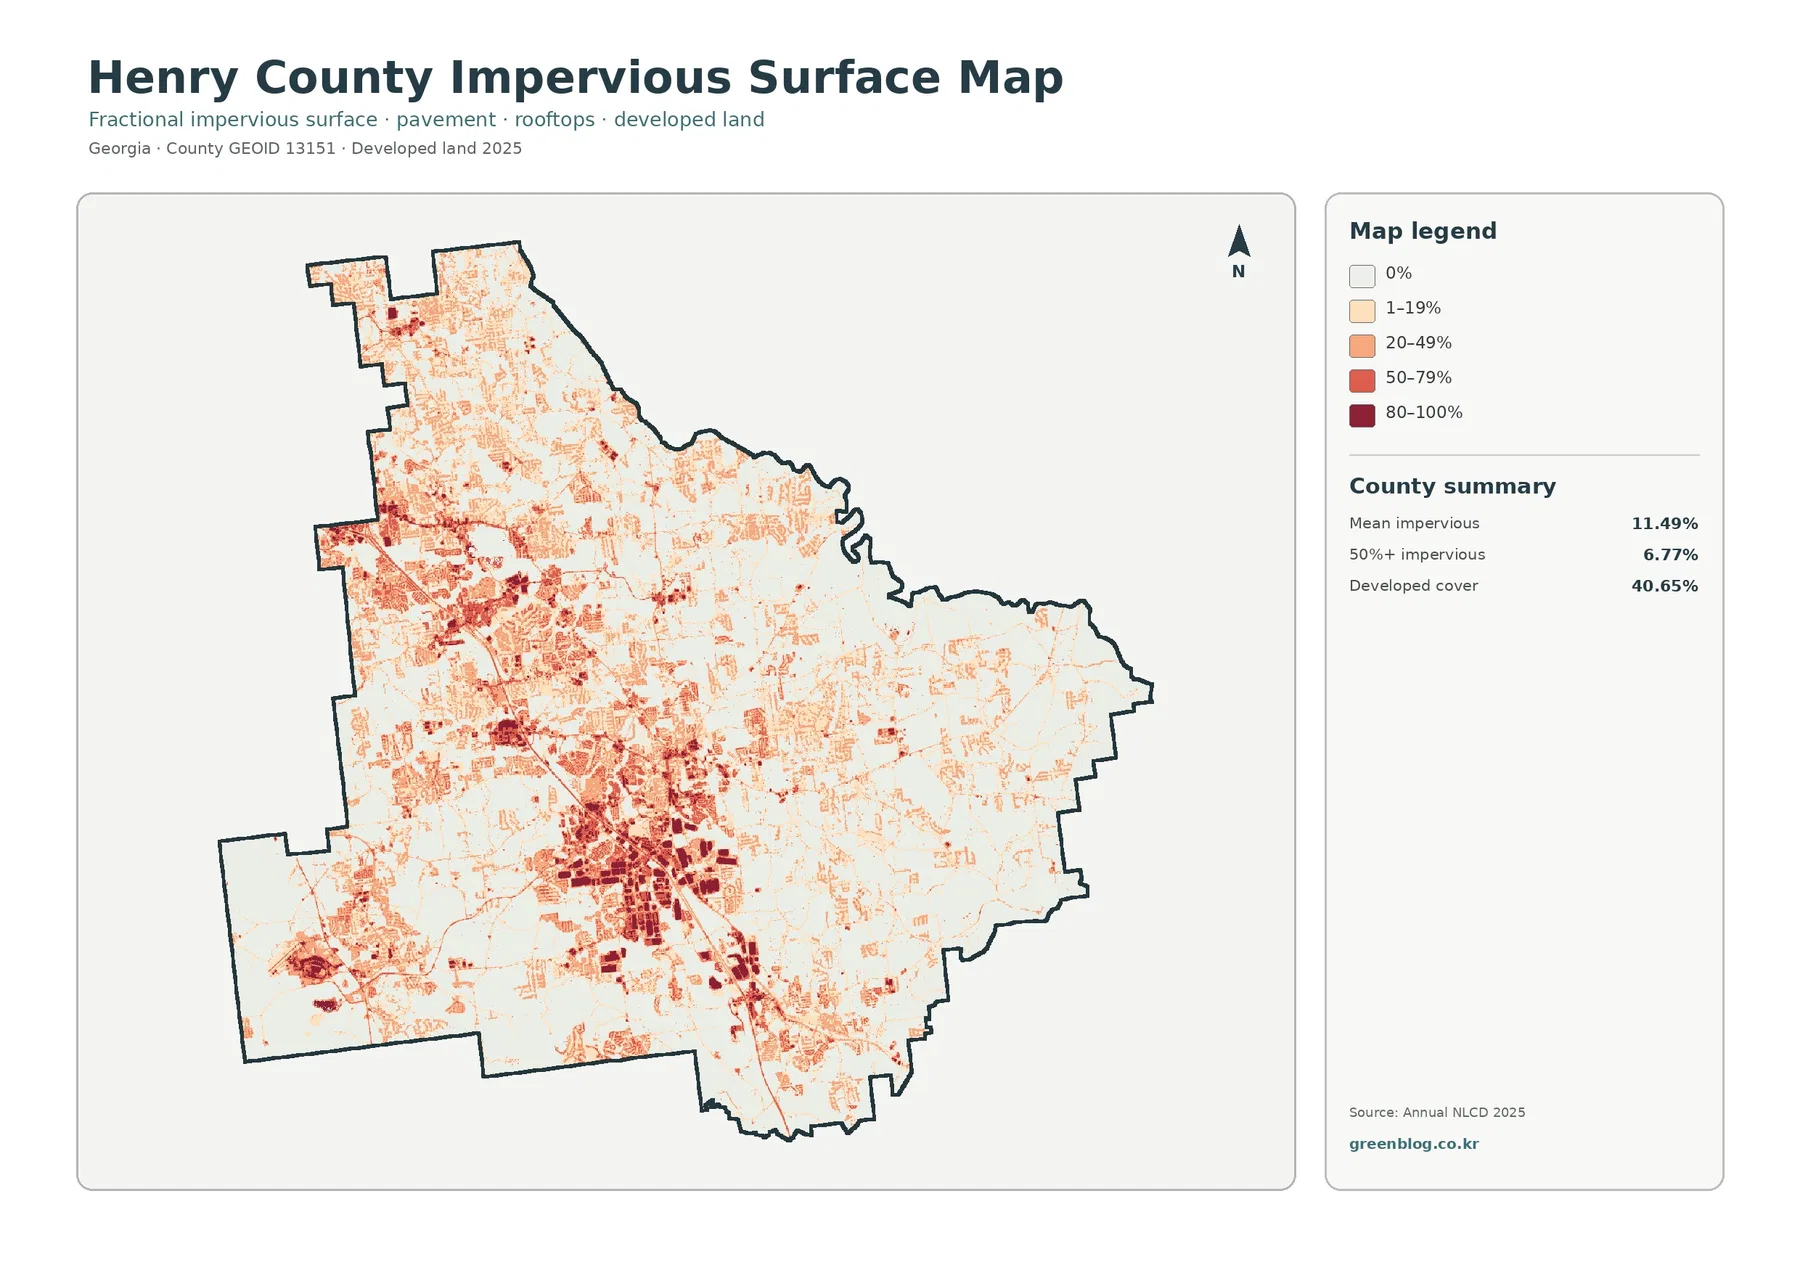
The impervious map asks a narrower question than the general land-cover image. Impervious surfaces are roofs, pavement, parking areas, and similar materials that do not readily absorb rainfall. Henry County has a mean impervious value of 11.49%, and 6.77% of the county is shown with impervious cover of 50% or more. Those figures are much lower than the 40.65% developed-cover share because developed classes can contain substantial amounts of grass, trees, soil, and other permeable ground.
Dark and medium tones cluster most strongly through the central and southern developed belt, with additional concentrations in the west and smaller high-intensity points in the northwest. The eastern part of the county is much lighter overall. This gives the map a useful second layer of detail: the general map tells where developed classes are widespread, while the impervious map shows which parts of that developed footprint contain more continuous hard surface.
The vegetation view brings forest, farms, and wet areas forward
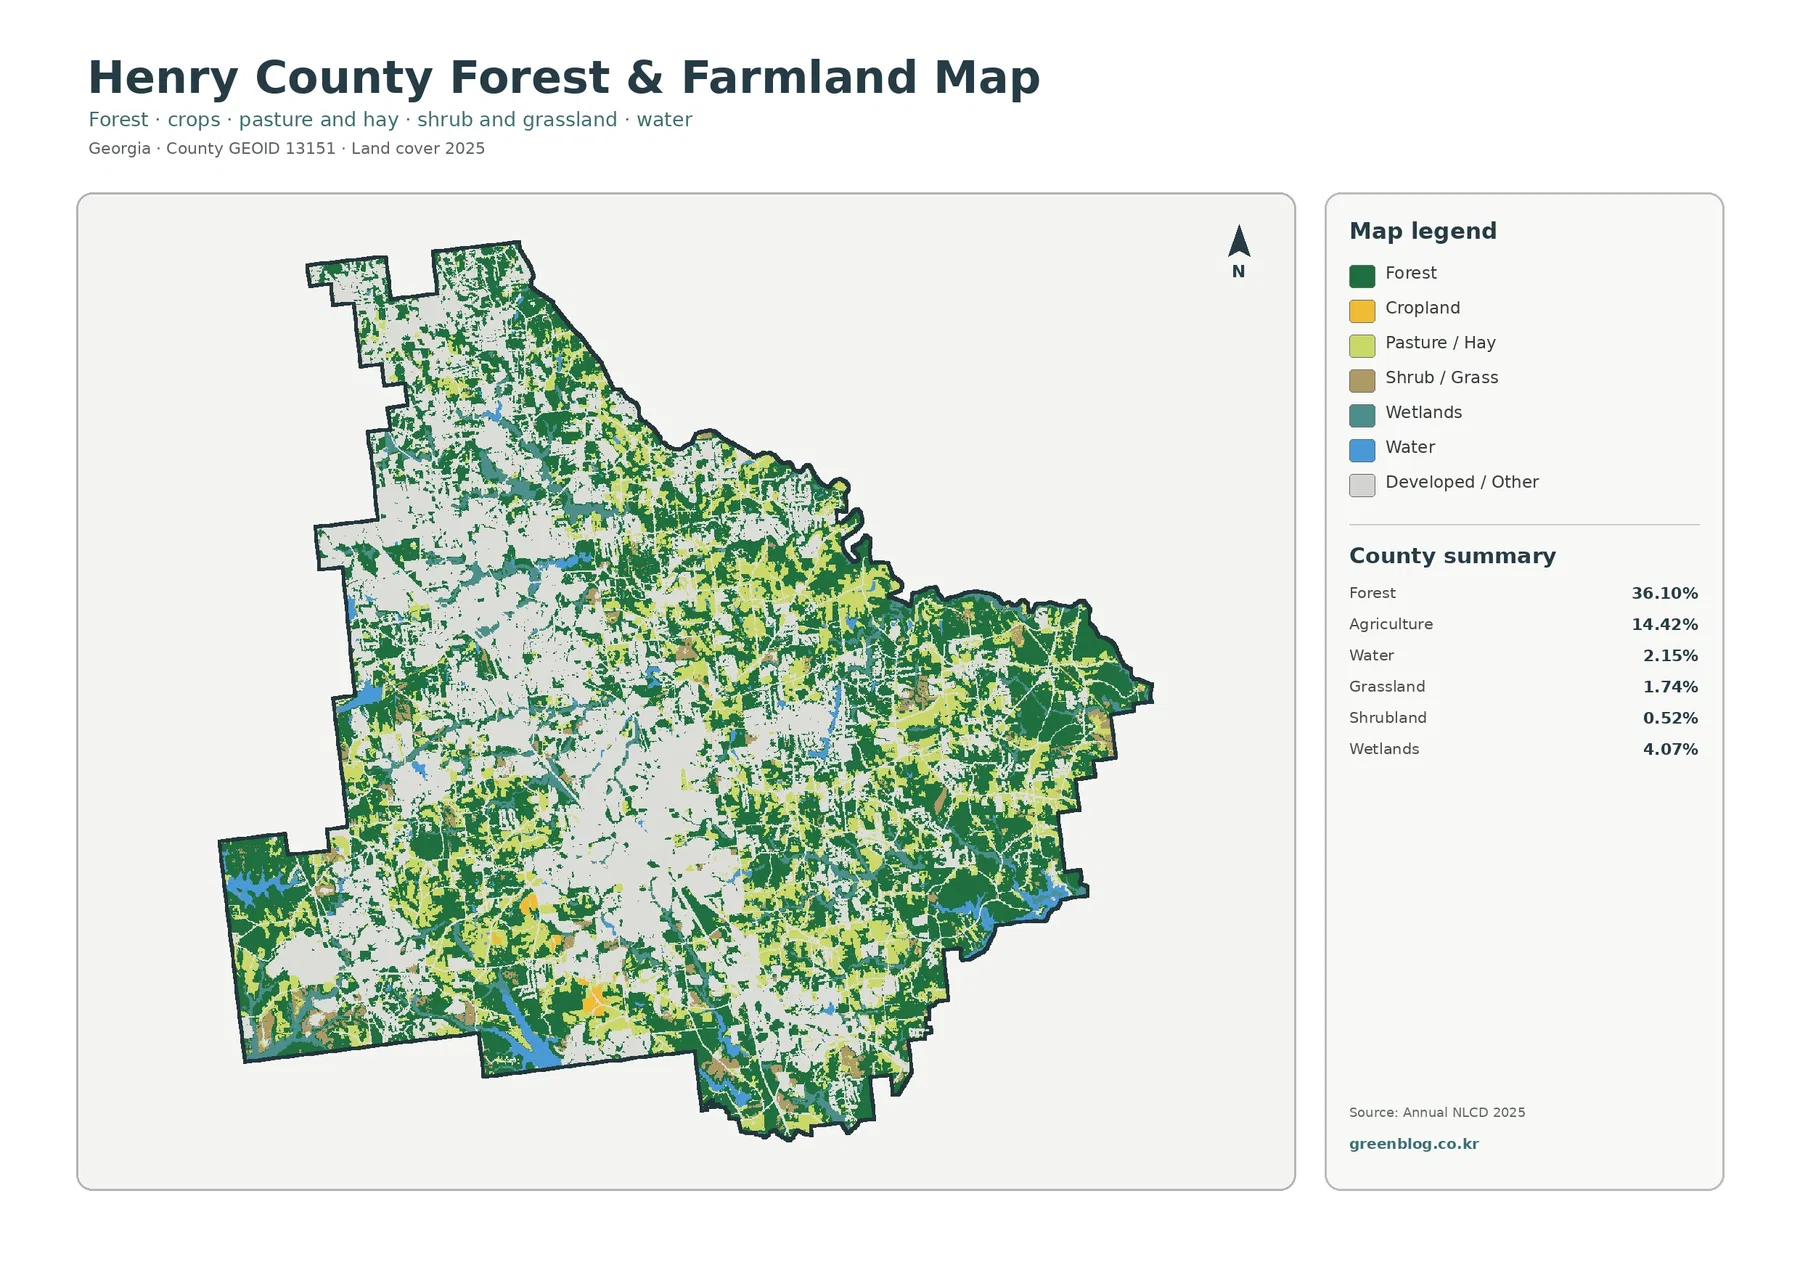
Removing the visual dominance of developed land changes the way Henry County reads. Forest becomes the main feature in the eastern half, where large green blocks remain connected along much of the east and southeast. In the western half, woodland is still present, but it is more fragmented by the pale background that represents developed or other cover. The contrast helps explain how a county with 36.10% forest can still have a larger developed percentage overall.
Agriculture is more visible here than on the all-class map. Yellow cropland and lighter pasture or hay areas appear in a dispersed pattern through the center-east, southeast, and parts of the south. Grassland accounts for 1.74% and shrubland for 0.52% in the map summary, so those classes are smaller than agriculture but help fill the transitions between fields, forest, and developed areas. The result is a mosaic rather than a simple line dividing urban and rural land.
A large 1985–2025 class difference does not mean the same thing as 42.96% new development
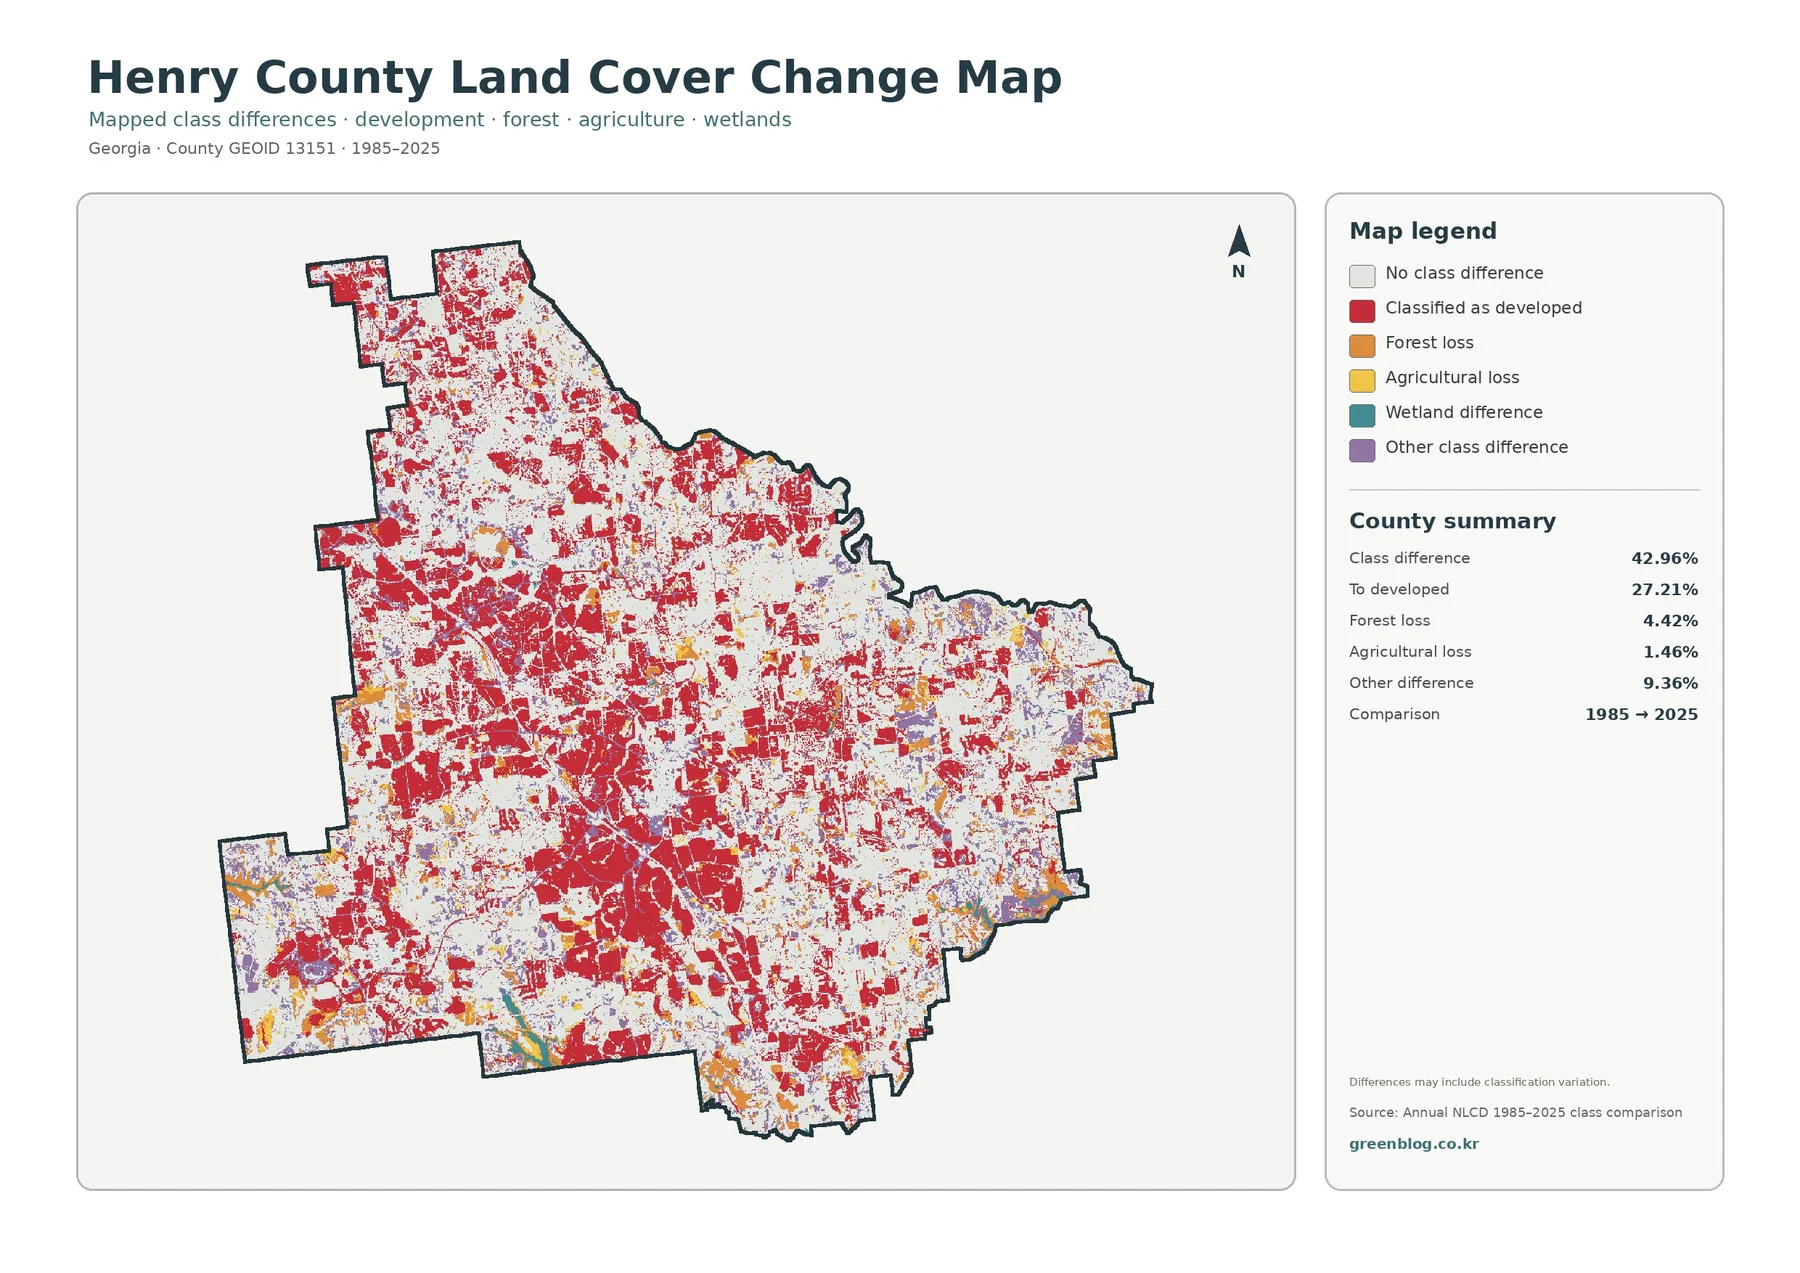
The two-date map reports class differences across 42.96% of Henry County. The largest listed component is change to a developed classification at 27.21%. Forest loss is 4.42%, agricultural loss is 1.46%, and other difference is 9.36%. Wetland difference is shown as its own legend category, but the summary does not provide a separate percentage for it, so it should not be calculated from the remaining total and presented as an official map statistic.
Red change cells are widespread across the west, center, northwest, and south, broadly overlapping the parts of the county that now contain the strongest developed cover. The east contains more areas with no class difference, although red, orange, yellow, and other-change colors remain mixed through it. This is an endpoint comparison, so the pattern shows where the 1985 and 2025 labels differ rather than a complete history of every change that occurred between those years.
A cell shown as “classified as developed” does not reveal the construction date, project type, or cause. It means that a location assigned to another class at the 1985 endpoint is assigned to a developed class at the 2025 endpoint. Establishing whether a particular change came from housing, commercial construction, a road, site clearing, or another process requires intermediate imagery and local records. The map supports screening and comparison, not causal claims.
Thirty-meter raster cells set the right scale for interpretation
USGS Annual NLCD Collection 1.2 includes 2025 and is processed at 30-meter spatial resolution. In practical terms, the county is represented by a grid of square raster cells, and each cell receives a predominant classification. A single cell can contain a house, yard, tree line, small road, and patch of bare ground, yet the final product still needs one dominant land-cover label. That generalization is appropriate for regional mapping but too coarse for many parcel-level questions.
The 2025 maps describe the supplied observation year, not conditions after it. Later construction, vegetation recovery, timber activity, agricultural changes, flooding, or road work may be absent. The 1985–2025 image is likewise a comparison of two endpoints. When a current decision depends on a specific site, use newer imagery and official local data rather than assuming the map remains exact at the present day.
What the four-map JPG download contains
Frequently Asked Questions
What is the dominant land-cover class in Henry County in 2025?
Developed land is the largest class in the supplied 2025 summary at 40.65%, followed closely by forest at 36.10%. Agriculture accounts for 14.42%, wetlands 4.07%, and water 2.15%. The map adds an important spatial detail: developed cover is strongest in the west and center, while larger forest blocks remain toward the east and southeast.
Why is developed cover 40.65% if mean impervious cover is only 11.49%?
The two measures describe different things. A developed land-cover class can include lawns, trees, exposed soil, and other permeable surfaces around buildings and roads. Impervious cover focuses on hard surfaces such as rooftops, pavement, and parking areas. A county can therefore have a broad developed footprint without having that same percentage sealed by hard materials.
Does the 42.96% 1985–2025 class difference mean 42.96% of Henry County became developed?
No. The total includes several types of endpoint class difference. The map lists 27.21% as classified to developed, 4.42% forest loss, 1.46% agricultural loss, and 9.36% other difference, with wetland difference also represented in the legend. The comparison does not establish an exact date or cause for each changed cell, so intermediate imagery and local records are needed for a detailed history.
Sources and Reference Data
- MRLC Annual NLCD Data – official access point for Annual NLCD data and related products
- USGS Annual NLCD Collection 1.2 Land Cover – official description of the 2025-inclusive, 30-meter Annual NLCD land-cover product
- Henry County Planning & Zoning – county information on comprehensive land-use planning and development regulations
- Henry County Stormwater – county floodplain, stormwater education, and technical-information resources
- UGA Extension – Henry County Agriculture & Natural Resources – local agriculture, soil, plant, water, and natural-resource programs
Map File Information
The ZIP contains four original JPG maps for comparing Henry County’s 2025 land cover, forest and farmland, hard-surface concentration, and 1985–2025 class differences.
- Included Files: Four original JPG land-cover maps
- File Type: JPG files in one ZIP archive
- Intended Use: Printing, education, presentations, and map-based projects
Related Maps
- Appling County Georgia Land Cover Map
- Atkinson County Georgia Land Cover Map
- Bacon County Georgia Land Cover Map
Green Map creates custom-edited map images using open geographic data sources such as geoBoundaries, Natural Earth, OpenStreetMap, and government open data. These maps are edited visual materials, not raw data files, and are provided for education, documents, presentations, and graphic reference.