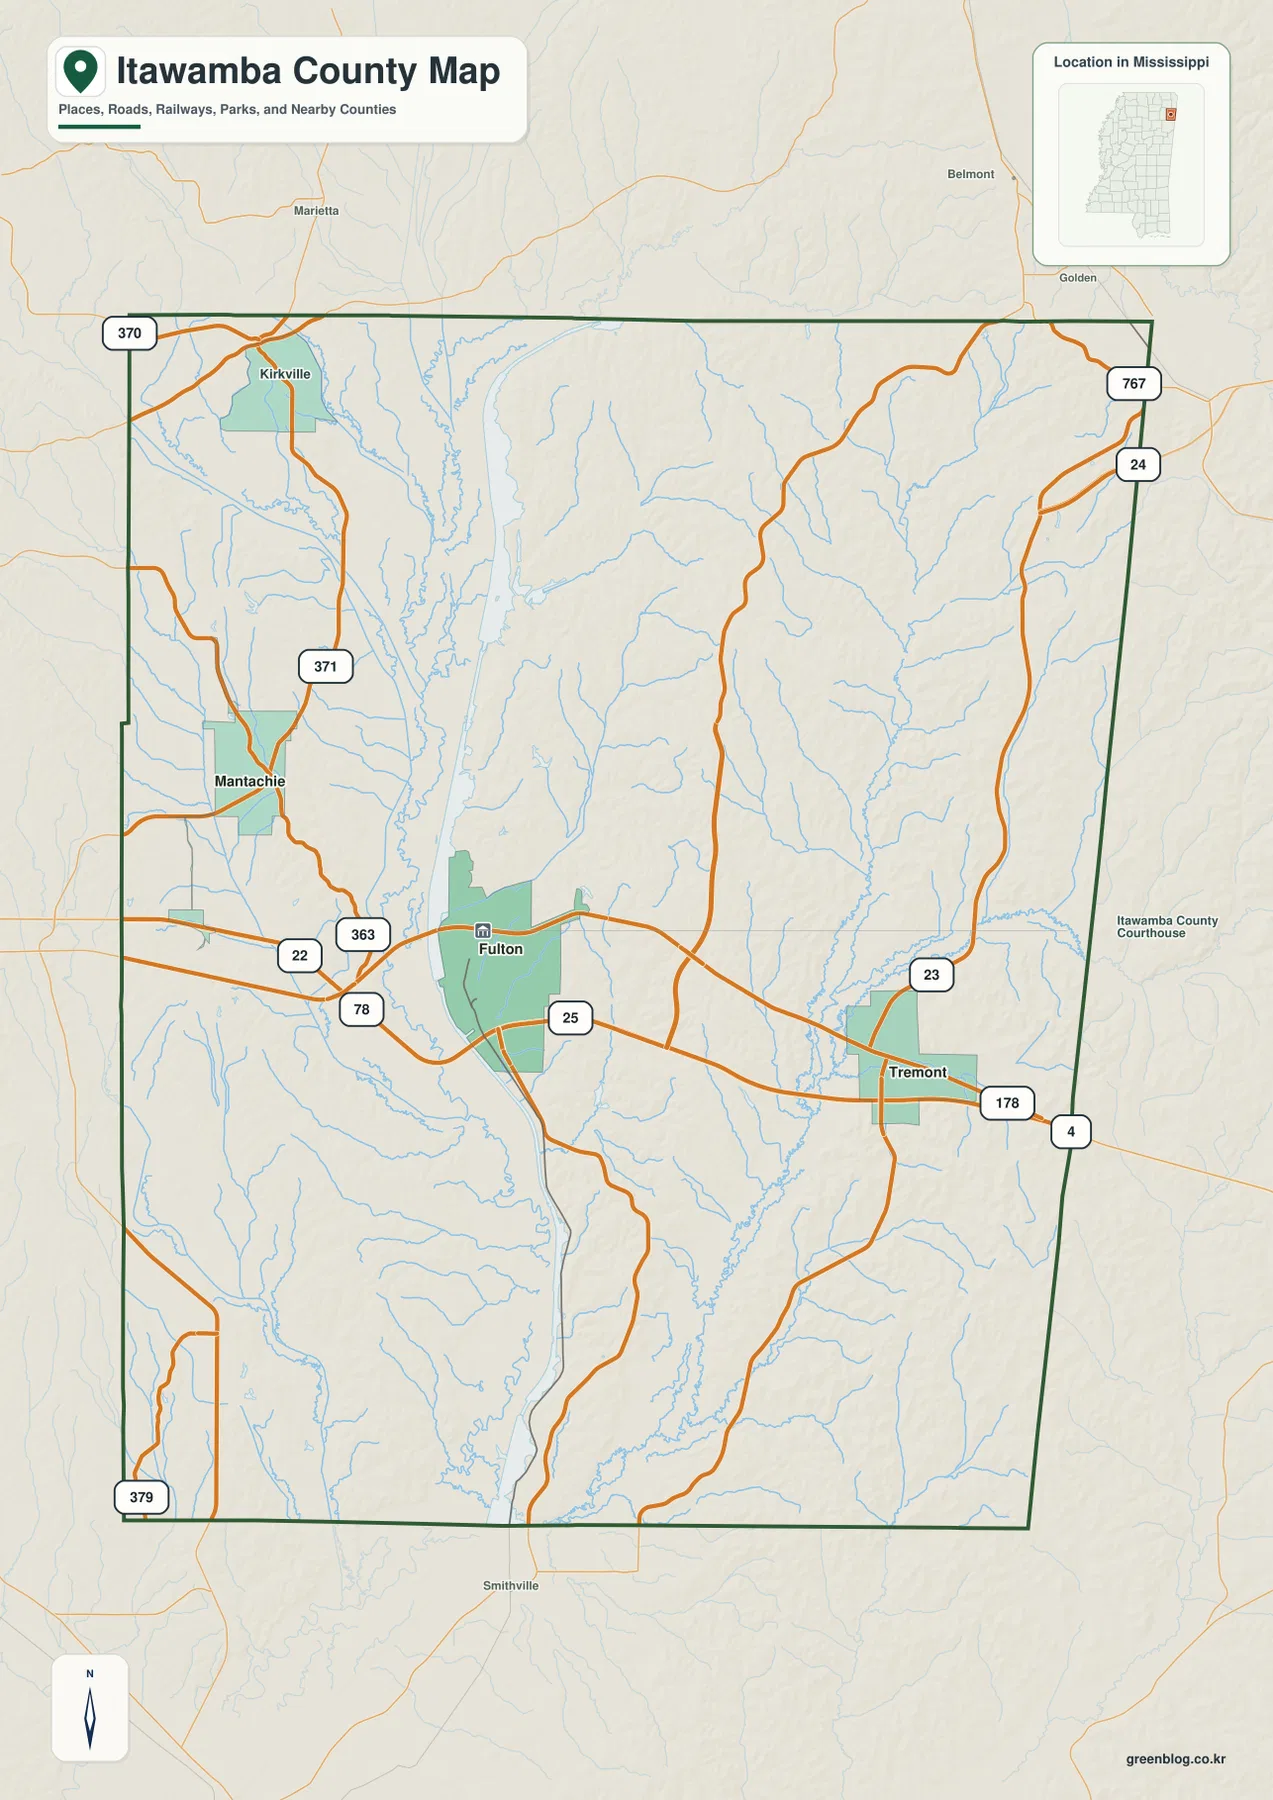
Itawamba County in northeastern Mississippi is organized around Fulton, with Mantachie to the northwest and Tremont to the east. A broad Tombigbee River and Tennessee-Tombigbee Waterway corridor runs north-south through the county, while I-22/US 78 and MS 25 give Fulton a clear road connection across that water-and-valley setting. These maps are most useful when the roads, settlement pattern, waterways, and relief are read together rather than as separate facts.
This page explains the county boundary and main roads, the relative position of the leading towns, named rivers and lakes, and an elevation range of about 68 to 202 meters. The WebP images are page-friendly previews, and the download box below provides the matching high-resolution JPG map files in one archive. The emphasis is on what a visitor can actually see in the supplied maps, including the contrast between the low central corridor and the hillier east side.
Table of Contents
Fulton at the crossing of east-west and north-south routes
Fulton sits slightly west of the county’s center on the reference map. US 78 crosses the county near the city, while MS 25 runs through the same area and continues north and south. Mantachie appears to the northwest, Tremont lies farther east, and Kirkville provides another northern reference point. Together these labels make it easier to judge direction before looking at smaller local roads.
The settlement pattern is not a continuous urban strip. Built-up areas appear as compact patches separated by rural roads, streams, and open land. Around Fulton the road network is denser, but toward the northern and southern ends of the county the map is dominated by smaller routes and drainage lines. That difference makes the county map especially useful for regional orientation rather than address-level navigation.
Route shields including MS 23, MS 178, MS 4, MS 371, MS 363, and MS 22 add local context around the main I-22/US 78 and MS 25 framework. They help connect Tremont, Mantachie, and the surrounding rural areas to the larger road system. The map does not attempt to label every small road, so a current navigation service is still the better source for turn-by-turn driving.
Fulton, Mantachie, and Tremont as three practical reference points
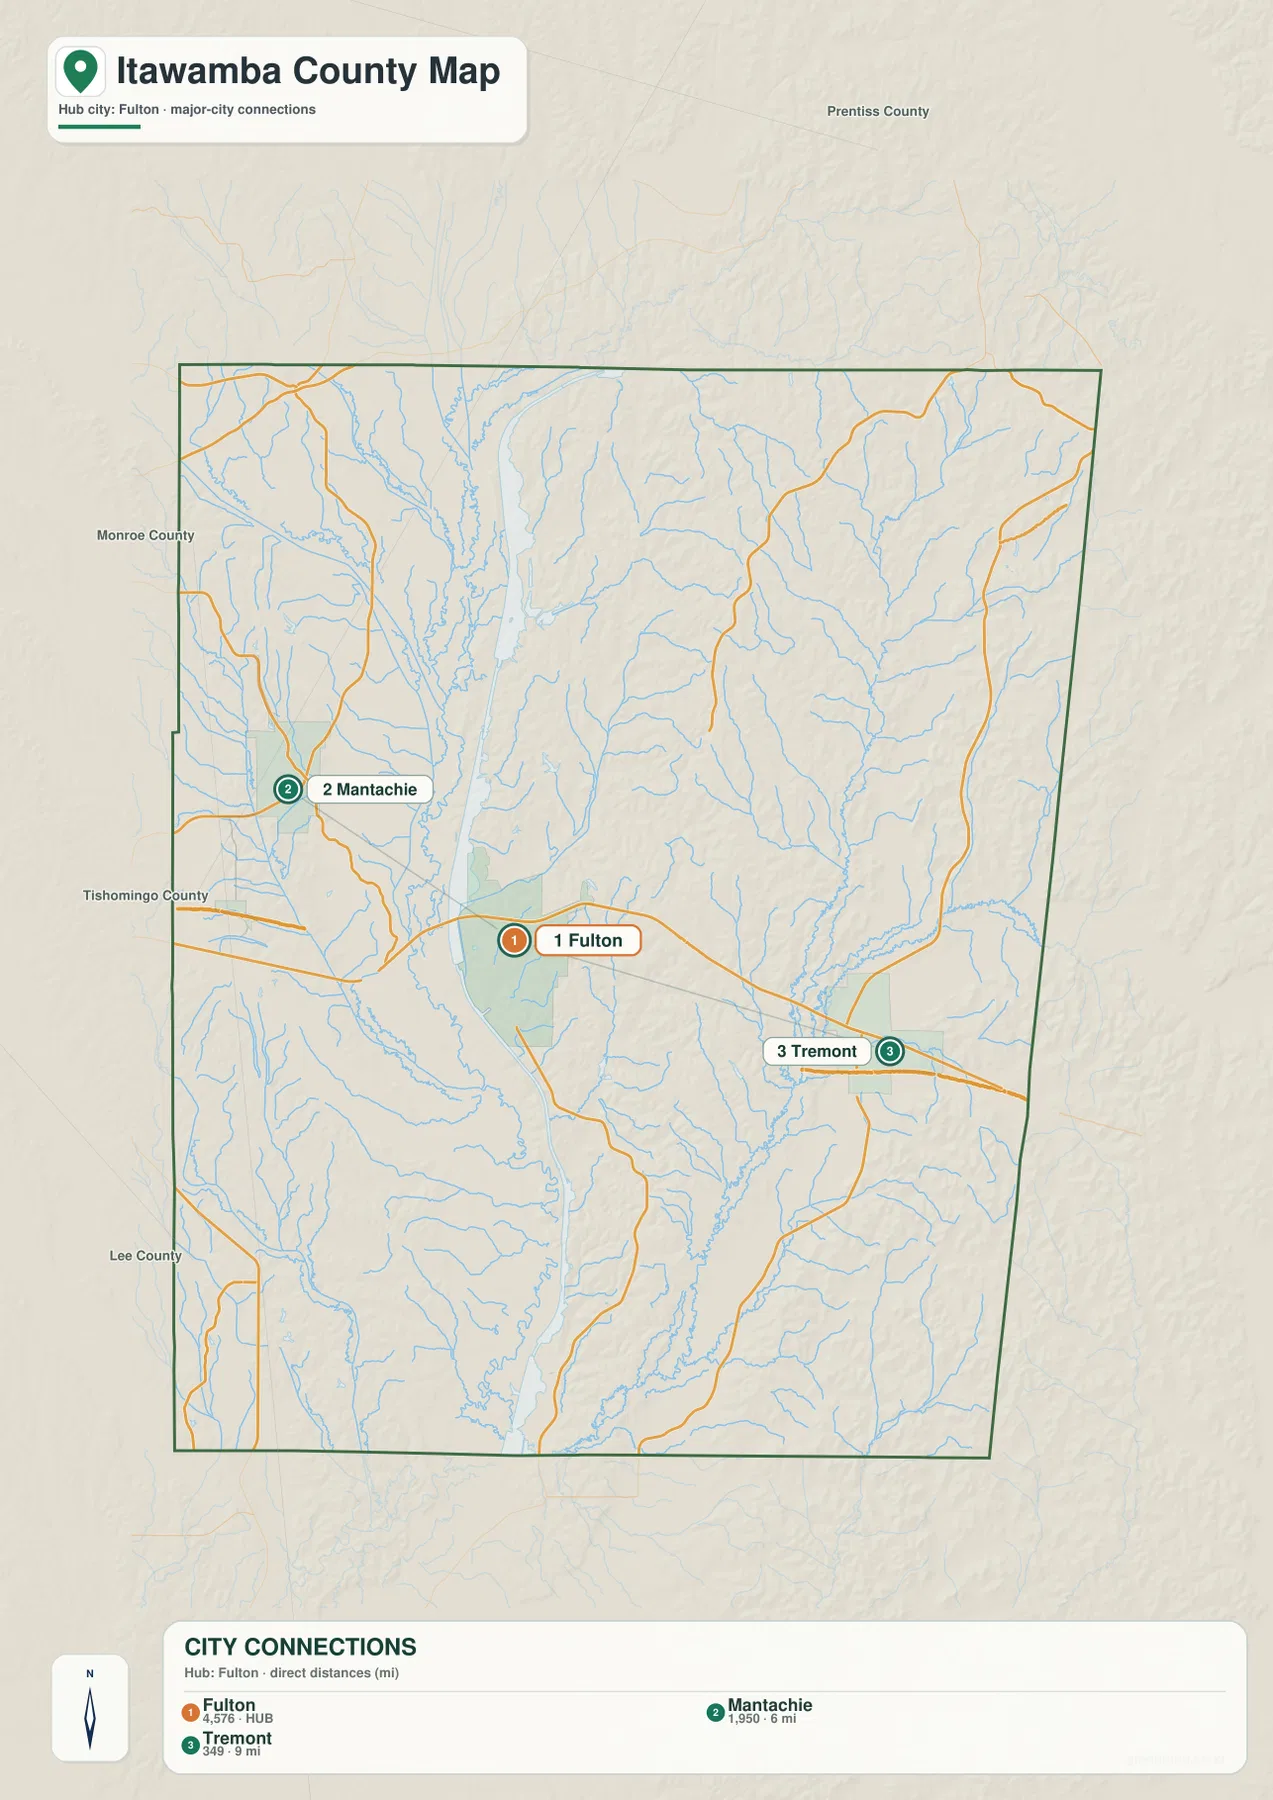
The city-connections map uses Fulton as the hub and compares it with Mantachie and Tremont. Its labels show Fulton at 4,576, Mantachie at 1,950, and Tremont at 349. The most useful part of the graphic is not simply the ranking; it is the way the three places establish a west-to-east frame across the county.
Mantachie is marked 6 miles from Fulton and Tremont 9 miles from Fulton. Those figures are direct straight-line distances, not road mileage and not estimated driving time. A vehicle route can be longer because it must follow the available roads, bridges, and junctions. For travel planning, the city map should therefore be used as an orientation aid rather than a route calculator.
When the city map is compared with the county map, the different settings become clearer. Mantachie lies on the west side of the major water corridor, while Tremont is closer to the hillier eastern portion of the county. Fulton connects the two sides through the main highway network, which is why it works well as the hub for comparing local directions.
Tombigbee River, lock pools, and the county’s central low corridor
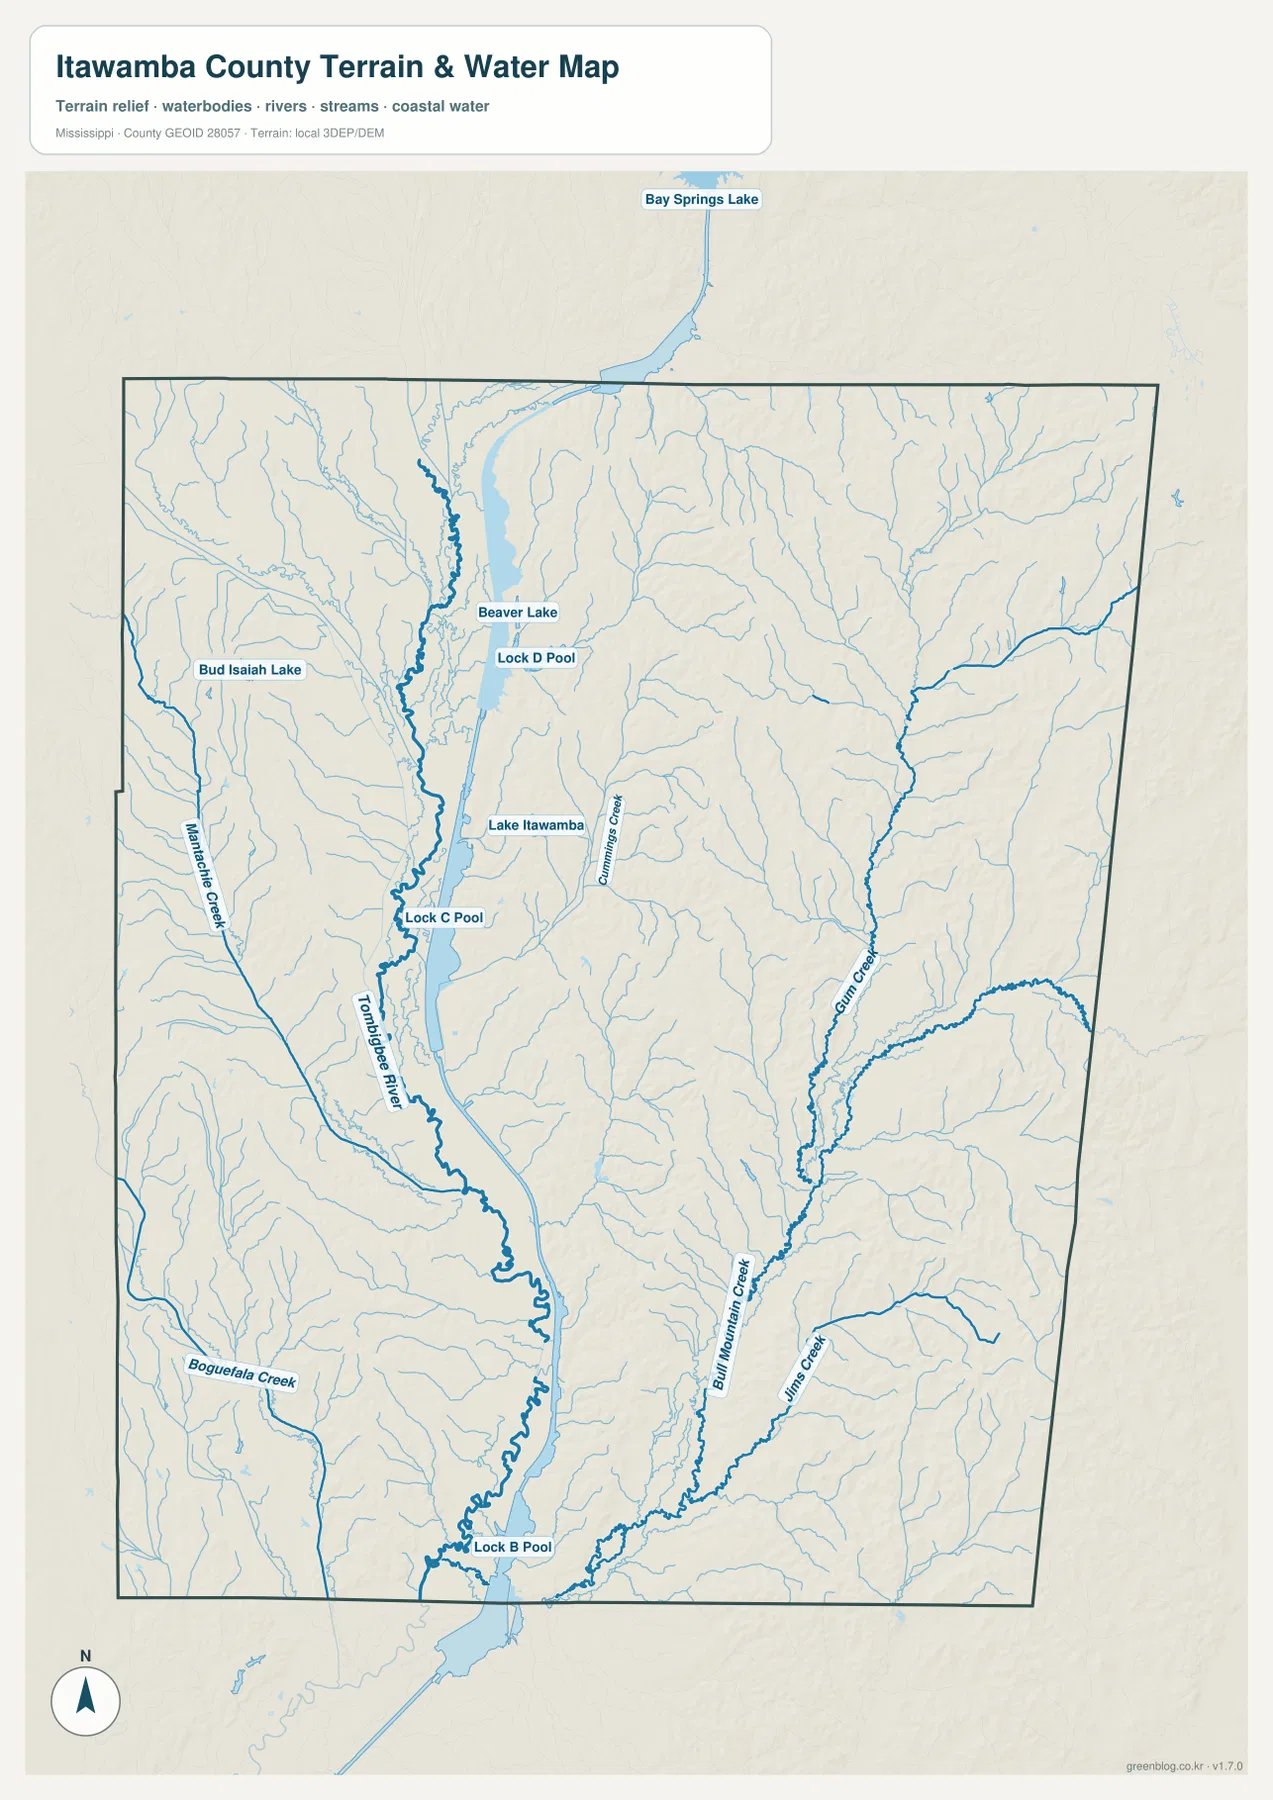
The terrain-and-water map is dominated by the broad water corridor running through the central-western part of Itawamba County. Lock D Pool, Lock C Pool, and Lock B Pool are labeled in sequence, with Beaver Lake and Lake Itawamba close to the same system. Bay Springs Lake appears beyond the northern edge, showing that the mapped water corridor continues beyond the county boundary.
Smaller named waterways branch toward the main river system from both sides. Mantachie Creek and Boguefala Creek appear to the west, while Gum Creek, Bull Mountain Creek, Willis Creek, and other tributaries occupy the eastern side. Bud Isaiah Lake adds another small-waterbody reference. The pattern is useful because it shows how many narrow valleys connect to the larger Tombigbee corridor.
This is a reference map of water features and terrain, not a flood-zone, navigation, parcel, or boating-access map. It does not provide channel depth, legal access, inundation probability, or survey boundaries. Anyone planning river travel, flood preparation, or access to a specific shoreline should use the appropriate current agency source in addition to this county overview.
A 68–202 m relief range from the waterway lowlands to eastern hills
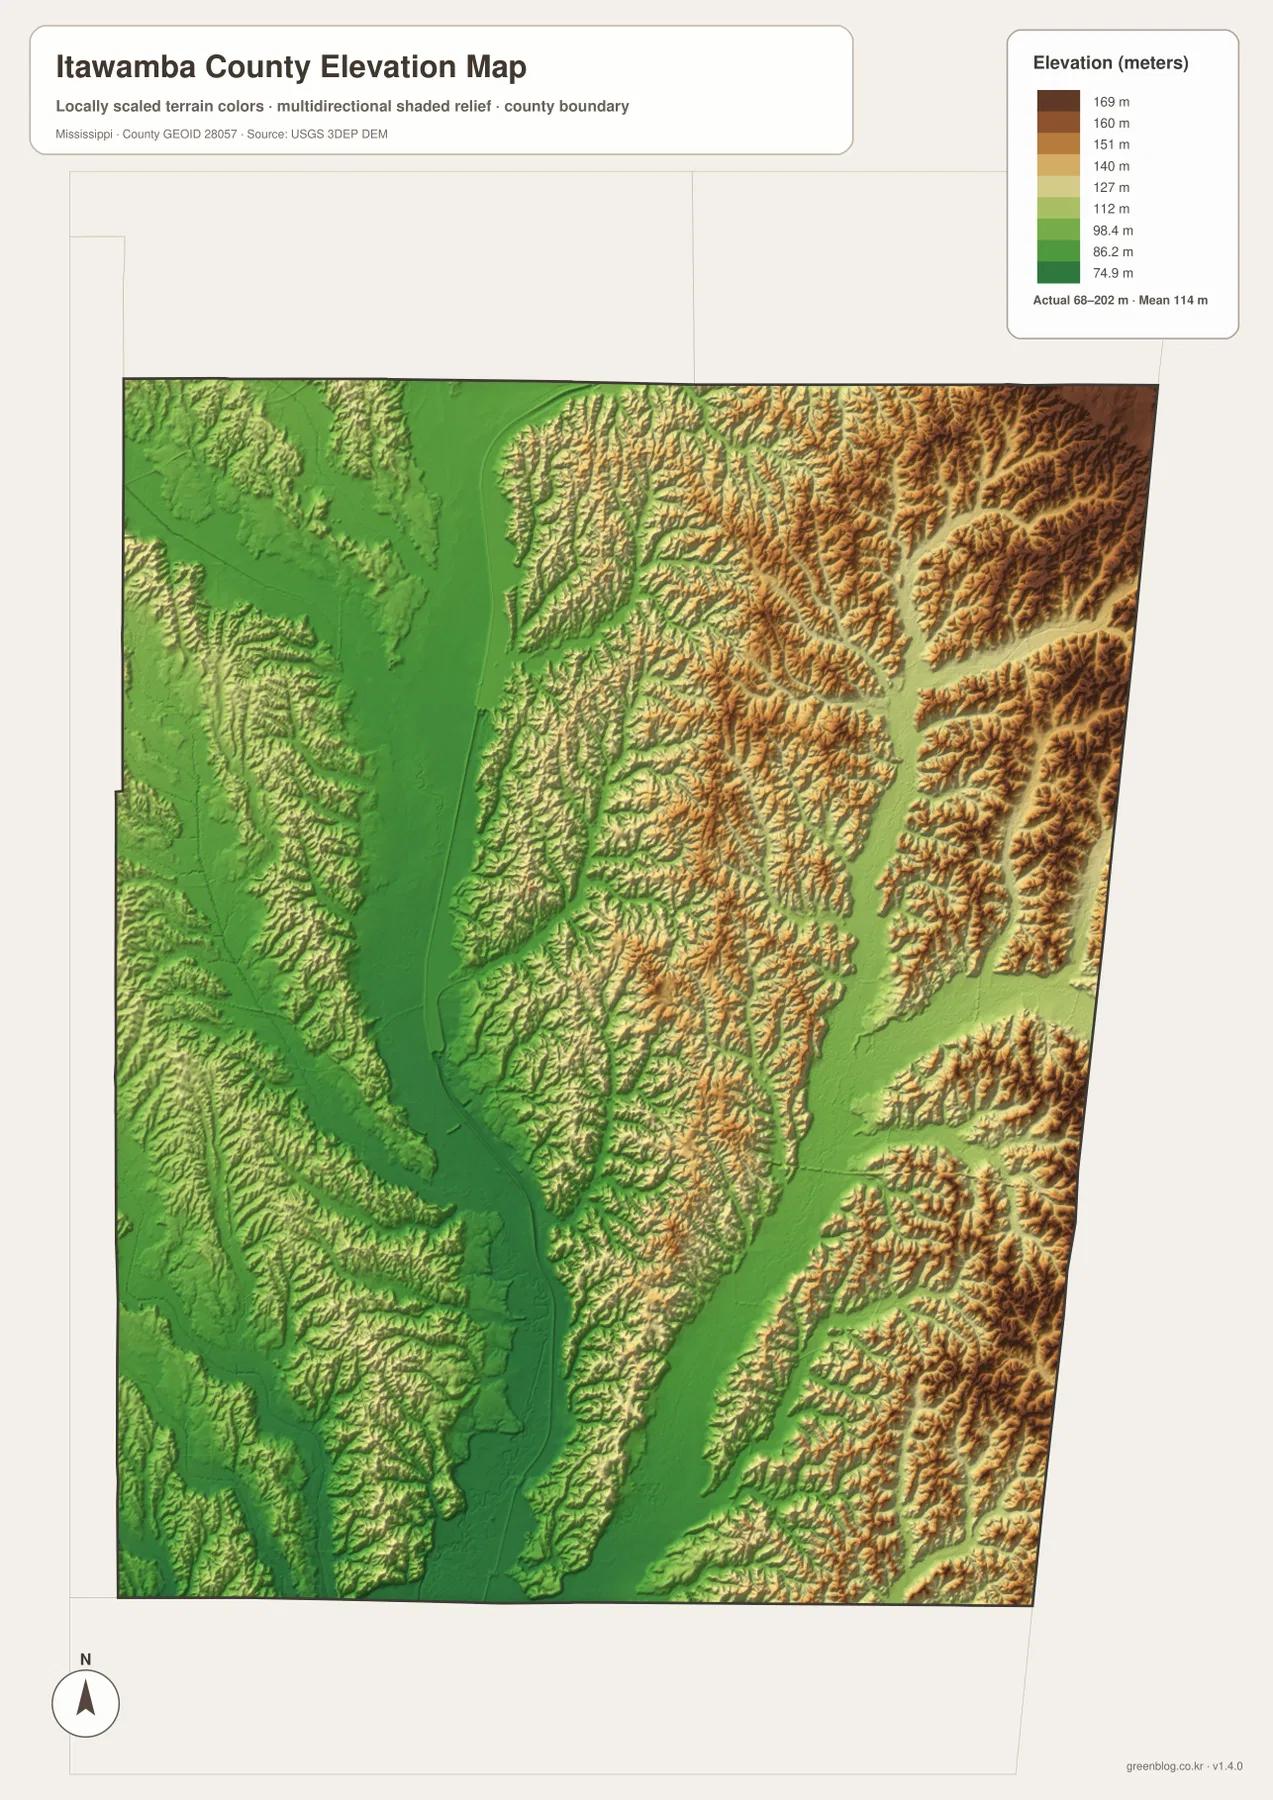
The elevation map reports an actual range of about 68 to 202 meters and a mean of 114 meters. The broad green band through the center follows the lower Tombigbee and waterway corridor, while yellow, tan, and brown ridges become much more common toward the east. The northeast and eastern edge show especially dense ridge-and-valley texture compared with the smoother central lowlands.
The west side is not completely flat. Low valleys are broken by smaller ridges around the Mantachie side and toward the southwest, but the lowest colors remain closely associated with the main river corridor. Reading the map this way is more informative than treating the mean elevation as if it described every point in the county.
The color ramp is scaled to show local differences within this county. A similar color on a different county map should not be assumed to represent the same elevation unless its legend says so. The shaded surface is also intended for regional terrain context, not survey-grade measurements at a house lot, bridge, road cut, or construction site.
Population and area numbers in geographic context
The supplied county material lists a 2020 census population of 23,863 and a July 2025 estimate of 24,152. Those figures come from different reference dates and should not be treated as identical measurements, but they provide a useful sense of the county’s overall scale. The city map also makes clear that population is not spread evenly: Fulton is the largest labeled center, while Mantachie and Tremont are much smaller.
The 2025 Gazetteer figures in the source material list 532.795 square miles of land and 7.655 square miles of water. Using the 2020 population with that land-area figure gives roughly 44.8 residents per square mile. That average does not mean the same density exists around Fulton, along the waterway, and in the hillier rural portions of the county.
The mapped water corridor is visually important even though the county’s reported water area is much smaller than its land area. Area statistics and geographic influence are different things. For orientation, the waterway, main roads, and settlement locations are best treated as complementary reference layers rather than ranked only by their share of total area.
Choosing the right map for a specific task
For a first look at Itawamba County, start with the county reference map because it places Fulton, Mantachie, Tremont, roads, streams, and the boundary in one frame. Use the city-connections map when the main question is relative town position and straight-line spacing. The terrain-and-water map is better for river, creek, pool, and lake names, while the elevation map is the clearest choice for comparing the low corridor with the eastern hills.
A single image is often easier to read in a presentation or worksheet than a crowded combination of every feature. For example, a road discussion can use the county map and add the city map only when town spacing matters. A waterway discussion can pair the terrain-and-water map with the elevation image to show why the main low corridor stands out.
For printing or close inspection, use the original JPG files rather than screenshots of the page previews. The WebP images are reduced for faster page loading, while the archive keeps the matching county, city-connections, water, and elevation maps at the higher-resolution source size supplied by the manager.
Frequently Asked Questions
Are the 6-mile and 9-mile city distances driving distances?
No. The city-connections map shows straight-line distances from Fulton to Mantachie and Tremont. Actual road mileage can be longer because travel must follow the available roads, bridges, and junctions.
Can the lock-pool map be used for navigation or flood decisions?
No. It is designed to show the location of the Tombigbee corridor, lock pools, lakes, and named creeks at county scale. It does not provide channel depth, legal boating access, flood probability, or navigation instructions.
What is the clearest terrain difference on the elevation map?
The broad central corridor is lower, while the east and northeast contain denser, higher ridges. The legend reports about 68 to 202 meters with a mean of 114 meters, and the map is best used for county-scale relief comparison rather than precise site elevation.
Sources and reference material
- U.S. Census Bureau QuickFacts for Itawamba County
- U.S. Census Bureau Gazetteer Files
- Mississippi Department of Transportation official highway map
- Tennessee-Tombigbee Waterway Development Authority
- USGS National Hydrography
- USGS 3D Elevation Program
Population and area figures use different reference dates, so the date attached to each value matters. For navigation, flood response, boating access, engineering, or survey work, use the latest specialized source from the responsible agency rather than relying on a county-scale reference image.
Map File Information
The archive contains the high-resolution JPG originals that match the county, city-connections, water, and elevation previews on this page.
- Included Files: 4 high-resolution A3 JPG map files shown in this article
- File Type: JPG files in a ZIP archive
- Intended Use: Printing, education, presentations, and map-based projects
Related Maps
Green Map creates custom-edited map images using open geographic data sources such as geoBoundaries, Natural Earth, OpenStreetMap, and government open data. These maps are edited visual materials, not raw data files, and are provided for education, documents, presentations, and graphic reference.