Alcona County lies on the Lake Huron side of Michigan’s Lower Peninsula, where a long Great Lakes shoreline meets a broad interior of lakes, streams, low hills, and widely spaced roads. The county map is easy to orient from the east: US-23 follows the coast near Harrisville, while Lincoln sits farther inland and routes such as M-72, M-65, M-30, and M-41 connect different parts of the county.
This page includes four downloadable map views of the same county: a general county map with settlements and roads, a simplified major-city distribution map, a terrain-and-water map, and an elevation map. The high-resolution JPG versions are packaged in a ZIP for printing, classroom use, presentations, or closer inspection. These maps are designed for geographic reference rather than live traffic, legal parcel work, flood determinations, or engineering measurements.
The strongest contrast across Alcona County is between the Lake Huron side and the higher inland terrain to the west. Hubbard Lake occupies a large part of the north, while the Pine River system branches across the south-central portion of the county. Looking at the four views together makes it easier to see how roads, settlements, waterways, and elevation fit into one landscape without forcing all of that information into a single crowded image.
Table of Contents
Lake Huron, US-23, and the inland road network
The general county map uses the Lake Huron shoreline as the clearest eastern reference. The county boundary follows the coast rather than forming a simple straight edge, and US-23 runs north-south just inland from the water for much of the eastern side. Harrisville is marked close to this corridor, making it a useful point for explaining where the county meets the Great Lakes coast.
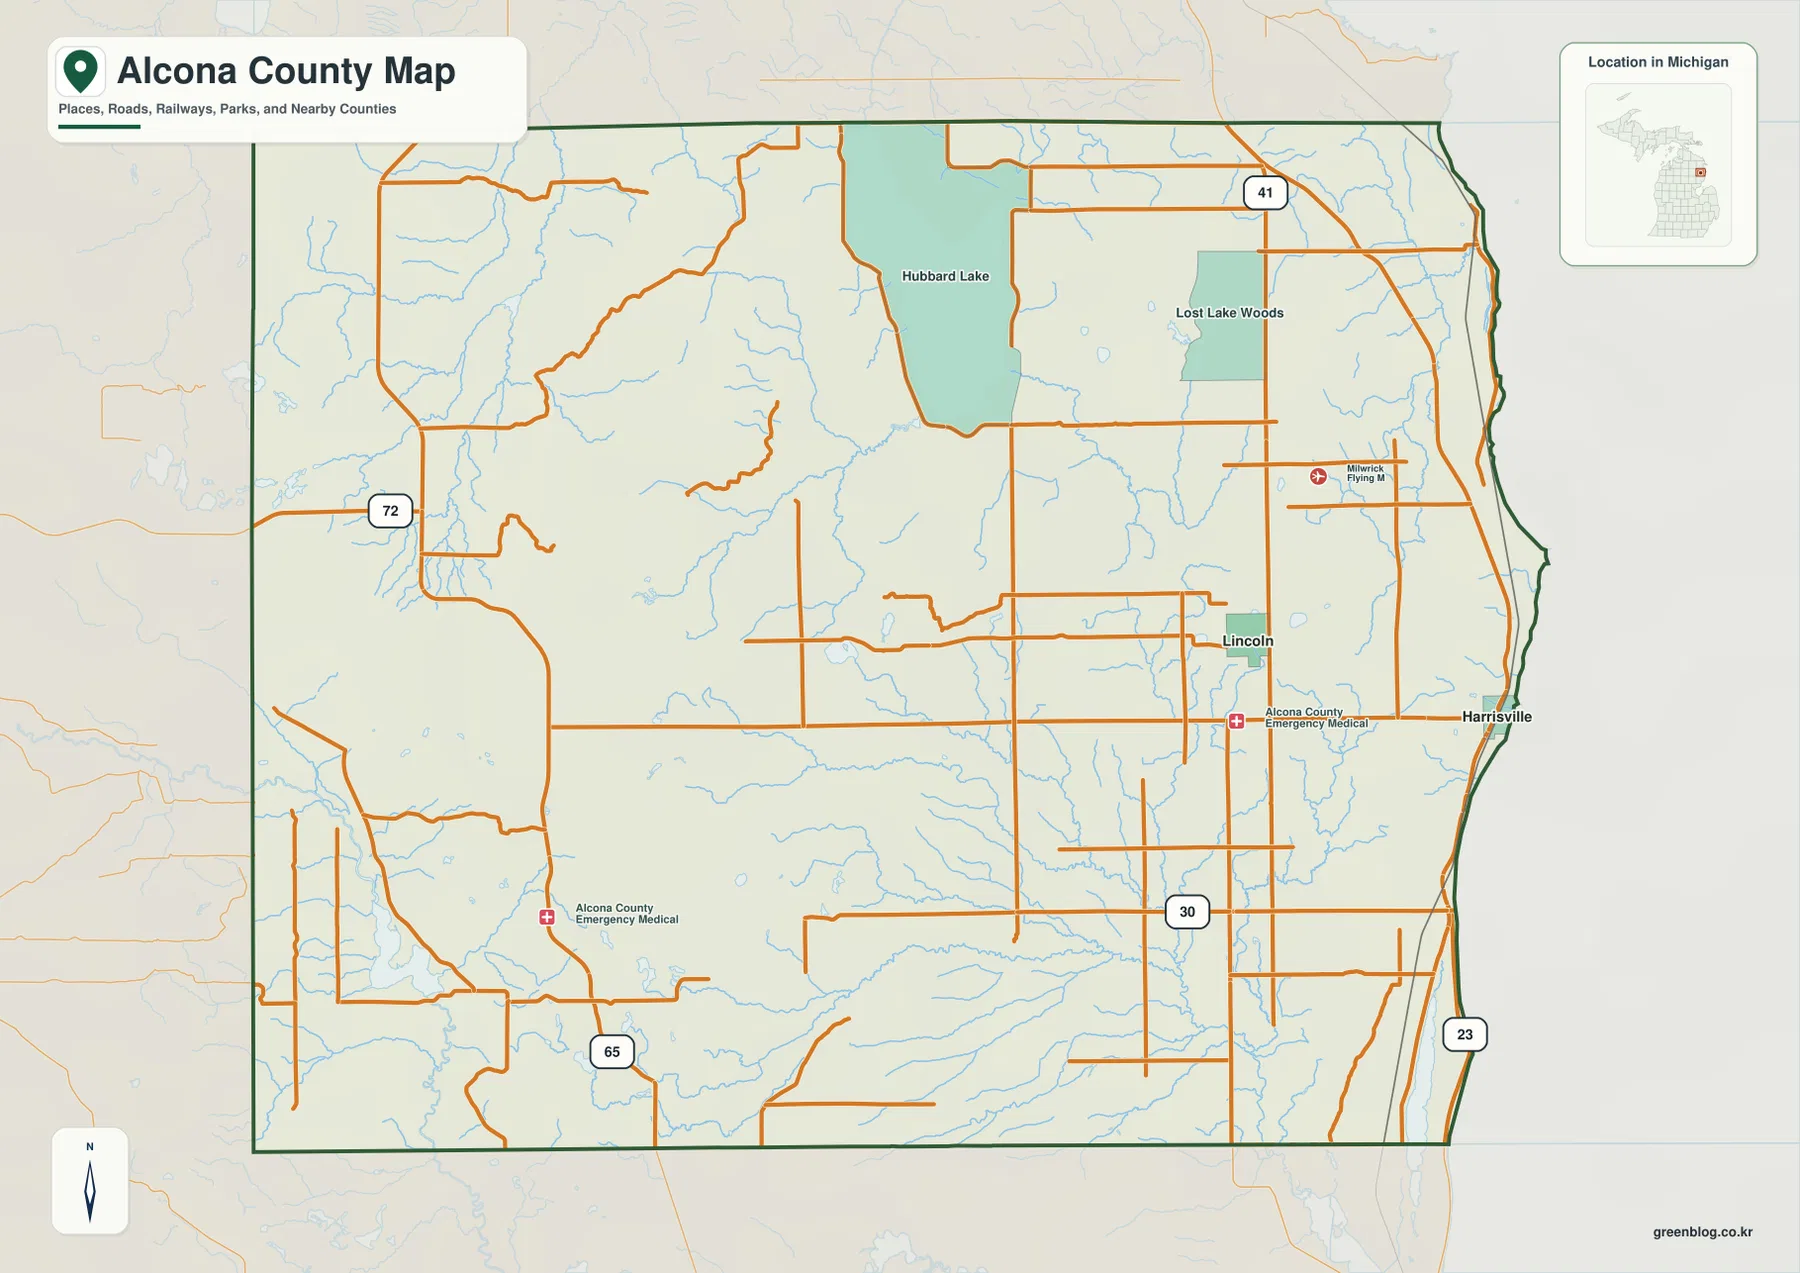
Moving west from Harrisville, the map reaches Lincoln and a denser set of local roads before opening into larger interior spaces. M-72 crosses from the western side toward the coast, while M-65 provides a north-south reference in the southwest. M-30 appears in the southern interior, and M-41 is visible farther northeast. These roads do not form one tight urban grid; instead, they connect small settlement areas across a county with substantial stretches of forested and watery terrain between them.
Hubbard Lake dominates the northern interior visually. Roads curve around the lake and connect outward toward the rest of Alcona County, giving the north a different pattern from the coastal strip near Harrisville. Lost Lake Woods is labeled to the east of Hubbard Lake, and many smaller water features and streams appear between the larger named places. The map therefore works best when read as a network of separated local centers rather than as one continuous built-up area.
The western half has fewer large place labels and more space between major roads. M-65 and M-72 are useful orientation lines there, but the background still contains many small waterways. This is important because an area with fewer town names is not empty land; the water and elevation maps show that the interior contains a detailed natural landscape of low ridges, drainage channels, lakes, and ponds.
In the south, M-30 crosses the interior while US-23 remains the obvious shoreline route. The county’s east-west width means that a point near Lake Huron can be quite different in setting from a point near the western boundary. The map is useful for understanding that broad relationship, but it should not be used to estimate current driving time. Road conditions, construction, seasonal closures, and traffic require a current transportation source.
The green outline is the key to separating Alcona County from surrounding areas shown in the background. Nearby roads and landscape features continue beyond the boundary so that the county does not appear in isolation. That context is helpful for orientation, but the image is not a legal parcel or survey map. For official boundary work, a source such as Census TIGER/Line should be used instead.
For a visitor who needs one map to start with, this general view is the most balanced choice. It combines Harrisville, Lincoln, Hubbard Lake, the Lake Huron edge, and the principal highways without focusing too heavily on any one theme. The next map deliberately removes much of that detail so the two ranked major places can be compared more directly.
Harrisville and Lincoln as two different county reference points
The major-city distribution map highlights only two ranked places: Harrisville at number 1 and Lincoln at number 2. Harrisville sits close to the Lake Huron shore, while Lincoln is clearly inland to the west. With most road labels removed, the east-west separation between the two places is more obvious than it is on the general map.
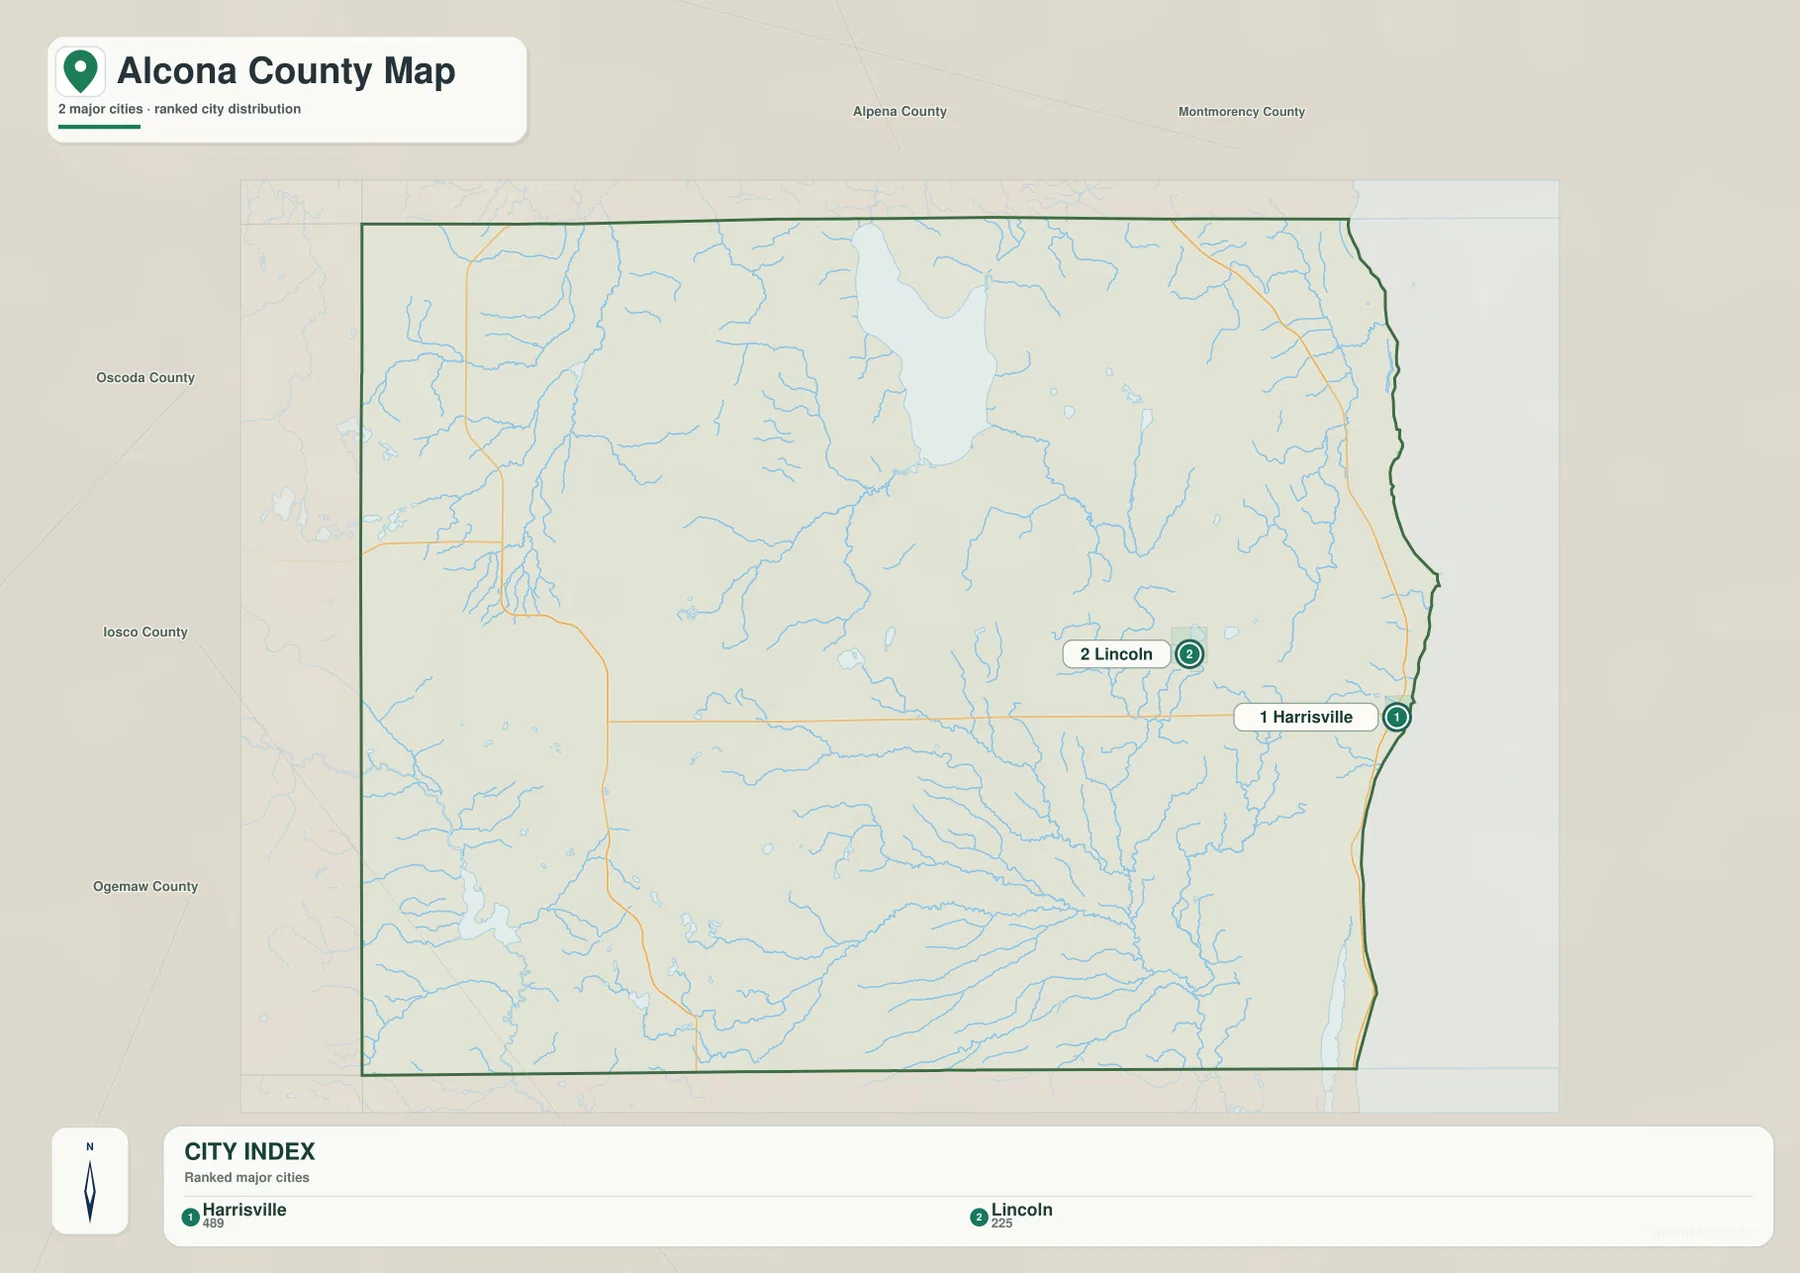
The CITY INDEX printed along the bottom shows reference values of 489 for Harrisville and 225 for Lincoln. Those figures should be treated as the values used to build this particular map, not as a guarantee of the latest official population count. Population estimates change by year and methodology, so current demographic research should use the U.S. Census Bureau or another current statistical source. For this map, the more important information is the location and ranking of the two points.
Harrisville’s position near the eastern boundary reinforces the importance of the US-23 and Lake Huron corridor. Lincoln, by contrast, sits among inland roads and drainage channels. On the general map, this difference is mixed with highway numbers and many background details; on the city map, it becomes a simple visual comparison between a coastal reference point and an interior one.
Names of neighboring counties appear around the outside, including Alpena, Montmorency, Oscoda, Iosco, and Ogemaw. Their labels help place Alcona County within northeastern Lower Michigan without turning this into a detailed regional road map. If the goal is to study any of those surrounding counties, a dedicated map for that county will provide more useful detail than the edge of this image.
No connector line or straight-line distance measurement is drawn between Harrisville and Lincoln. Their spacing on the page gives a visual sense of direction and separation, but it is not a route calculation. Actual travel depends on the road chosen and current conditions, so the general map and a current navigation service are better choices for trip planning.
The absence of Hubbard Lake and other communities from the ranked city points does not mean they are unimportant. This view is intentionally selective. It is useful for a simple settlement comparison, while the general map is better for named localities and roads and the water map is better for the large lake, river branches, and drainage pattern.
Hubbard Lake, Pine River branches, and the Lake Huron drainage side
The terrain-and-water map changes the emphasis completely. Hubbard Lake becomes the dominant northern feature, Black River stands out near the northeast, and the Pine River system branches through the south-central part of Alcona County. Along the southwestern edge, the Au Sable River and Alcona Dam Pond provide another major water reference. The map makes it clear that the county’s natural geography is far more intricate than the road map alone suggests.
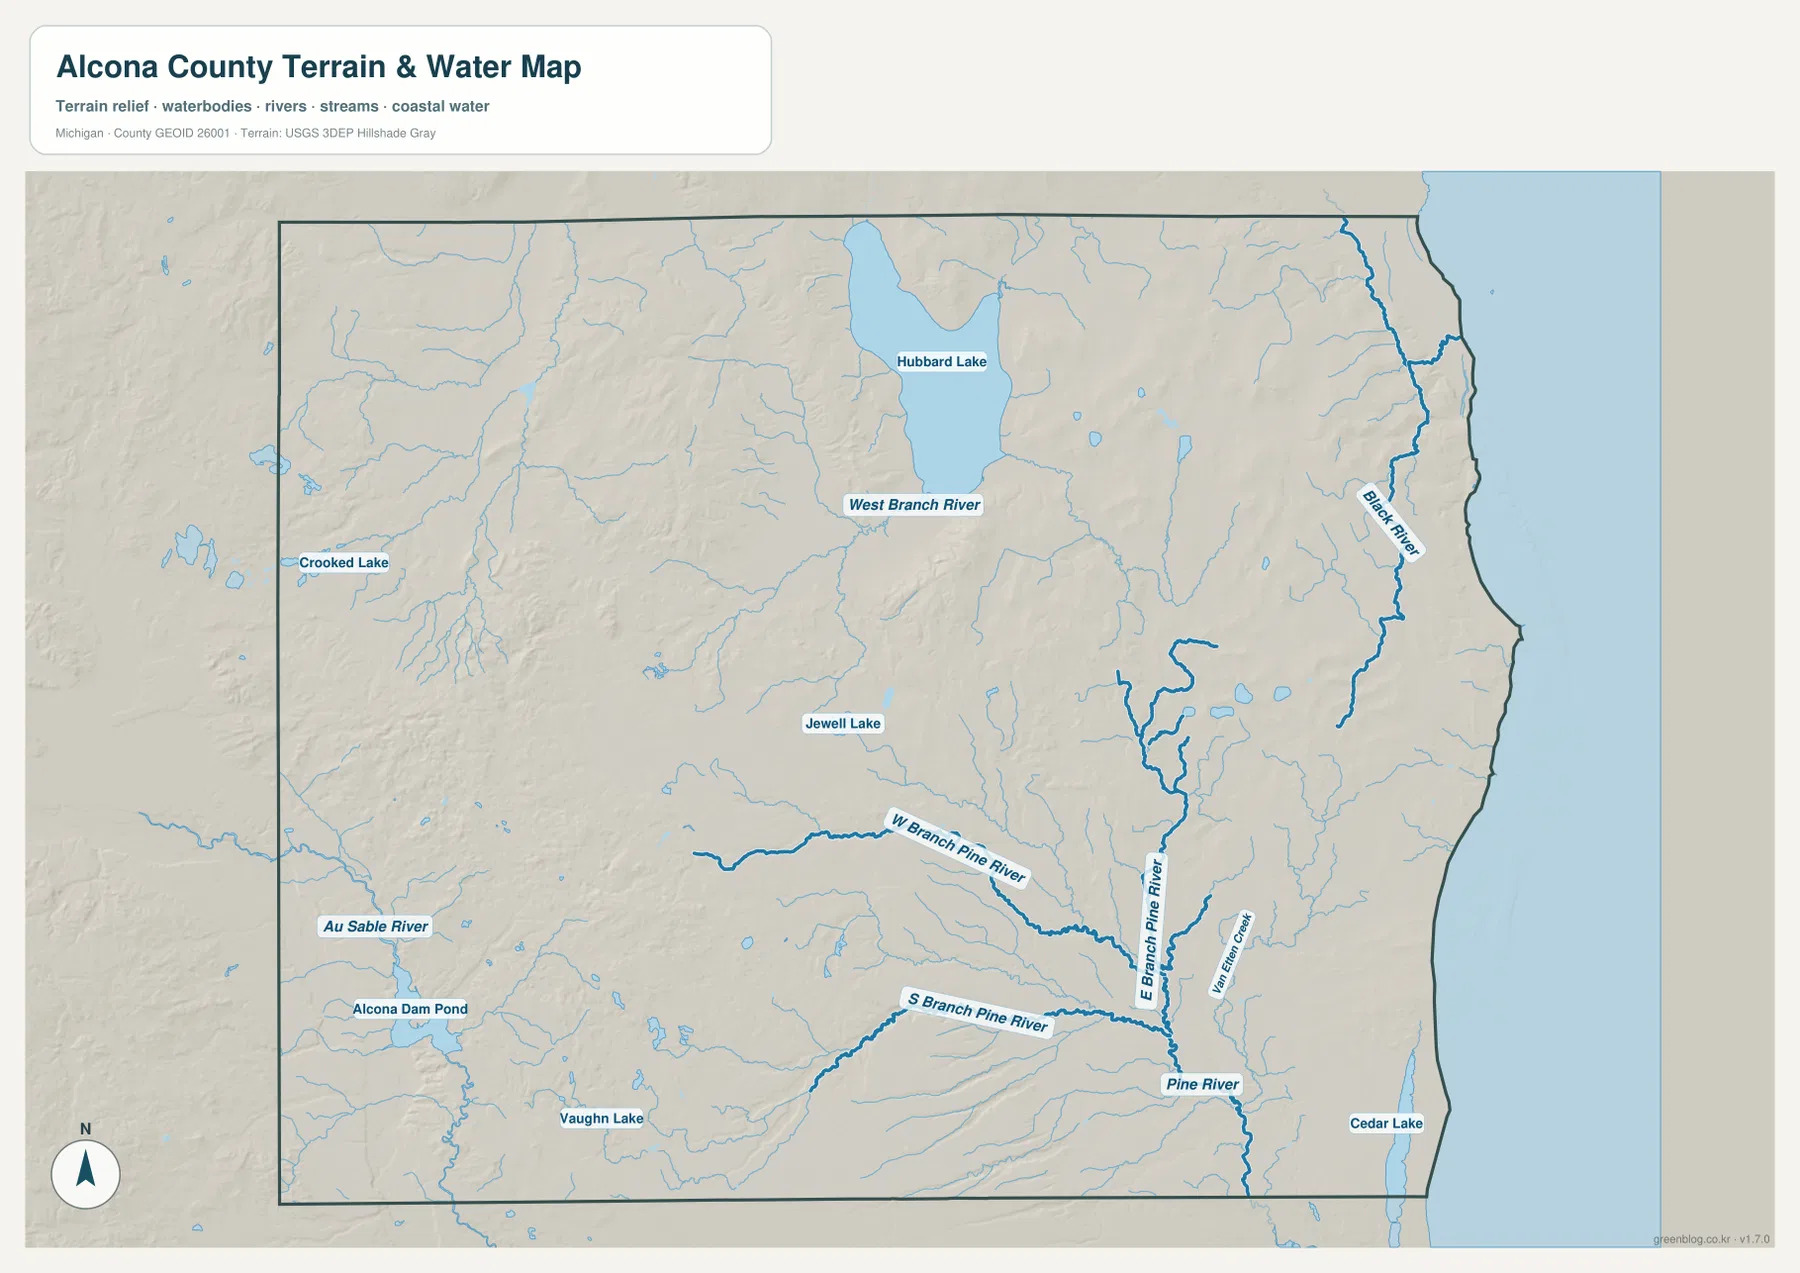
Hubbard Lake occupies a broad area in the north and is surrounded by smaller drainage lines. West Branch River is labeled just south of the lake, while numerous unnamed or lightly labeled tributaries extend around it. The general county map is better for following roads around the lake, but this view makes the water connections easier to separate from transportation features.
The Pine River system is especially detailed. West Branch Pine River approaches from the west, South Branch Pine River comes in from the southwest, and East Branch Pine River descends from the north before the system continues toward the southeast. The pattern is not a single straight channel. Several branches collect across a wide area, which is why the southern interior looks much more connected when water is emphasized.
Black River is one of the clearest named rivers in the northeast. It runs near the Lake Huron side and receives smaller tributaries from the interior. The large blue area at the far right is Lake Huron itself, so the relationship between inland streams and the Great Lakes shore is easy to see. The map does not identify discharge, water quality, or navigable depth; those questions require current hydrologic or management data.
Smaller named waters add detail across the rest of the county. Crooked Lake appears near the western edge, Jewell Lake lies farther toward the center-west, and Vaughn Lake is shown in the southwest. Cedar Lake is visible near the southeastern side. Alcona Dam Pond and the Au Sable River are also prominent near the southwest, illustrating that important water features are not limited to Hubbard Lake or the Lake Huron shoreline.
The shaded-relief background helps explain why the streams take such varied paths. Higher ridges are more common to the west and in parts of the interior, while lower terrain becomes more extensive toward the Lake Huron side. Streams occupy lower corridors between those ridges, although this visualization is not detailed enough to calculate channel slope or watershed boundaries precisely.
This is a water-reference map, not a flood map. The blue lines and filled water bodies show location and general form, not flood probability, legal access, water depth, safe boating routes, or water quality. Anyone making a safety, property, or resource-management decision should consult the relevant agency and current datasets rather than relying on this image alone.
Higher western hills and lower terrain toward Lake Huron
The elevation map removes nearly all place labels so the county’s relief can be read directly. Its local color scale runs roughly from 184 meters in dark green to 340 meters in brown, while the note on the map gives an actual data range of about 177 to 385 meters and a mean elevation of 253 meters. These figures provide useful county-wide context, but the map remains a generalized surface rather than a survey-grade measurement product.
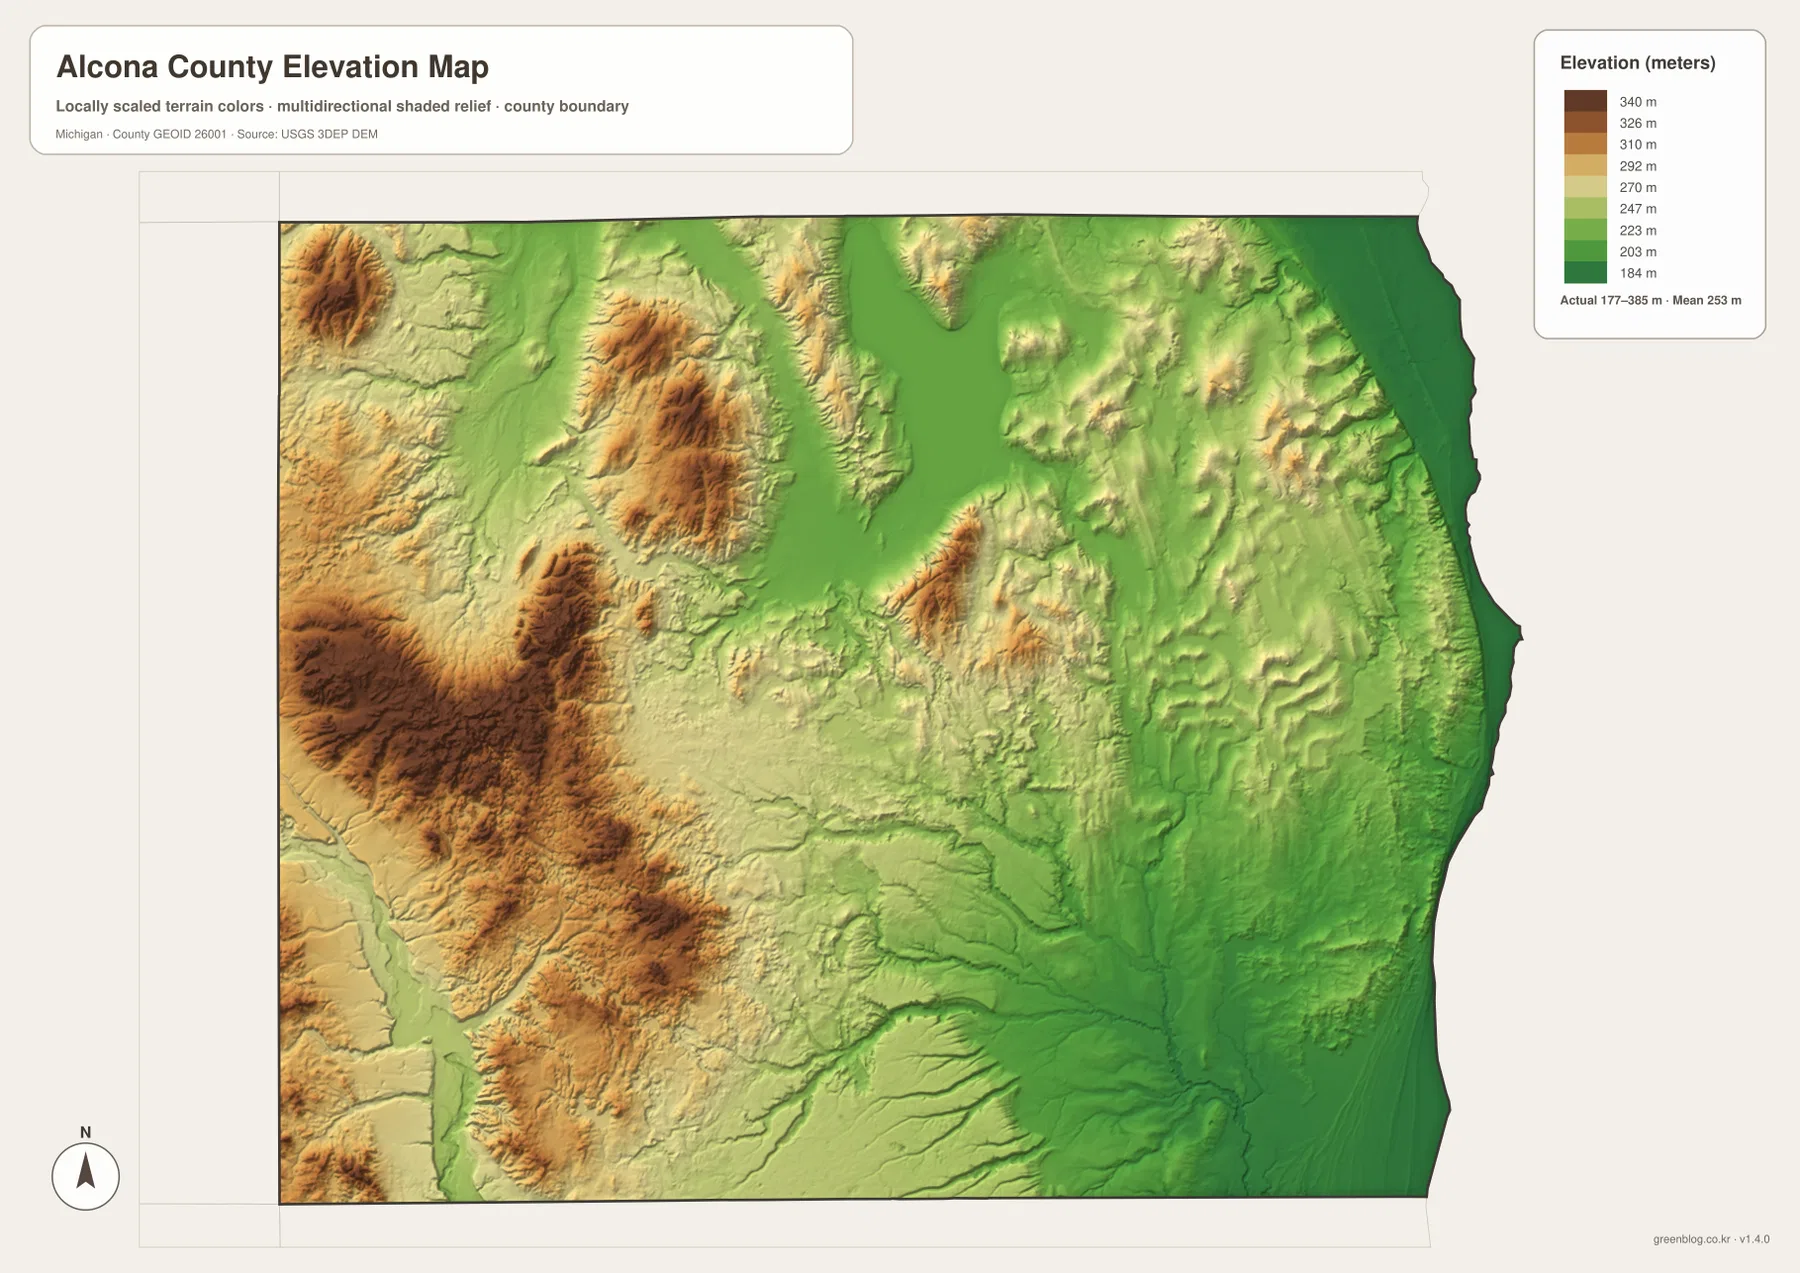
The highest-looking terrain is concentrated in the west, southwest, and several northwestern hill groups. Rather than one continuous mountain ridge, the map shows a sequence of elevated patches separated by lower corridors. Colors become lighter through the center and increasingly green toward the eastern side. The Lake Huron shore is among the lowest broad areas on the map, creating a strong visual west-to-east contrast.
Hubbard Lake occupies a lower-looking northern basin compared with some of the hills to its west and southwest. Farther south, the Pine River system follows low corridors through terrain that rises on either side. Comparing the water and elevation maps makes those relationships easier to understand: river branches tend to occupy the lower parts of the landscape, while the brown and tan ridges form higher ground between them.
The Lake Huron side is broadly lower, but that does not mean every coastal point has the same elevation. Small ridges and local depressions still appear across the eastern part of the county. For construction, drainage design, site grading, or any task that depends on precise elevation, the generalized colors should be replaced with detailed elevation data such as USGS 3DEP products.
For teaching or a regional overview, the elevation map pairs especially well with the general road map. US-23 can be located close to the lower eastern side, while M-65 and M-72 reach farther into the higher western interior. Because place names are mostly absent from the elevation view, it is helpful to locate Harrisville, Lincoln, and Hubbard Lake on another map first and then compare their surrounding terrain.
The colors are scaled to show differences within Alcona County, so they should not be compared directly with the colors on another county’s elevation map. A similar shade on two separately scaled maps may represent different actual heights. The printed range and the underlying elevation dataset are the correct references for numerical comparison.
Choosing the clearest Alcona County map for the task
Use the general map when roads and named places matter most. It is the best view for locating Harrisville and Lincoln, following US-23 along the Lake Huron side, and seeing how M-72, M-65, M-30, and M-41 reach different parts of the interior. It also keeps Hubbard Lake visible while providing enough surrounding context to understand the county’s overall shape.
Use the city distribution map when the goal is a very simple comparison of Harrisville and Lincoln. With most transportation detail removed, their coastal-versus-inland positions are immediately clear. For Hubbard Lake, Pine River, Black River, Au Sable River, and the many smaller lakes and streams, the terrain-and-water map is the more informative choice.
The elevation map is most useful when the topic is relief rather than roads or place names. It shows why the western interior feels different from the Lake Huron side and helps connect the river network to lower terrain corridors. It is appropriate for a county overview, but not for parcel elevation, engineering, or precise trail-gradient calculations.
Michigan DNR’s official Harrisville State Park page provides a useful local confirmation of the county’s coastal setting: the park is in Harrisville along the Lake Huron shore. That context matches what the county and water maps show visually. A reader can locate Harrisville on the eastern edge, recognize US-23 as the main nearby north-south road, and then use the water map to understand the broader Lake Huron setting.
The WebP images in the article are convenient for quick viewing, while the downloadable ZIP contains the original high-resolution JPG files for larger display or printing. The archive includes the general county map, the major-city distribution map, the terrain-and-water map, and the elevation map. Choosing the view that matches the question usually produces a clearer result than trying to use one image for every purpose.
Frequently Asked Questions
Which map is best for finding Harrisville, Lincoln, and US-23 together?
The general county map is the best choice. It places Harrisville near the Lake Huron and US-23 corridor, shows Lincoln farther inland, and includes M-72, M-65, M-30, and M-41 for broader orientation. The city distribution map is useful as a second view if you only need the relative positions of Harrisville and Lincoln.
Does the water map show Hubbard Lake and Pine River, and can it be used for flood risk?
Yes, the terrain-and-water map shows Hubbard Lake, multiple Pine River branches, Black River, and the Au Sable River area. It does not show flood zones, water depth, water quality, or safe navigation. Flood and water-management decisions require current official agency data.
What does the 177-385 meter elevation range mean on the Alcona County map?
The elevation graphic notes an actual data range of about 177 to 385 meters with a mean of 253 meters, while its display scale uses selected color steps to emphasize local differences. It is useful for seeing higher western hills and lower terrain toward Lake Huron, but it is not precise enough for surveying, engineering, or site-specific elevation work.
Map File Information
The ZIP contains the original high-resolution JPG files for the Alcona County general map, major-city distribution map, terrain-and-water map, and elevation map described on this page.
- Included Files: General county map, major-city distribution map, terrain-and-water map, elevation map
- File Type: JPG
Related Maps
Sources and references
These official resources are useful for checking county boundaries, hydrography, elevation data, and the Lake Huron setting at Harrisville.
- U.S. Census Bureau TIGER/Line Shapefiles
- USGS National Hydrography
- USGS 3D Elevation Program
- Michigan DNR – Harrisville State Park
Green Map creates custom-edited map images using open geographic data sources such as geoBoundaries, Natural Earth, OpenStreetMap, and government open data. These maps are edited visual materials, not raw data files, and are provided for education, documents, presentations, and graphic reference.