The UNESCO Institute for Statistics (UIS) indicator MOR.5T8.40540.GPIA reports the adjusted gender parity index for the outbound student mobility ratio to sub-Saharan Africa in 2023. The source contains 97 country- or area-level observations. GPIA is an index centered on 1, not a percentage. A value close to 1 means the female and male values of the underlying outbound mobility ratio are similar; a value below 1 means the female value is lower than the male value, while a value above 1 means the female value is higher.
Across the 97 observations, the simple mean is 0.9233 and the median is 0.9089. Those two summaries are useful, but they do not capture the shape of this dataset. Seven observations are exactly 0 and eleven are exactly 2, the two boundaries of the adjusted index. These endpoint values should not be read as 0% or 200%. They indicate an extreme gender imbalance in the underlying female-to-male relationship, which pushes the adjusted index to its lower or upper limit.
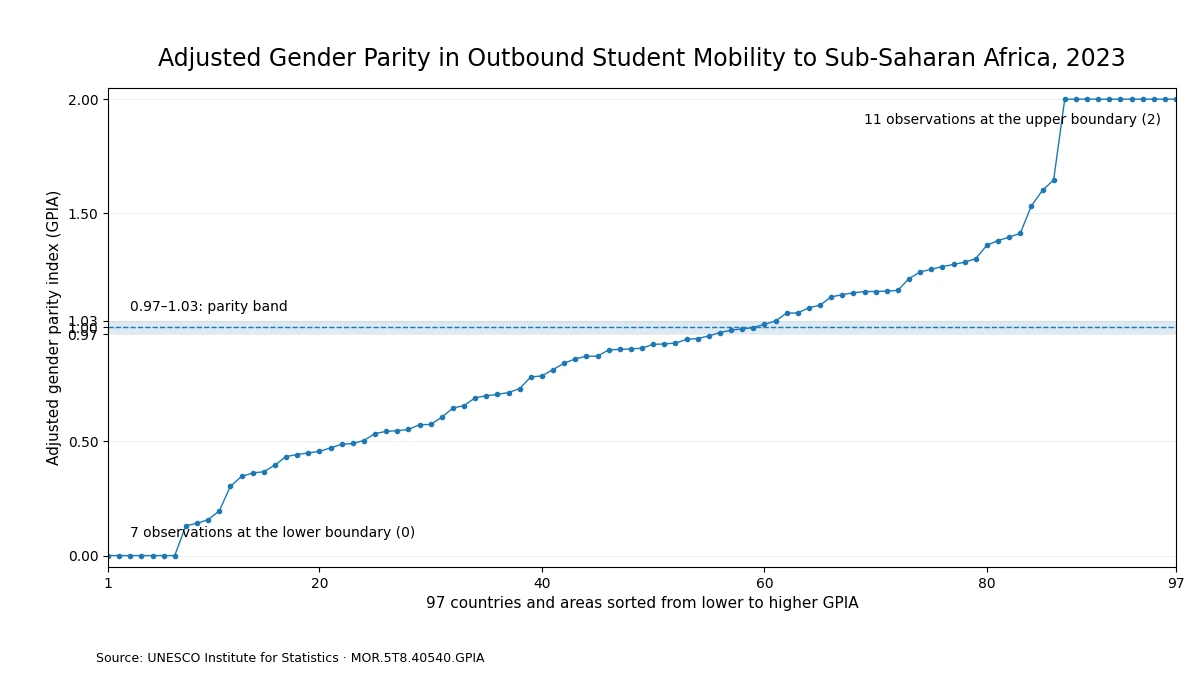
Table of Contents
The index measures gender balance, not the number of mobile students
The most important distinction is between the underlying mobility ratio and the parity index derived from it. GPIA does not tell us how many students from a country study in sub-Saharan Africa, and it does not show the level of outbound mobility by itself. Instead, it compares the female and male values of that underlying indicator. Two countries can both have a GPIA near 1 even if the actual mobility ratios in the two countries are very different, because parity concerns the relationship between the two sexes rather than the absolute level.
UIS adjusts the conventional female-to-male ratio so that the index is symmetric around 1. When the female indicator value is less than or equal to the male value, the female value divided by the male value is used. When the female value is higher, UIS applies an adjusted formula that keeps the result below 2. This makes equal-sized departures below and above 1 easier to compare. UIS commonly interprets 0.97 to 1.03 as a practical gender-parity band. In this dataset, only six of the 97 observations fall inside that interval.
More observations fall below the parity band than above it
Using the UIS parity band, 55 observations are below 0.97, six are between 0.97 and 1.03, and 36 are above 1.03. In other words, among the country and area rows present in this file, a lower female value of the underlying outbound mobility ratio is more common than a higher female value. This is a count of country-level observations, not a student-weighted regional total. A small country and a large country each contribute one observation, so the counts should not be generalized to the share of all internationally mobile students.
The first quartile is 0.5349 and the third quartile is 1.2139, meaning that the middle half of the observations lies between those two values. The median of 0.9089 is below the equality point of 1, but the presence of many boundary observations at 0 and 2 makes the distribution unusual. For that reason, the parity-band counts and individual country values are more informative than treating the mean as a single measure of gender balance for the entire region.
| Measure | 2023 value |
|---|---|
| Country/area observations | 97 |
| Simple mean | 0.9233 |
| Median | 0.9089 |
| First quartile | 0.5349 |
| Third quartile | 1.2139 |
| Below 0.97 | 55 |
| 0.97–1.03 parity band | 6 |
| Above 1.03 | 36 |
| Exactly 0 | 7 |
| Exactly 2 | 11 |
Values near 1 and values at the boundaries need different interpretations
Germany at 0.9770, China at 0.9878, Egypt at 0.9932, Denmark at 1.0135, and Brazil at 1.0281 are among the observations inside the 0.97–1.03 parity band. These figures indicate that the female and male values of the destination-specific mobility ratio are relatively close. They do not mean that those countries have high outbound mobility, nor do they tell us how many students are involved. Sweden at 0.9623 and Morocco at 1.0623 sit just outside the band and are better understood as nearby points on a continuous index than as fundamentally different categories.
At the lower boundary, Andorra, Brunei Darussalam, Czechia, the Dominican Republic, Estonia, the Republic of Moldova, and Mongolia have a value of 0. At the upper boundary, Albania, Armenia, Azerbaijan, Bahrain, Georgia, Lithuania, Monaco, Nicaragua, Saint Lucia, Uruguay, and the British Virgin Islands have a value of 2. Calling these simply the ‘lowest’ and ‘highest’ countries would be misleading. The endpoints show an extreme relative imbalance in the underlying sex-specific ratios, but this dataset alone does not reveal the student counts or causes behind those results.
Excluding the endpoints reveals the largest interior gaps
Among the 79 observations that fall strictly between 0 and 2, Nepal has one of the lowest values at 0.1314, followed by South Africa at 0.1410, Bulgaria at 0.1577, Jordan at 0.1955, and Palestine at 0.3033. These values point to a much lower female than male value of the underlying outbound mobility ratio. At the other end of the interior range, Serbia is 1.6459, Hungary 1.6007, Ukraine 1.5323, Poland 1.4121, and Slovenia 1.3849, indicating a higher female than male value.
The words ‘higher’ and ‘lower’ should not be converted into a policy score. Student mobility toward a particular destination region can be shaped by language, scholarship systems, bilateral agreements, tuition costs, migration networks, program availability, and field of study, among many other factors. None of those explanatory variables is included in this dataset. The evidence supports a description of the gender relationship in the measured mobility ratio, but it does not support claims about why the difference exists or whether one direction is better.
| Country or area | GPIA | Direction relative to parity |
|---|---|---|
| Nepal | 0.1314 | Female value lower than male value |
| South Africa | 0.1410 | Female value lower than male value |
| Bulgaria | 0.1577 | Female value lower than male value |
| Germany | 0.9770 | Parity band |
| China | 0.9878 | Parity band |
| Egypt | 0.9932 | Parity band |
| Denmark | 1.0135 | Parity band |
| Brazil | 1.0281 | Parity band |
| Poland | 1.4121 | Female value higher than male value |
| Ukraine | 1.5323 | Female value higher than male value |
| Hungary | 1.6007 | Female value higher than male value |
| Serbia | 1.6459 | Female value higher than male value |
Why the simple average is not a regional gender gap
The mean of 0.9233 gives every country or area the same weight. It does not weight observations by tertiary enrolment, the number of internationally mobile students, or the number of students going specifically to sub-Saharan Africa. Therefore, it is not an aggregate female-to-male ratio for all student flows. A true regional aggregate would require the sex-specific underlying counts or official UIS regional aggregates, not an average of country GPIA values.
Coverage also matters. The file contains 97 national-level observations for 2023, while many other catalogue countries and territories are absent. An absent country should not be treated as zero. No missing geography was filled with an estimated value, and no observation from another year was substituted into the 2023 comparison. A trend analysis would require checking year-by-year coverage and the consistency of the underlying series before comparing changes over time.
What this indicator can and cannot answer
The 2023 series answers a focused question: how similar are the female and male values of the outbound mobility ratio to sub-Saharan Africa among the 97 countries and areas with observations? It shows that only six observations lie in the conventional parity band and that values below 0.97 outnumber values above 1.03. It also shows a substantial number of endpoint observations, which is why a distribution view is more informative than a conventional ranking alone.
It cannot tell us the total number of outbound students, the overall probability of studying abroad, the size of flows to individual destination countries, the quality of higher education, or the accessibility of scholarships. A GPIA near 1 does not mean mobility is high; it only means the female and male values are similar. To evaluate access or participation levels, the sex-specific mobility ratios and student counts should be examined alongside the parity index.
Data source and calculation
The country values come from the UNESCO UIS Data API series MOR.5T8.40540.GPIA for 2023. All 97 rows in the supplied national-level extract have numeric values. The mean, median, quartiles, parity-band counts, and endpoint counts were calculated directly from those 97 observations without imputing missing countries.
The interpretation of the adjusted gender parity index follows the UIS explanation of the Adjusted Gender Parity Index. GPIA is symmetric around 1, bounded between 0 and 2, and 0.97–1.03 is commonly used as a practical parity interval. Because the underlying measure here is outbound mobility to a destination region, values above or below 1 are described as differences in female and male mobility ratios rather than as advantages or disadvantages.
Frequently Asked Questions
What does a GPIA of 1 mean?
It means the female and male values of the underlying outbound mobility ratio are equal. UIS commonly uses 0.97–1.03 as a practical parity band.
How many 2023 observations are inside the parity band?
Six of the 97 country- and area-level observations fall between 0.97 and 1.03.
Do GPIA values of 0 and 2 mean 0% and 200%?
No. GPIA is an adjusted index bounded between 0 and 2. Those endpoints represent an extreme imbalance in the underlying female-to-male relationship.
Is the mean of 0.9233 a student-weighted regional gender ratio?
No. It is a simple unweighted mean of the 97 country and area observations, not an aggregate weighted by student numbers.
Related Articles
Green Map creates custom-edited map images using open geographic data sources such as geoBoundaries, Natural Earth, OpenStreetMap, and government open data. These maps are edited visual materials, not raw data files, and are provided for education, documents, presentations, and graphic reference.