New York recorded the largest 2022 value in this EIA state series for residential energy-related carbon dioxide emissions, at 33.908 million metric tons of CO₂. California followed at 25.127 million metric tons, Illinois at 24.766, Michigan at 20.751, and Pennsylvania at 20.087. Adding the 50 states and the District of Columbia produces 340.780 million metric tons across the 51 observations, and the top 10 account for about 57.4% of that sum.
This is not a complete household carbon-footprint measure. The U.S. Energy Information Administration organizes energy-related CO₂ emissions by fuel and consuming sector. The slice used here fixes the fuel category at All Fuels and the sector at Residential for annual 2022 observations. It is useful for comparing the absolute amount of energy-related CO₂ recorded in the residential sector across states, but it should not be treated as an inventory of every indirect emission associated with household consumption, travel, food, products, or services.
Absolute totals also reflect more than one underlying factor. Population, the amount of energy used in homes, the mix of heating fuels, weather, housing characteristics, and other conditions can all matter. Those explanatory variables are not included in this single series. For that reason, the ranking below is kept to what the data can establish directly: the size of the reported values, their distribution, their share of the 51-observation sum, and the limits of interpreting an absolute total.
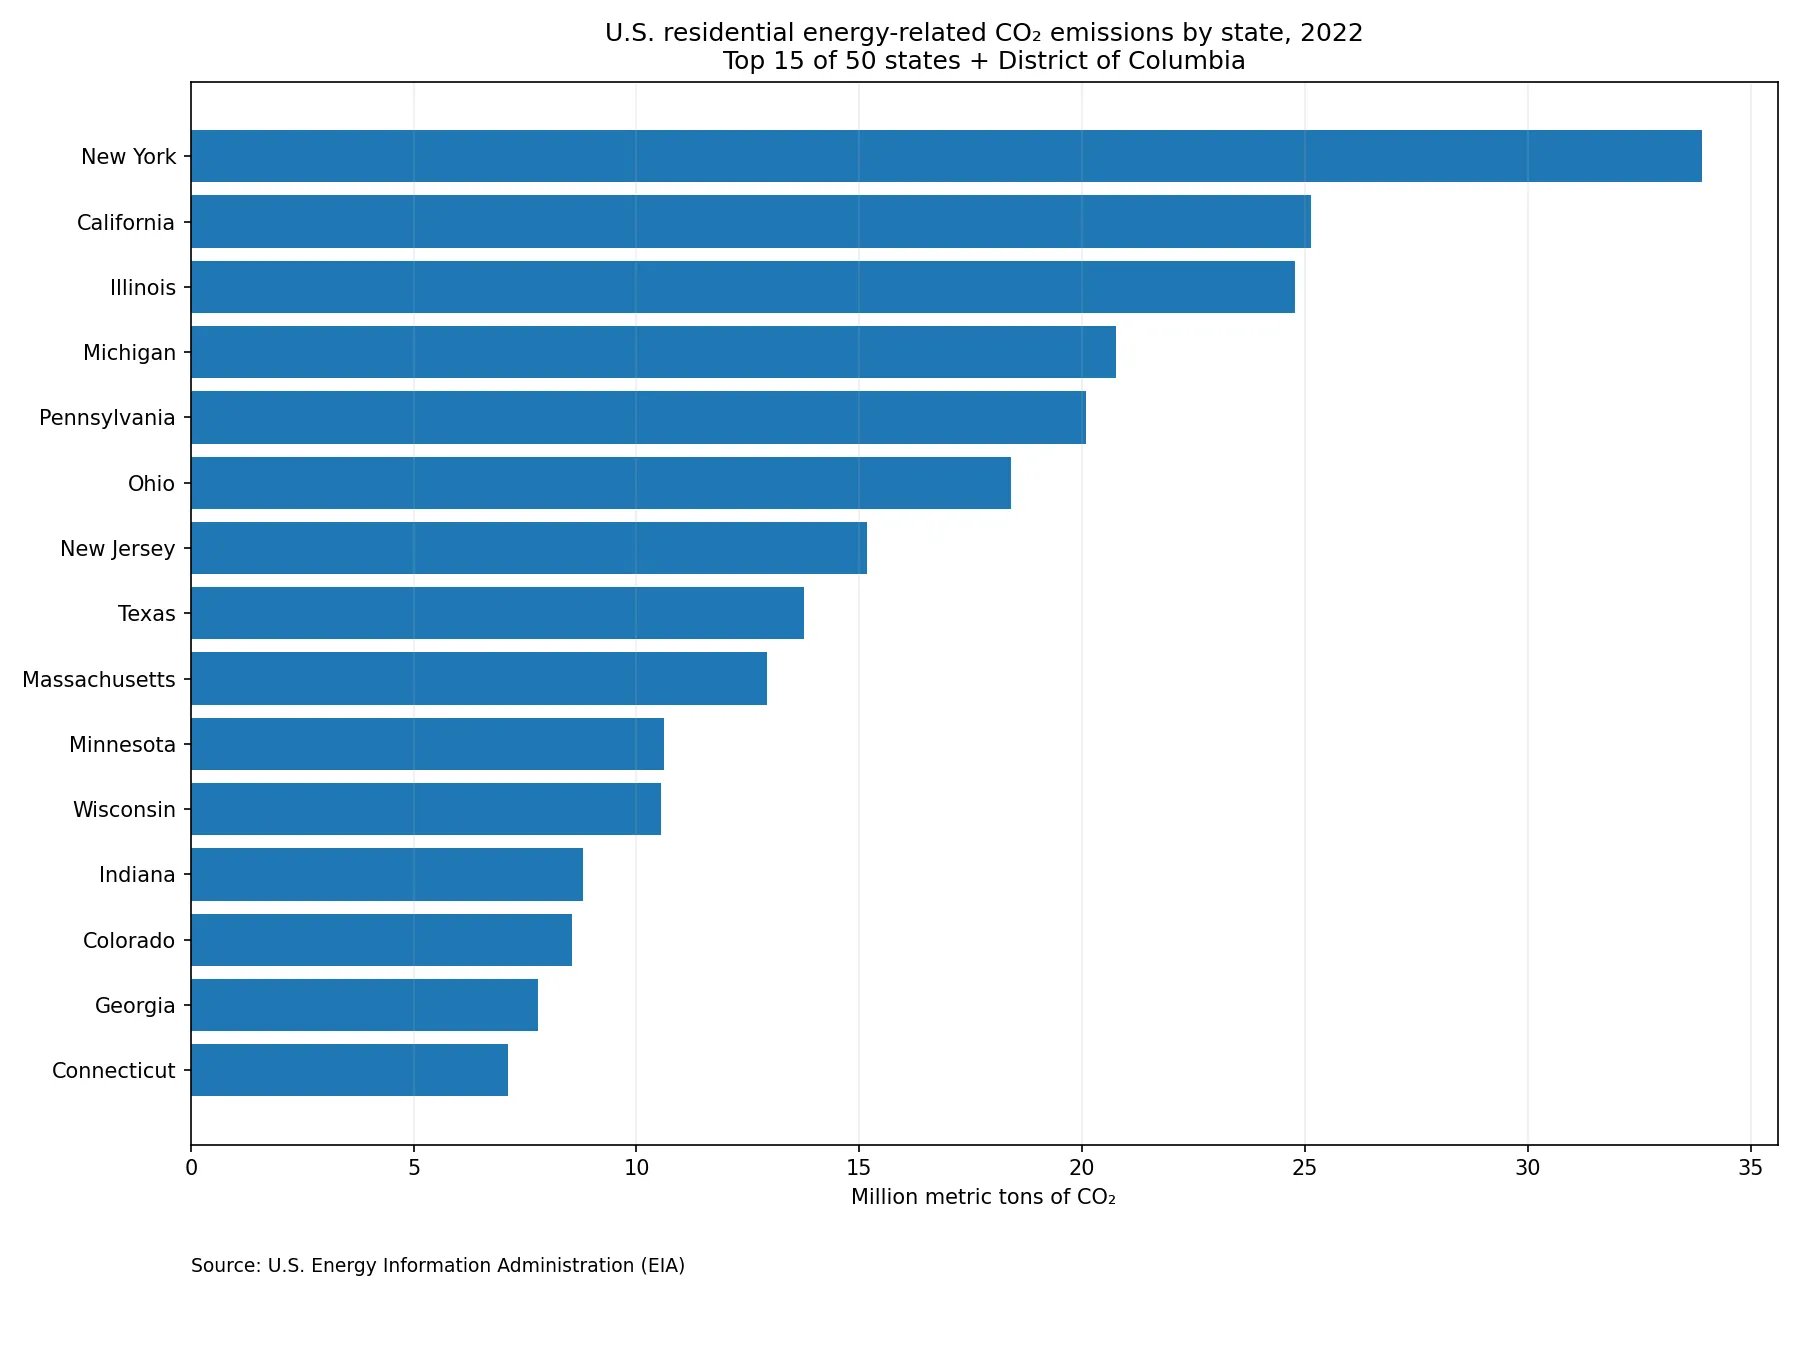
Table of Contents
What this EIA metric actually measures
EIA describes energy-related CO₂ emissions as carbon dioxide released in connection with energy consumption. Its state emissions system separates observations by consuming sector, including residential, commercial, industrial, transportation, and electric power. The series used here selects Residential and All Fuels, so it combines the fuel categories included in that residential aggregate rather than ranking a single fuel such as natural gas or petroleum.
The unit is million metric tons of CO₂. New York’s value of 33.907544 therefore represents about 33.9 million metric tons in this series. A larger state total does not automatically imply a larger per-capita value. A state with more residents or more households can have a high aggregate even if emissions per resident are moderate, while a smaller state can have a low aggregate but a different result after normalization.
The term energy-related is also important. This is a carbon-dioxide measure tied to energy use, not an all-greenhouse-gas inventory and not a life-cycle household footprint. It should not be expanded to cover methane, nitrous oxide, land-use change, non-energy industrial processes, or the full upstream emissions of goods and services unless separate datasets are added.
The 2022 distribution is broad rather than uniform
The direct sum of all 51 observations is 340.780 million metric tons. The simple mean is 6.682, while the median is only 3.363 million metric tons. That gap indicates that larger observations near the top pull the average upward. The first quartile is 1.963 and the third quartile is 8.167, so the middle half of jurisdictions lies roughly between those values.
The top four states—New York, California, Illinois, and Michigan—sum to 104.552 million metric tons, or about 30.7% of the 51-observation total. The top 10 sum to 195.510 million metric tons, representing about 57.4%, and the top 15 reach about 69.9%. This is a concentrated upper tail, but it is not a case in which one state alone dominates the entire distribution.
At the low end, Hawaii reports 0.038 million metric tons, followed by the District of Columbia at 0.698, Wyoming at 0.971, and Delaware at 1.016. Every jurisdiction in this dataset has a positive numeric value, so there is no need to substitute zeroes for missing records or to borrow observations from another year.
The 15 largest state values
| Rank | State | 2022 emissions (million metric tons CO₂) | Share of 51-observation sum |
|---|---|---|---|
| 1 | New York (NY) | 33.908 | 9.9% |
| 2 | California (CA) | 25.127 | 7.4% |
| 3 | Illinois (IL) | 24.766 | 7.3% |
| 4 | Michigan (MI) | 20.751 | 6.1% |
| 5 | Pennsylvania (PA) | 20.087 | 5.9% |
| 6 | Ohio (OH) | 18.408 | 5.4% |
| 7 | New Jersey (NJ) | 15.171 | 4.5% |
| 8 | Texas (TX) | 13.748 | 4.0% |
| 9 | Massachusetts (MA) | 12.924 | 3.8% |
| 10 | Minnesota (MN) | 10.620 | 3.1% |
| 11 | Wisconsin (WI) | 10.542 | 3.1% |
| 12 | Indiana (IN) | 8.809 | 2.6% |
| 13 | Colorado (CO) | 8.545 | 2.5% |
| 14 | Georgia (GA) | 7.788 | 2.3% |
| 15 | Connecticut (CT) | 7.123 | 2.1% |
Several northeastern and midwestern states appear near the top, including New York, New Jersey, Massachusetts, Connecticut, Illinois, Michigan, Ohio, Minnesota, Wisconsin, and Indiana. But the upper group also includes California, Texas, Colorado, and Georgia. The pattern therefore cannot be reduced to a single U.S. region. The ranking identifies where totals are large; explaining why requires additional variables.
New York alone represents about 9.95% of the sum, while California and Illinois each contribute a little more than 7%. The gap between New York and California is about 8.780 million metric tons, or roughly 2.6% of the 51-jurisdiction total. The upper end is therefore built from several large states rather than one outlier accounting for most of the total.
Why an absolute emissions ranking is not an efficiency ranking
Residential CO₂ totals can be influenced by the scale of the population and housing stock as well as the energy used in buildings. Heating systems, direct use of natural gas or petroleum products, winter conditions, building size, energy efficiency, fuel prices, and local supply structures can all affect energy consumption. None of those explanatory dimensions is present in this one four-column dataset, so they should not be inferred from the rank alone.
A per-capita comparison would require population data for the same year and a clearly defined denominator. A per-household comparison would require household counts. An efficiency analysis would need energy consumption, housing characteristics, climate measures, or other inputs. Each normalization answers a different question. Mixing them with the absolute total can turn a straightforward state comparison into a misleading performance score.
The safest description is therefore specific: these are 2022 EIA residential-sector, All Fuels energy-related CO₂ totals by state. They establish the relative size of that metric, not the cause of the emissions or the efficiency of households in each state.
The lower end of the distribution still varies substantially
| Jurisdiction | 2022 emissions (million metric tons CO₂) | Share of 51-observation sum |
|---|---|---|
| Hawaii (HI) | 0.038 | 0.01% |
| District of Columbia (DC) | 0.698 | 0.20% |
| Wyoming (WY) | 0.971 | 0.29% |
| Delaware (DE) | 1.016 | 0.30% |
| South Dakota (SD) | 1.145 | 0.34% |
| North Dakota (ND) | 1.201 | 0.35% |
| Vermont (VT) | 1.324 | 0.39% |
| Florida (FL) | 1.406 | 0.41% |
| Mississippi (MS) | 1.549 | 0.45% |
| Alaska (AK) | 1.599 | 0.47% |
The lowest 10 observations are all positive, but the spread inside the group is still substantial. Hawaii is far below the rest at 0.038 million metric tons. The District of Columbia and Wyoming are below 1 million, while Alaska is just under 1.6 million. Florida is also in the bottom 10 at 1.406 million metric tons even though it is one of the most populous states.
That last example is a reminder that population alone does not reproduce the ranking. Vermont and Alaska, both associated with cold-season heating needs, are also near the lower end in absolute terms. The dataset does not provide enough information to assign causes, but it clearly shows why a one-factor explanation would be inadequate.
The geography does not collapse into one regional story
The upper tier contains a cluster of northeastern and midwestern states, but it also includes large western and southern states. At the same time, some states in those same broad regions sit near the bottom. North Dakota and South Dakota are low in the ranking even though neighboring Minnesota is in the top 10, and Vermont is low while New York and Massachusetts are high.
A stronger follow-up analysis would layer in one variable at a time: population, households, residential energy consumption, fuel-specific emissions, heating fuels, or weather. Doing that with matched years can show whether the state order changes after normalization and which energy sources contribute most to the observed totals.
How this differs from other carbon-emissions measures
First, residential-sector emissions are not the same as total state CO₂ emissions. State totals also include other sectors such as transportation, industry, commercial activity, and electric power. A state can therefore rank very differently in the residential slice than in an economy-wide energy-related total. Second, energy-related CO₂ is narrower than an inventory of all greenhouse gases.
Third, an absolute total is not an emissions-intensity metric. Dividing by population, households, gross state product, floor area, or units of energy consumption can produce very different rankings because the denominator changes the question. Fourth, a single-year table is not a trend. To discuss whether a state is rising or falling, the same series should be compared over multiple years rather than mixing 2022 totals with values from another source or definition.
Source and calculation method
The underlying observations come from the U.S. Energy Information Administration CO₂ Emissions Aggregates API. The query uses annual frequency for 2022, fuelId=TO (All Fuels), and sectorId=RC (Residential). The dataset contains one row for each of the 50 states and the District of Columbia, all expressed in million metric tons of CO₂.
Rankings were calculated by sorting the reported value from largest to smallest. Shares were calculated by dividing each jurisdiction’s value by the direct sum of the 51 rows. The 340.780 million metric ton figure used in this article is therefore a computed sum of the supplied state and District of Columbia observations, not a separately retrieved U.S. national-total row. There are no missing or zero observations in the 2022 slice.
- EIA State Carbon Dioxide Emissions Data — official state energy-related CO₂ tables and background
- EIA CO₂ Emissions Aggregates API — the 2022 Residential, All Fuels query used here
- EIA state energy-related CO₂ methodology — documentation for the state estimates
The main takeaway
New York has the largest 2022 residential energy-related CO₂ total in this state series, with California and Illinois next. The more useful finding is not a simple winner-and-loser ranking, however. The values vary widely across states, the median is well below the mean, and the top 10 jurisdictions account for more than half of the direct sum of all 51 observations.
This makes the dataset a useful baseline for a second stage of analysis. Adding population or household counts can separate scale from intensity, while fuel-specific emissions can reveal which energy sources sit behind each state total. Used on its own, the table is best read as a standardized snapshot of absolute residential energy-related CO₂ emissions across U.S. states in 2022.
Frequently Asked Questions
Which state had the highest residential CO₂ emissions in 2022?
New York is highest in the EIA Residential, All Fuels state series at 33.908 million metric tons of CO₂, followed by California at 25.127 and Illinois at 24.766.
Is this a per-capita carbon-emissions ranking?
No. These are absolute state totals. A per-capita or per-household comparison requires an additional denominator for the same year.
Does residential CO₂ here mean a complete household carbon footprint?
No. It is the EIA energy-related CO₂ measure for the Residential sector under the All Fuels category. It does not represent every direct and indirect emission associated with household consumption.
What is the sum of the 51 state and D.C. observations?
The direct sum of the 2022 values is 340.780 million metric tons of CO₂. The top 10 jurisdictions account for about 57.4% of that sum.
Related Maps
Green Map creates custom-edited map images using open geographic data sources such as geoBoundaries, Natural Earth, OpenStreetMap, and government open data.
These maps are edited visual materials, not raw data files, and are provided for education, documents, presentations, and graphic reference.