Which destinations hosted the largest numbers of internationally mobile tertiary students in 2023? UNESCO Institute for Statistics (UIS) indicator 26637 reports total inbound internationally mobile students, both sexes combined, by destination country and area.
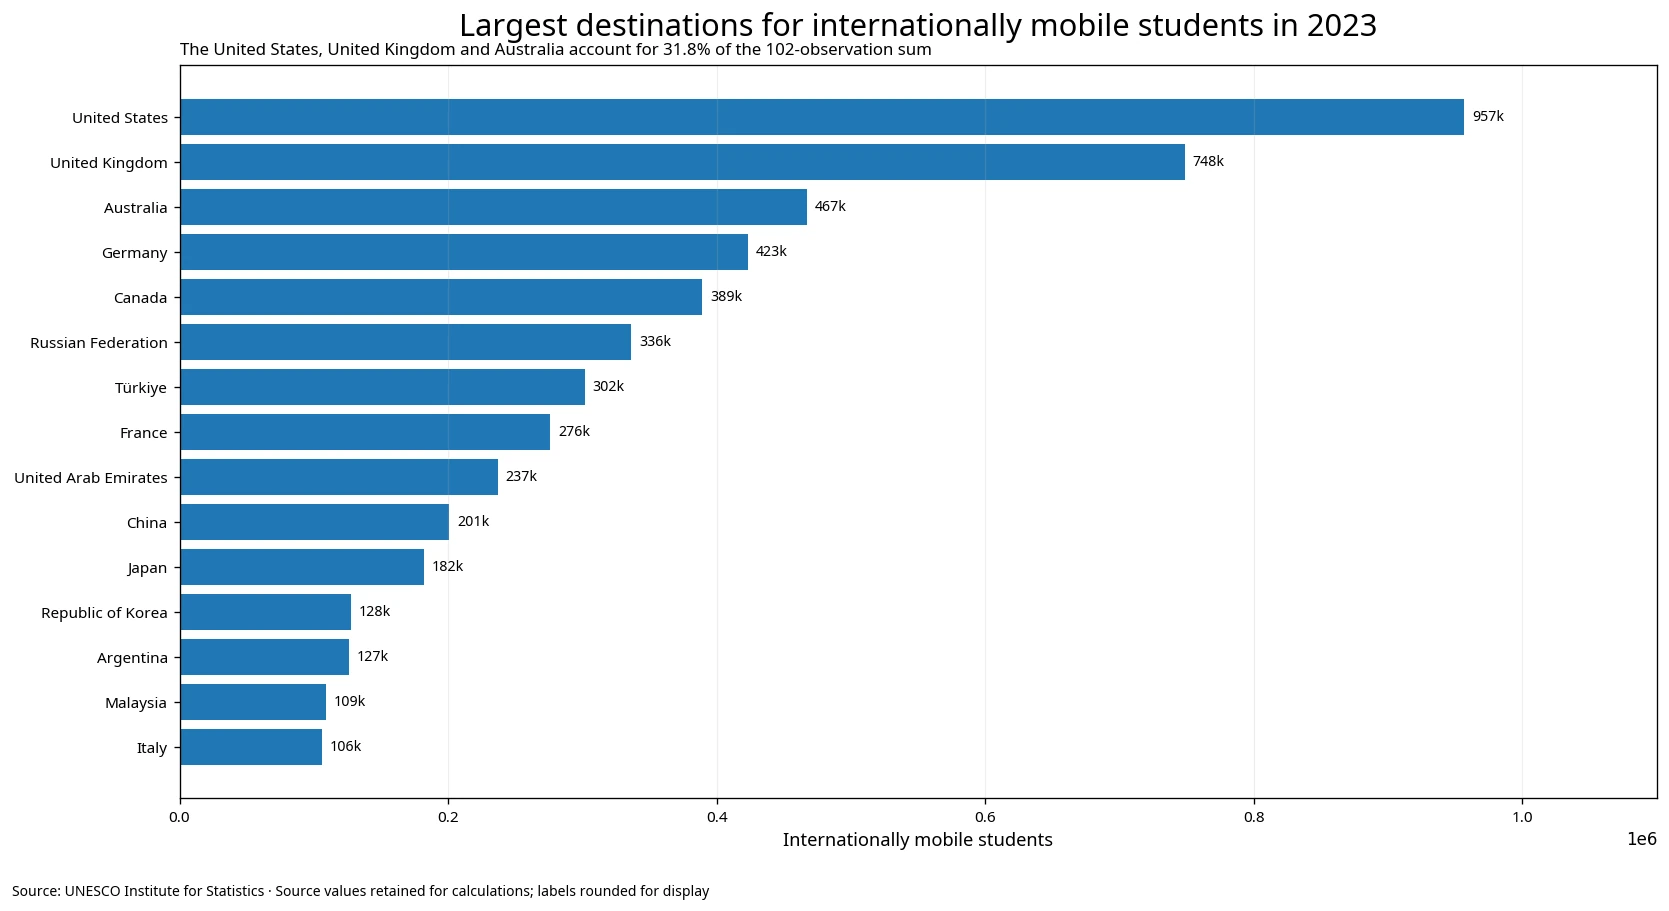
The extract contains 102 same-year observations. The United States has the largest value at about 956,923 students, followed by the United Kingdom at 748,461, Australia at 467,074, Germany at 423,197 and Canada at 389,181. The 102 observations sum to about 6.83 million, with the top five accounting for 43.7%.
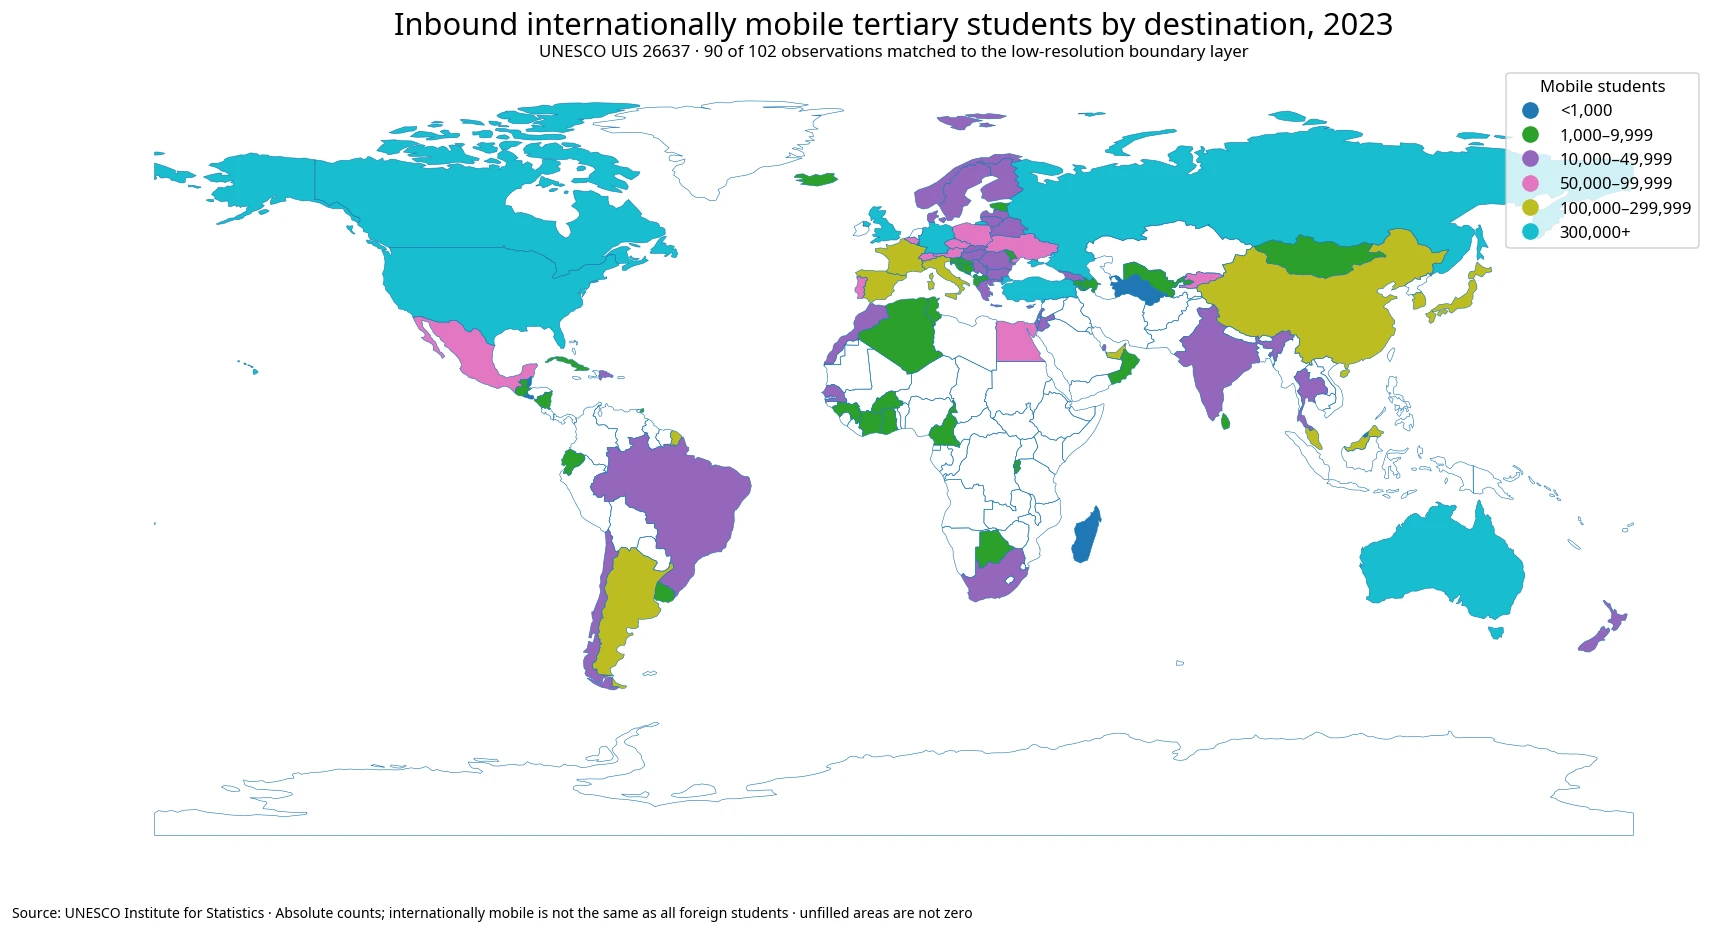
Table of Contents
Internationally mobile students are not simply all foreign citizens
UIS defines internationally mobile students as people who physically cross an international border for education and study in a destination country different from their country of origin. For tertiary education, the preferred origin criterion is the country where the student obtained the upper-secondary qualification used before tertiary entry.
If that prior-education criterion cannot be operationalised, usual or permanent residence may be used, with citizenship recommended only as a last-resort proxy. Internationally mobile student counts can therefore differ from statistics based only on foreign citizenship.
Physical movement is essential. A student who remains in the origin country while taking a distance-learning programme from a foreign institution is not internationally mobile under this definition. Foreign programmes delivered in the student’s country of origin also do not automatically constitute international student mobility.
The United States alone accounts for 14.0% of the observed sum
The United States represents 14.0% of the 102-observation sum. The United States, United Kingdom and Australia together account for 31.8%, the top five for 43.7% and the top ten for 63.5%.
| Rank | Destination | Mobile students in 2023 | Share of 102-row sum |
|---|---|---|---|
| 1 | United States | 956,923 | 14.0% |
| 2 | United Kingdom | 748,461 | 11.0% |
| 3 | Australia | 467,074 | 6.8% |
| 4 | Germany | 423,197 | 6.2% |
| 5 | Canada | 389,181 | 5.7% |
| 6 | Russian Federation | 336,453 | 4.9% |
| 7 | Türkiye | 301,634 | 4.4% |
| 8 | France | 276,217 | 4.0% |
| 9 | United Arab Emirates | 237,034 | 3.5% |
| 10 | China | 200,892 | 2.9% |
| 11 | Japan | 181,821 | 2.7% |
| 12 | Republic of Korea | 127,624 | 1.9% |
| 13 | Argentina | 126,566 | 1.9% |
| 14 | Malaysia | 109,036 | 1.6% |
| 15 | Italy | 106,450 | 1.6% |
The leading group is not limited to English-speaking systems. Germany, the Russian Federation, Türkiye, France, the United Arab Emirates, China and Japan all appear among the top eleven destinations.
The indicator describes where mobile students are enrolled, but it does not explain why they chose those destinations. Language, tuition, institutional scale, research opportunities, labour markets, migration rules and regional mobility can all matter, but indicator 26637 contains none of those causal variables.
The mean of 66,976 is far above the median of 13,869
The unweighted mean across 102 destinations is about 66,976 students, while the median is 13,869. The mean is roughly 4.8 times the median because the largest destination systems pull the arithmetic average sharply upward.
The first quartile is about 4,230 and the third quartile about 56,650. Sixteen observations are at or above 100,000 students, 28 are at or above 50,000 and 57 are at or above 10,000. At the other end, 11 are below 1,000 and 3 below 100.
That right-skewed distribution means the mean should not be presented as a typical destination size. The median and quartiles better describe the center, while concentration shares show how much of the observed total sits in a relatively small group of large host systems.
Absolute inbound counts are strongly influenced by the size of the tertiary system
Indicator 26637 is an absolute count. A country with a large tertiary sector and many institutions has more capacity to host large numbers of mobile students, while a small system can have a high international share with a much smaller headcount.
A large inbound count therefore does not automatically mean the country is more internationalised. Comparing internationalisation intensity requires a denominator such as total tertiary enrollment or an inbound mobility rate.
For example, 100,000 internationally mobile students can represent a modest share in a very large tertiary system but a very high share in a smaller one. Headcounts and rates answer different questions.
The largest destinations span several regions and education-market models
The United States, United Kingdom, Australia and Canada are major English-speaking destination systems, while Germany, France, Italy and Austria represent large European hosts. The Russian Federation and Türkiye also exceed 300,000, and China, Japan, Malaysia and the Republic of Korea are substantial Asian destinations.
This geography should not be reduced to a simple preference ranking. Tertiary system capacity, regional mobility, language, cost, border proximity, degree structure, scholarships and immigration arrangements can all shape the resulting counts.
The total-inbound series combines students from every reported origin. It therefore answers a different question from origin-specific destination series, such as where students from Canada, Japan or the Russian Federation study abroad.
One upper-middle destination example
The Republic of Korea records 127,624 internationally mobile students, ranks 12th among the 102 observations and represents about 1.9% of the observed sum. That headcount alone does not establish the international-student share of the country’s tertiary system.
Foreign-student and internationally mobile-student statistics should not be mixed
Foreign students are generally identified by citizenship in the destination country, whereas international mobility is based on physical movement and country of origin. The two populations can overlap substantially but are conceptually different.
A citizen of the destination country who previously completed upper-secondary education abroad and then crossed the border to enter tertiary education can meet the mobile-student concept. Conversely, a foreign citizen who has long lived and completed prior education in the destination country may be classified differently in mobility statistics.
Comparisons should therefore identify whether a source is based on citizenship, residence or country of prior education. UIS uses the mobility concept to capture educational movement rather than nationality alone.
The 102-observation sum is not automatically the complete world total
The 102 reported values add to about 6.83 million students. Because the extract does not include every possible destination, this sum is used only as the total of the observed set.
Countries absent from the extract are not assigned zero. Missing data and a measured zero are different states, and zero-filling would distort the distribution and concentration shares.
A complete global total requires a dedicated world aggregate or comprehensive coverage. The present dataset is strongest for same-year cross-country comparison among the 102 destinations with a 2023 observation.
Blank areas on the map do not mean zero mobile students
90 of the 102 observations match independent polygons in the low-resolution world boundary layer. The unmatched group includes small states, islands and separately reported areas such as Andorra, Bahrain, Bermuda, Hong Kong, Macao, Monaco, Malta, Mauritius, Singapore, San Marino and Samoa.
Those observations remain in the tables and all statistical calculations even when the boundary layer cannot show them independently. A missing polygon is a visualization limitation, not evidence of a zero value.
The map uses broad count bands because the largest destinations approach one million students while several observations are below one thousand. Banding prevents a handful of large hosts from compressing the rest of the map into one visual range.
A single 2023 cross-section compares scale, not growth or cause
All observations use the same 2023 reference year, which is useful for cross-country comparison. It avoids mixing one destination’s 2023 value with another destination’s substantially older value.
The cross-section cannot show whether the United States or United Kingdom gained students from the previous year, whether Australia was recovering, or which policies caused changes. Those questions require a time series.
Likewise, the count cannot identify the reasons students chose a destination. A causal analysis would require additional data on origin composition, tuition, scholarships, language, visa rules, labour-market access and institutional characteristics.
Data source and calculation method
Country values come from UNESCO Institute for Statistics indicator 26637, “Total inbound internationally mobile students, both sexes (number),” using the 2023 NATIONAL observations in this comparison. The generic internal unit label is clarified in the completed metadata as a student headcount.
- UNESCO UIS official API — indicator 26637
- UNESCO UIS Data Browser Glossary — internationally mobile students
The observed sum of about 6,831,515, mean of 66,976, median of 13,869, quartiles and destination concentration shares are calculated directly from the 102 non-missing observations. Missing destinations are not zero-filled, foreign-citizenship counts are not substituted for mobility counts, and the map shows the 90 observations that match the low-resolution boundary layer while all 102 remain in the statistics.
The strongest conclusion supported by the dataset is that inbound internationally mobile tertiary students were concentrated in a relatively small set of large destination systems in 2023. International-student shares, growth rates, student motivations and education outcomes require additional indicators.
Frequently Asked Questions
Are internationally mobile students the same as all foreign-citizen students?
Not necessarily. UIS defines mobility around physical cross-border movement and country of origin, preferably based on prior upper-secondary education for tertiary students.
Is the U.S. value of about 956,923 the same as every foreign student in U.S. higher education?
It is the 2023 UIS count under the internationally mobile student definition. Citizenship-based foreign-student statistics can differ.
Is the sum across 102 destinations the complete world total?
Not necessarily. It is the sum of the 102 observations in this extract. Destinations without an observation are not treated as zero.
Does a larger inbound count mean a more internationalised tertiary system?
Not by itself. Tertiary systems differ in size, so internationalisation intensity requires a denominator such as total tertiary enrollment or an inbound mobility rate.
Related Articles
- Russian Student Destinations in 2023 | 70 Reported Destinations
- Canada-Origin Mobile Tertiary Students 2023 | Top 3 Destinations 80.1%
- Top Destinations for Internationally Mobile Students from Japan | 2020
Green Map creates custom-edited map images using open geographic data sources such as geoBoundaries, Natural Earth, OpenStreetMap, and government open data.
These maps are edited visual materials, not raw data files, and are provided for education, documents, presentations, and graphic reference.