California was the clear leader in estimated total solar photovoltaic generation assigned to the U.S. commercial sector in 2024. In the EIA annual series identified by fueltypeid TPV, sectorid 96 (All Commercial), and the generation field, California reported 6,617.005 thousand MWh. New York followed at 2,477.141 thousand MWh and Massachusetts at 2,277.392. This article compares the common-year observations for the 50 states and the District of Columbia.
The metric identity matters because the automated discovery title used the phrase Utility Scale even though the verified facets describe estimated total solar PV in the commercial sector. The analysis therefore uses the TPV and sector 96 definition rather than relabeling the values as utility-scale solar. All 51 jurisdictions have reported positive values, so no missing observation or zero replacement is needed.
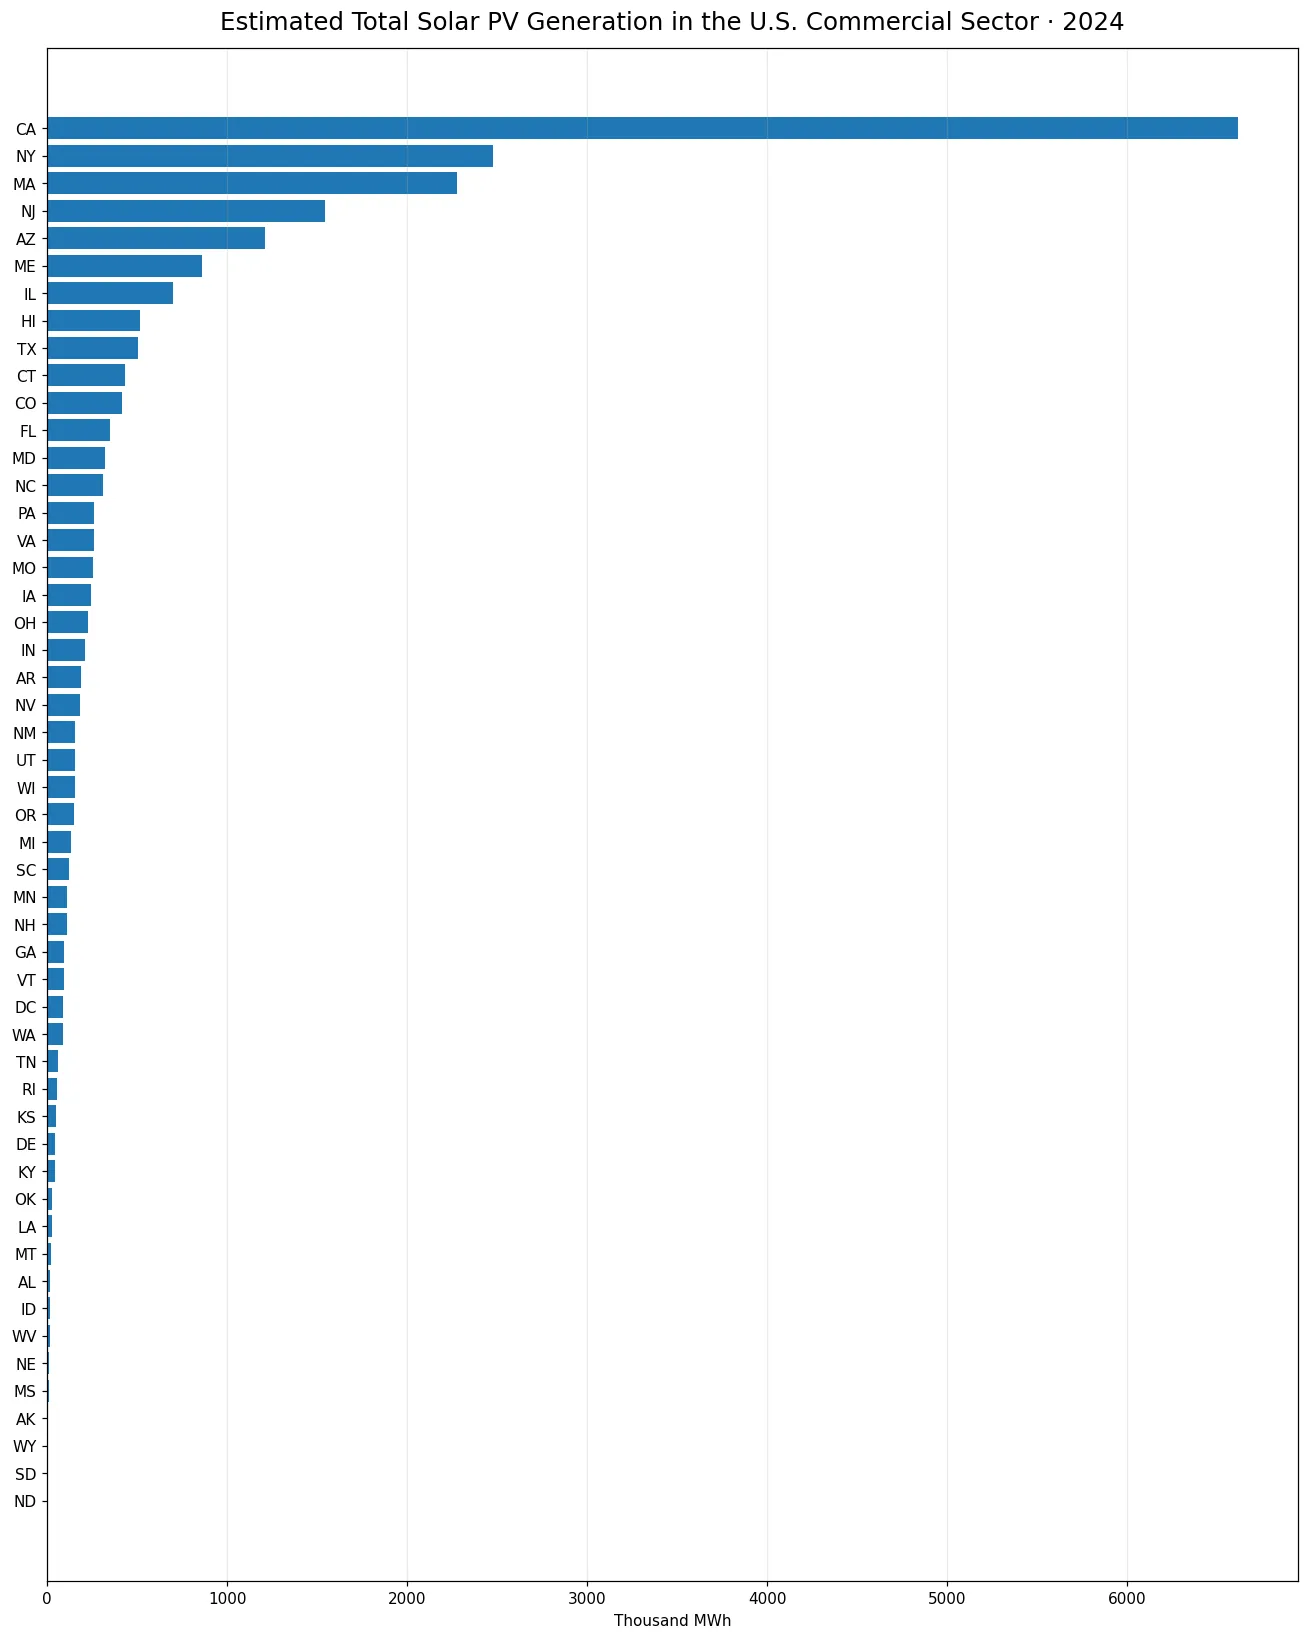
Table of Contents
California alone represented 29.78% of the 51-observation sum
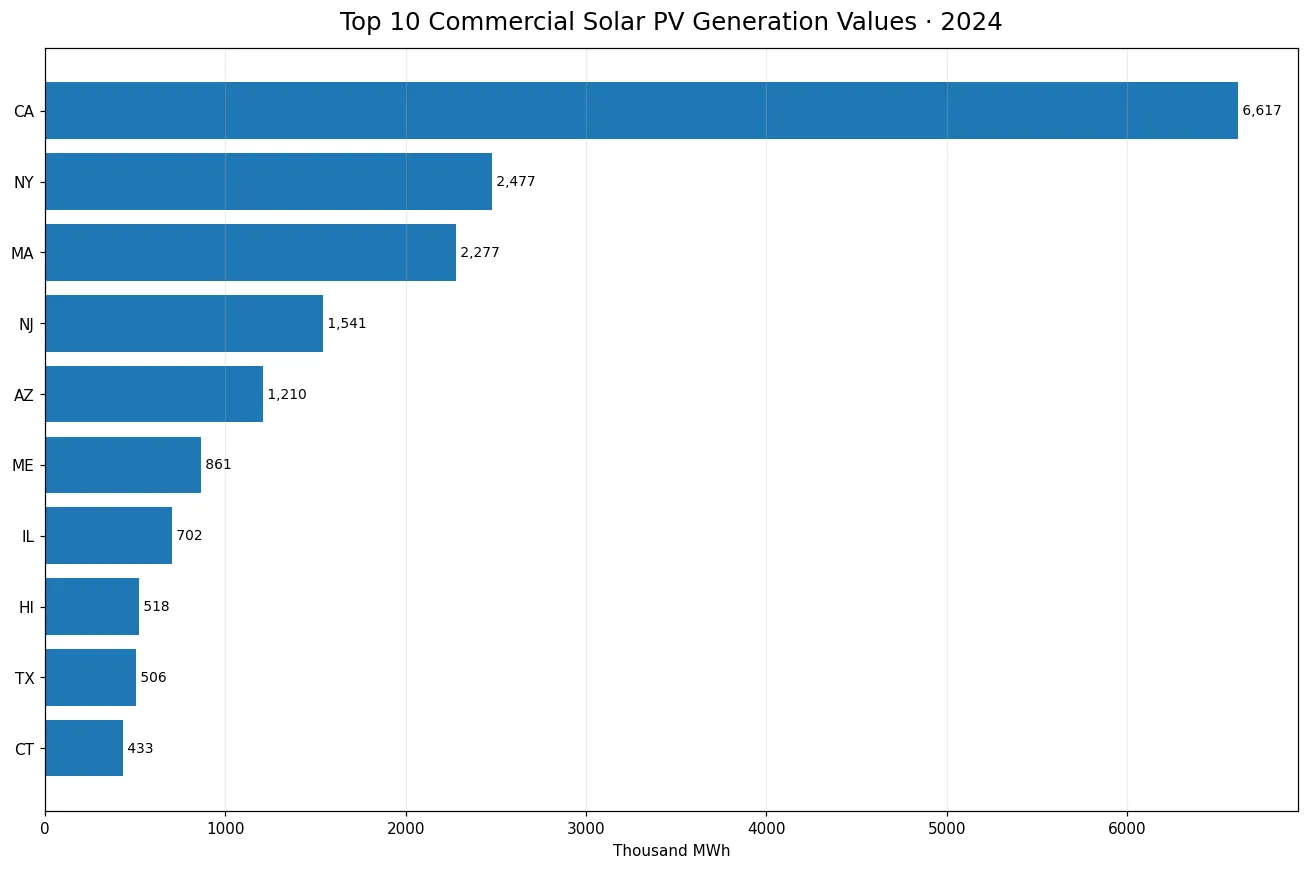
California recorded 6,617.005 thousand MWh of estimated total solar photovoltaic generation assigned to the commercial sector in 2024. New York followed with 2,477.141 thousand MWh and Massachusetts with 2,277.392 thousand MWh. Adding all 50 states and the District of Columbia gives 22,218.201 thousand MWh, so California accounted for 29.78% of that state-level sum. The gap between first and second place was about 4,139.864 thousand MWh, showing how strongly the distribution is shaped by the leading state rather than by an even spread across jurisdictions.
Because California is so large relative to the rest, a single full-range chart compresses differences among many middle and lower states. Reading the full chart together with the top-ten view helps preserve both perspectives: the national distribution is highly concentrated at the top, yet there is still meaningful variation among states below the leaders. The same unit therefore spans very different scales across the ranking.
The top three jurisdictions crossed the halfway mark
California, New York, and Massachusetts together contributed 11,371.538 thousand MWh, equal to 51.18% of the 51-jurisdiction sum. Expanding the group to the top five raises the share to 63.56%, while the top ten reach 77.16%. New Jersey reported 1,541.220 thousand MWh and Arizona 1,210.105 thousand MWh, placing both above the one-million-MWh threshold when expressed in actual MWh. The ranking therefore has a steep upper tier, followed by a broad group of states with much smaller annual values.
West and Northeast states dominated the broad regional totals
Using the four broad Census-region groupings as a descriptive aid, western jurisdictions summed to 9,529.512 thousand MWh, or 42.89% of the state-level total. The Northeast contributed 8,113.488 thousand MWh, or 36.52%. Together those two regions represented about 79.41%. The South accounted for 11.15% and the Midwest for 9.45%. These regional aggregates are useful for seeing spatial concentration, but they do not by themselves establish why commercial solar generation differs among states.
The regional totals themselves are also concentrated internally. California and Arizona account for much of the western amount, while New York, Massachusetts, and New Jersey dominate the Northeast total. A regional label should therefore not be treated as a single homogeneous market. It is a summary lens, not an explanation of state policy, commercial building stock, installation economics, or system design.
A wide mean-median gap signals a skewed distribution
The average across the 51 observations was 435.651 thousand MWh, whereas the median was only 148.837 thousand MWh. That large gap is consistent with a right-skewed distribution in which a few very large values lift the mean. The first quartile was 41.588 thousand MWh and the third quartile was 313.625 thousand MWh. California’s value was more than forty times the median. For readers trying to understand a typical state rather than the national leaders, the median and quartiles give a more representative picture than the arithmetic mean alone.
Only five jurisdictions exceeded 1,000 thousand MWh
Five jurisdictions exceeded 1,000 thousand MWh: California, New York, Massachusetts, New Jersey, and Arizona. Nine were at or above 500 thousand MWh, and 17 reached at least 250 thousand MWh. At the other end, 21 jurisdictions remained below 100 thousand MWh. These thresholds help reveal the shape of the distribution without treating every small numerical difference as meaningful. The top-ten chart makes the upper concentration especially clear, while the full-state chart shows how quickly values fall after the leaders.
What the TPV and sector 96 combination actually measures
The EIA identity behind this comparison uses fueltypeid TPV, sectorid 96, and the generation field. TPV stands for Estimated Total Solar Photovoltaic, while sector 96 is All Commercial. The figures therefore describe estimated total solar PV generation attributed to the commercial sector. They should not be relabeled as total U.S. solar generation, installed solar capacity, or utility-scale generation. The unit is thousand megawatthours, so the values represent annual electricity generation rather than capacity, installations, customers, or fuel consumption.
The words estimated total are important. They indicate the specific EIA TPV series rather than a generic label for every solar installation. Similar EIA pages can contain utility-scale, residential, commercial, industrial, or other sector slices that look closely related in title. The facet combination is what determines the statistical meaning of the number.
Commercial-sector solar is not the same series as utility-scale solar
The automated discovery title included the phrase Utility Scale, but the verified facets point to estimated total solar PV in the commercial sector. EIA also publishes separate utility-scale solar series with different fuel and sector identities. A state can rank highly in both categories, but the observations are not interchangeable. Keeping the series identities separate matters for duplicate control as well as interpretation: this article is about the commercial-sector TPV slice, not a second presentation of the utility-scale solar dataset.
Every jurisdiction had a positive reported value
All 51 jurisdictions had positive 2024 observations. North Dakota was lowest at 1.411 thousand MWh, followed by South Dakota at 2.558, Wyoming at 3.448, and Alaska at 6.299 thousand MWh. None of these low values should be treated as missing data. The distinction matters visually because a very small positive number may appear close to zero on a chart even though EIA reported a valid observation. No missing value was filled or converted to zero for this comparison.
Shares in this article are calculated within the 51 observations
Percentages such as California’s 29.78% and the top-ten share of 77.16% are descriptive calculations based on the sum of these 51 state-level observations. They are not a separately published EIA market-share series. The denominator does not include other years, other sector codes, or other solar series. As a result, these percentages should not be read as shares of national solar capacity, national solar installations, or all forms of U.S. solar electricity generation.
The 2024 pattern is best read as concentration plus regional contrast
The main feature of the 2024 distribution is not simply that California ranked first. It is the combination of one exceptionally large state, several substantial northeastern states, and a long tail of comparatively small observations. New York, Massachusetts, and New Jersey collectively prevent the upper tier from being a purely western phenomenon, while the median of 148.837 thousand MWh shows how far the typical jurisdiction sits below the leaders. Looking at concentration, regional grouping, and the mean-median gap together gives a fuller picture than a ranking alone.
For year-over-year analysis, the comparison should keep TPV, sector 96, the generation field, and the unit fixed. Changing any of those dimensions creates a different series even if the public title still contains the words solar generation. The 2024 cross-section is well suited to describing geographic concentration; explaining growth or policy effects requires additional years and separate evidence.
Frequently Asked Questions
Which state had the most estimated total commercial-sector solar PV generation in 2024?
California led with 6,617.005 thousand MWh, equal to 29.78% of the sum of the 51 state-level observations.
How concentrated was the 2024 distribution?
California, New York, and Massachusetts together represented 51.18% of the 51-jurisdiction sum, while the top ten reached 77.16%.
Is this the same as utility-scale solar generation?
No. The verified EIA facets are TPV (Estimated Total Solar Photovoltaic) and sector 96 (All Commercial), so this is the commercial-sector TPV series.
Were any observations missing or zero?
No. All 50 states and the District of Columbia had positive 2024 observations in this series.
Related Articles
Green Map creates custom-edited map images using open geographic data sources such as geoBoundaries, Natural Earth, OpenStreetMap, and government open data. These maps are edited visual materials, not raw data files, and are provided for education, documents, presentations, and graphic reference.