A country table of Bitcoin nodes can look like a simple ranking, but the metric needs a careful definition. In this dataset, a reachable node is a Bitcoin peer-to-peer endpoint that the BTC Nodes crawler could observe as reachable from the public network. It is not a count of Bitcoin owners, miners, wallets, exchange customers, or unique people. One operator can run several nodes, while other nodes may sit behind network configurations that do not accept inbound connections. The result is best treated as a snapshot of observable network infrastructure.
The verified extract used here contains 15 countries from a 2026 BTC Nodes snapshot collected at 09:08 UTC on 19 September 2026. Those 15 rows sum to 7,516 reachable nodes. That total must not be presented as the size of the entire Bitcoin network. BTC Nodes also tracks network types such as .onion and I2P, where a conventional country assignment is not necessarily available in the same way as a geolocated public IP. The percentages in this article therefore describe the composition of the 15 reported country rows only.
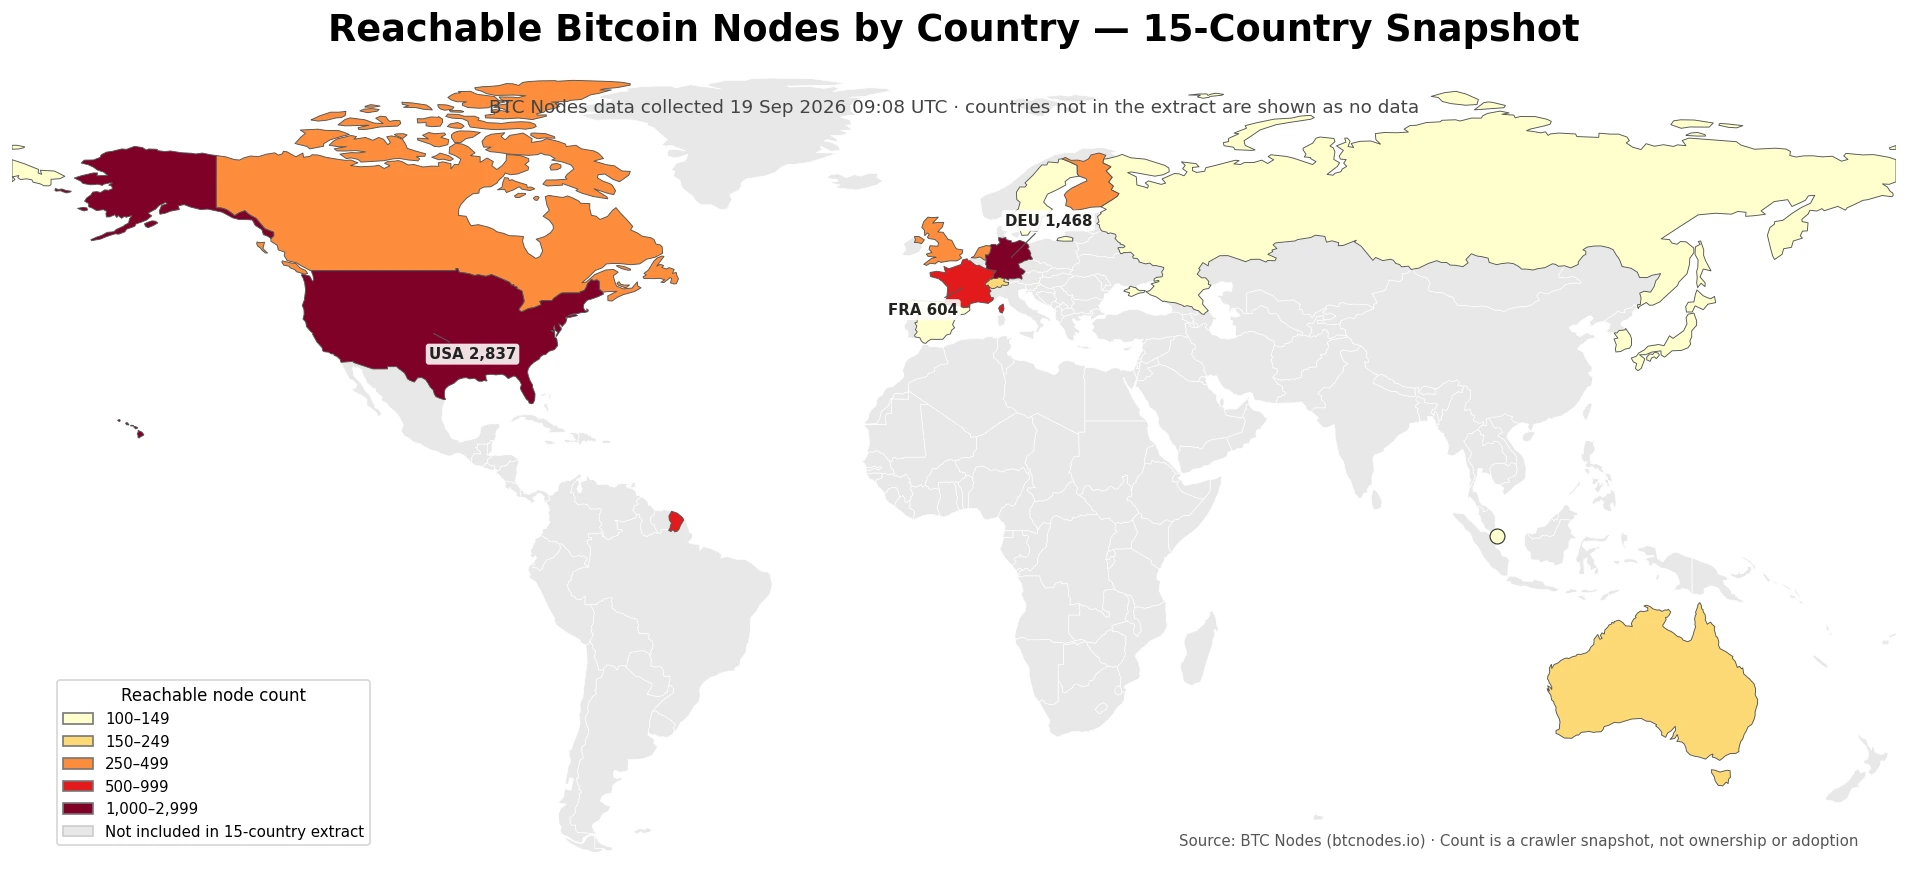
Table of Contents
The United States and Germany dominate the 15 reported country rows
The United States has 2,837 reachable nodes, or 37.7% of the 7,516-node total across the 15 listed countries. Germany follows with 1,468, equivalent to 19.5%. Together they account for 57.3% of the extract. Adding France, with 604 nodes, raises the top-three share to 65.3%. The concentration is therefore visible even before looking at the rest of the table.
The median country in the 15-row extract has 198 nodes, while the mean is 501.1. The large gap between the mean and median is a useful warning: the distribution is strongly pulled upward by the two largest observations. The top five countries account for 76.1% of the 15-country total, and the top ten account for 91.9%. For this kind of skewed snapshot, the median and concentration shares are more informative than the average alone.
| Rank | Country | Reachable nodes | Share of 15-country total |
|---|---|---|---|
| 1 | United States | 2,837 | 37.7% |
| 2 | Germany | 1,468 | 19.5% |
| 3 | France | 604 | 8.0% |
| 4 | Canada | 427 | 5.7% |
| 5 | Netherlands | 384 | 5.1% |
| 6 | Finland | 336 | 4.5% |
| 7 | United Kingdom | 320 | 4.3% |
| 8 | Switzerland | 198 | 2.6% |
| 9 | Australia | 191 | 2.5% |
| 10 | Singapore | 144 | 1.9% |
| 11 | Russia | 141 | 1.9% |
| 12 | Korea, Republic of | 126 | 1.7% |
| 13 | Japan | 123 | 1.6% |
| 14 | Spain | 112 | 1.5% |
| 15 | Sweden | 105 | 1.4% |
European countries occupy many of the reported positions
Germany, France, the Netherlands, Finland, the United Kingdom, Switzerland, Spain, and Sweden all appear in the 15-country extract. Germany is the clear second-largest observation, France is above 600, and the Netherlands, Finland, and the United Kingdom each exceed 300. The pattern shows that many publicly reachable endpoints in this extract are associated with North American and western or northern European locations. The dataset, however, does not establish why. Hosting availability, operator preferences, network policy, cost, or other infrastructure factors would require separate evidence before they could be offered as causal explanations.
The Asia-Pacific entries include Australia with 191, Singapore with 144, Korea, Republic of with 126, and Japan with 123. These are raw node counts, not rates adjusted for population, internet users, servers, or economic size. A per-capita or per-internet-user comparison would be a different analysis and would require a second dataset with a clearly aligned reference date. Keeping the raw count separate avoids turning one infrastructure measure into a broader adoption claim.
What reachable-node counts can and cannot tell us
Reachable-node counts are useful for studying the visible entry points of the Bitcoin peer-to-peer network. A node that accepts connections can serve as a peer through which other nodes exchange blocks and transactions. A country breakdown can therefore show where these observable endpoints are geographically attributed at a particular moment. Repeated snapshots collected with the same method can also be used to study whether the visible footprint is changing over time.
The measure does not reveal how much Bitcoin people in a country own, how many people use it, how much trading takes place, how much mining hash power is present, or how important Bitcoin is to the local economy. Nor does one node equal one person or one physical computer in a simple way. Cloud infrastructure can host multiple instances, and household operators can run nodes from residential connections. Some peers may be reachable through privacy-preserving or overlay networks whose geographic location is not meaningfully represented by a country table. The safest interpretation is therefore “observable reachable network endpoints with a country attribution,” not “Bitcoin adoption.”
The timestamp matters more than it does for annual statistics
This is not a finalized annual indicator. Bitcoin nodes go online and offline, addresses can change, and a crawler discovers the network over time. BTC Nodes presents its figures as live snapshots, so values visible later on the same website can differ from the numbers preserved in this extract. Recording only “2026” would hide that volatility and make the table look more stable than it is. For reproducibility, the snapshot time should travel with the figures.
The map also treats missing coverage carefully. Countries outside the 15-row extract are shown in gray rather than assigned a value of zero. “Not listed in this extract” and “confirmed to have zero reachable nodes” are different statements. Filling missing countries with zero would create a visually complete world map at the cost of inventing data that the supplied country table does not contain.
Four checks make country comparisons safer
- Use values from the same snapshot. Node availability can change over short periods, so mixing timestamps can distort a ranking.
- Distinguish geolocated country rows from network endpoints whose location is unavailable or not meaningful in a conventional IP geography.
- Do not confuse raw counts with density. A per-capita ranking would require population or internet-user denominators from a matched period.
- Do not infer ownership, investment interest, mining activity, or adoption from reachable-node counts alone. Those questions require different datasets.
The main signal in this snapshot is concentration, not global market share
Within the 15 reported country rows, the distribution is highly concentrated: the United States and Germany together account for 57.3%, while the top five account for 76.1%. The median is only 198 nodes, far below the two leading observations. Those numbers describe the shape of the supplied country table well. They do not show each country’s share of every reachable Bitcoin node worldwide because the extract does not assign every network endpoint to a country.
The primary source is BTC Nodes, maintained by Rodrigo Martínez. The service publishes live information about reachable nodes as well as network types, user agents, service flags, hosting, and ports. The map and table in this article are fixed to the verified 19 September 2026 country extract rather than silently replacing it with later live values. Readers checking the source at a later time should expect the current counts to have moved.
Frequently Asked Questions
What is a reachable Bitcoin node?
It is a Bitcoin peer-to-peer endpoint that a crawler can observe as reachable for network connections. It is not the same as a unique user, wallet, miner, or Bitcoin owner.
Is 7,516 the total number of reachable Bitcoin nodes worldwide?
No. It is the sum of the 15 country rows in this verified extract. Other network endpoints, including ones without a conventional country attribution, are outside that 15-row total.
Why are countries outside the 15 rows not shown as zero?
They are missing from this extract, not confirmed to have zero nodes. Treating missing coverage as zero would invent data and distort the map.
Can reachable-node counts be used as a Bitcoin adoption ranking?
No. They measure one aspect of observable network infrastructure. Adoption requires separate evidence about users, transactions, holdings, payments, or other behavior.
Related Articles
Green Map creates custom-edited map images using open geographic data sources such as geoBoundaries, Natural Earth, OpenStreetMap, and government open data.
These maps are edited visual materials, not raw data files, and are provided for education, documents, presentations, and graphic reference.