The Walker County Alabama Land Cover Map set gives a county-scale view of forest, agriculture, developed land, water, wetlands, and other surface classes in 2025. Forest is the dominant cover at 59.77%, but the county is not uniformly green: a broad developed concentration crosses the middle, agricultural patches are more frequent across the north and west, and smaller water and wetland features appear in several valleys and southern areas.
Four original JPG maps are available in one download: the general land-cover map, a forest-and-farmland view, an impervious-surface map, and a 1985–2025 change comparison. Each original JPG is 2480 × 1754 pixels. The maps are useful for county reference, classroom work, presentations, and preliminary environmental comparison, but they are generalized land-cover products rather than parcel, zoning, or survey maps.
Table of Contents
Walker County land cover in 2025
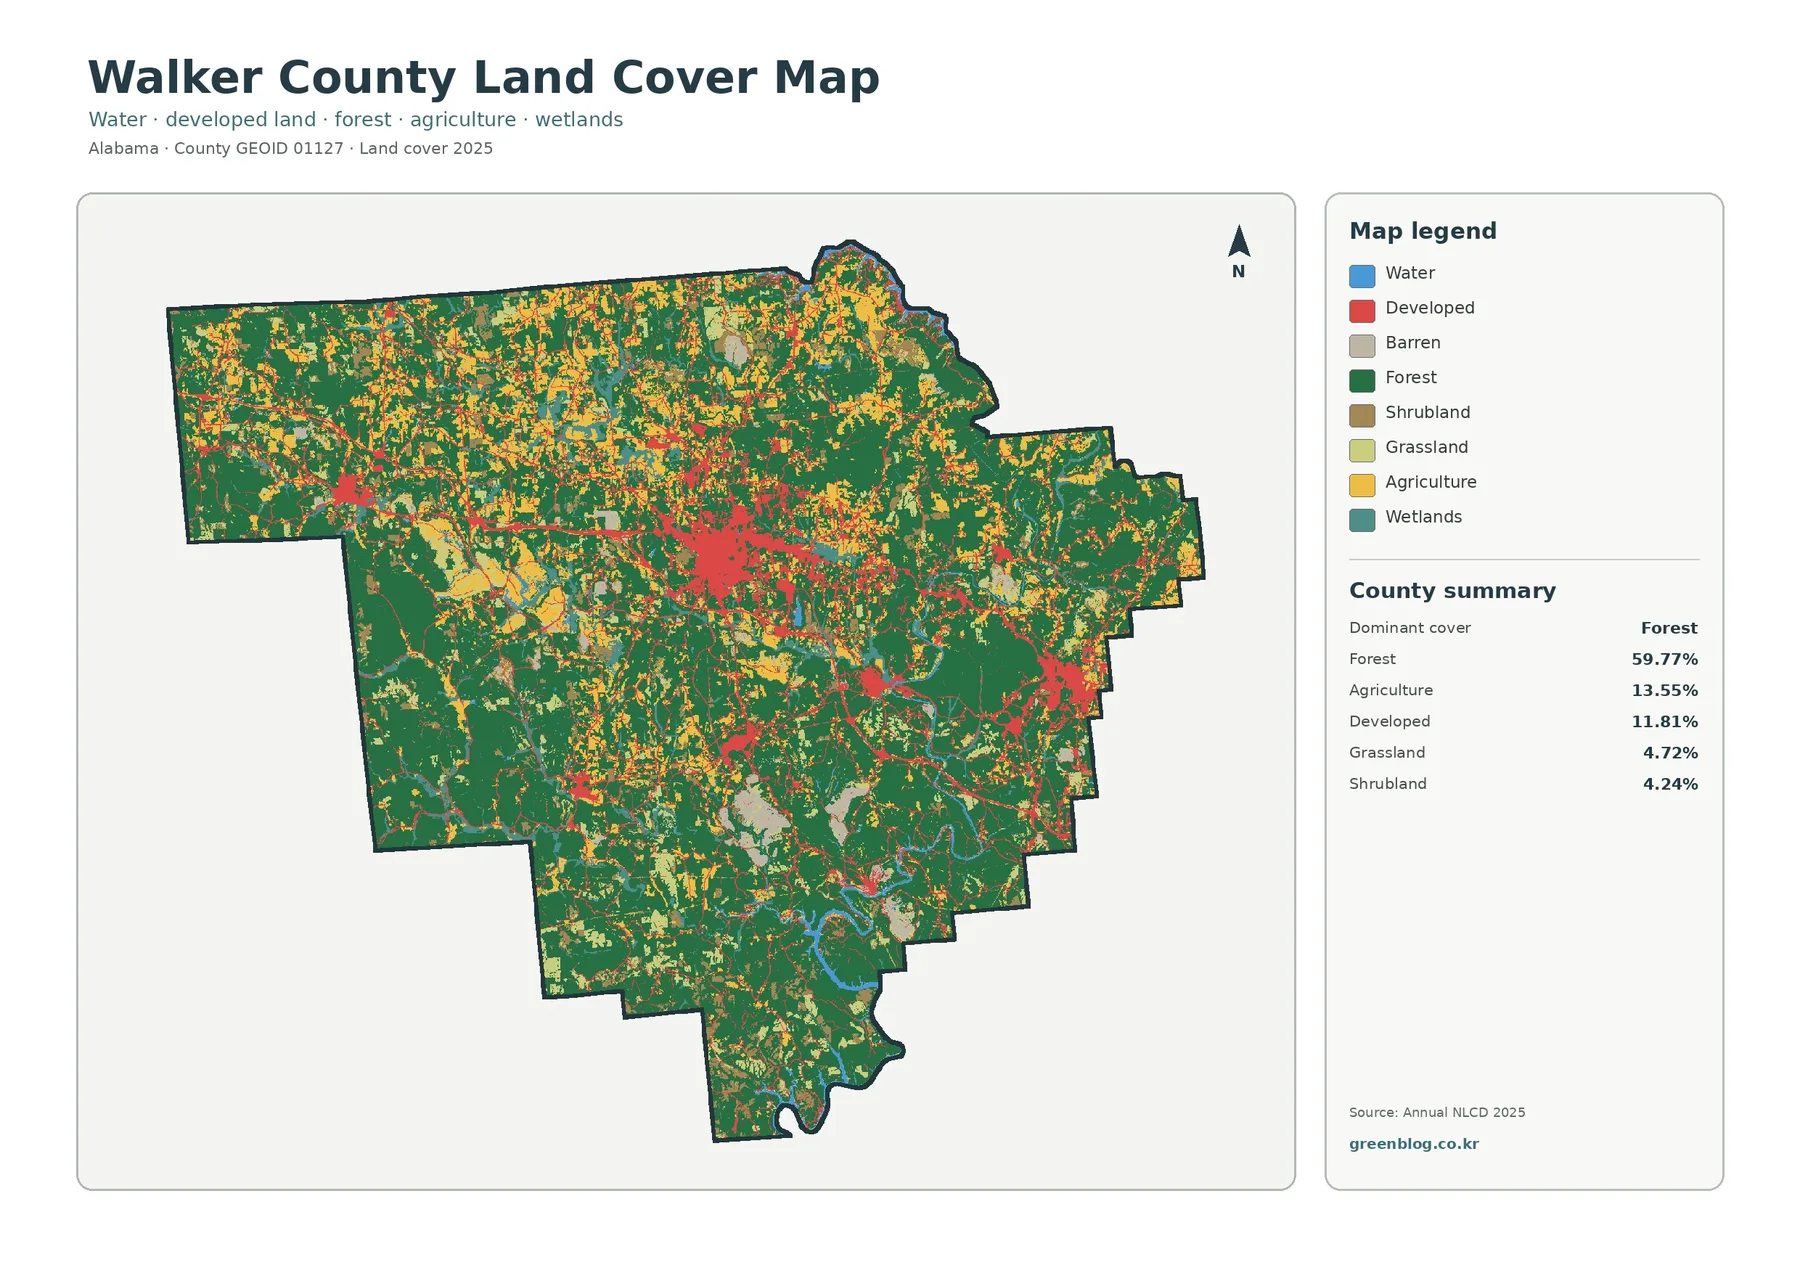
Forest covers well over half of the mapped county, giving the 2025 image its dominant dark-green appearance. Agriculture accounts for 13.55% and developed land for 11.81%. Grassland is listed at 4.72% and shrubland at 4.24%. These percentages help with the overall balance, while the map itself shows why countywide totals are only the first step: forest, farms, and development are arranged very differently from one part of Walker County to another.
The central portion contains the largest continuous cluster of developed pixels. From that area, narrower developed traces extend toward the west and east and continue southeast through the county. The western projection also contains a smaller developed cluster, while much of the southwest and northeast remains dominated by forest. This contrast makes the general map especially useful for seeing where the county’s developed surface is concentrated without losing the broader natural-cover context.
Agricultural color is more fragmented. It appears as many small and medium patches, with a particularly noticeable mix across the northwestern and northern parts of the county. In the south, forest occupies larger continuous areas and agricultural patches become less visually dominant. Water is limited in total area, yet a few blue features are easy to identify in the southern half. Wetland color follows smaller corridors and low areas rather than forming one large block.
Where impervious surfaces are concentrated
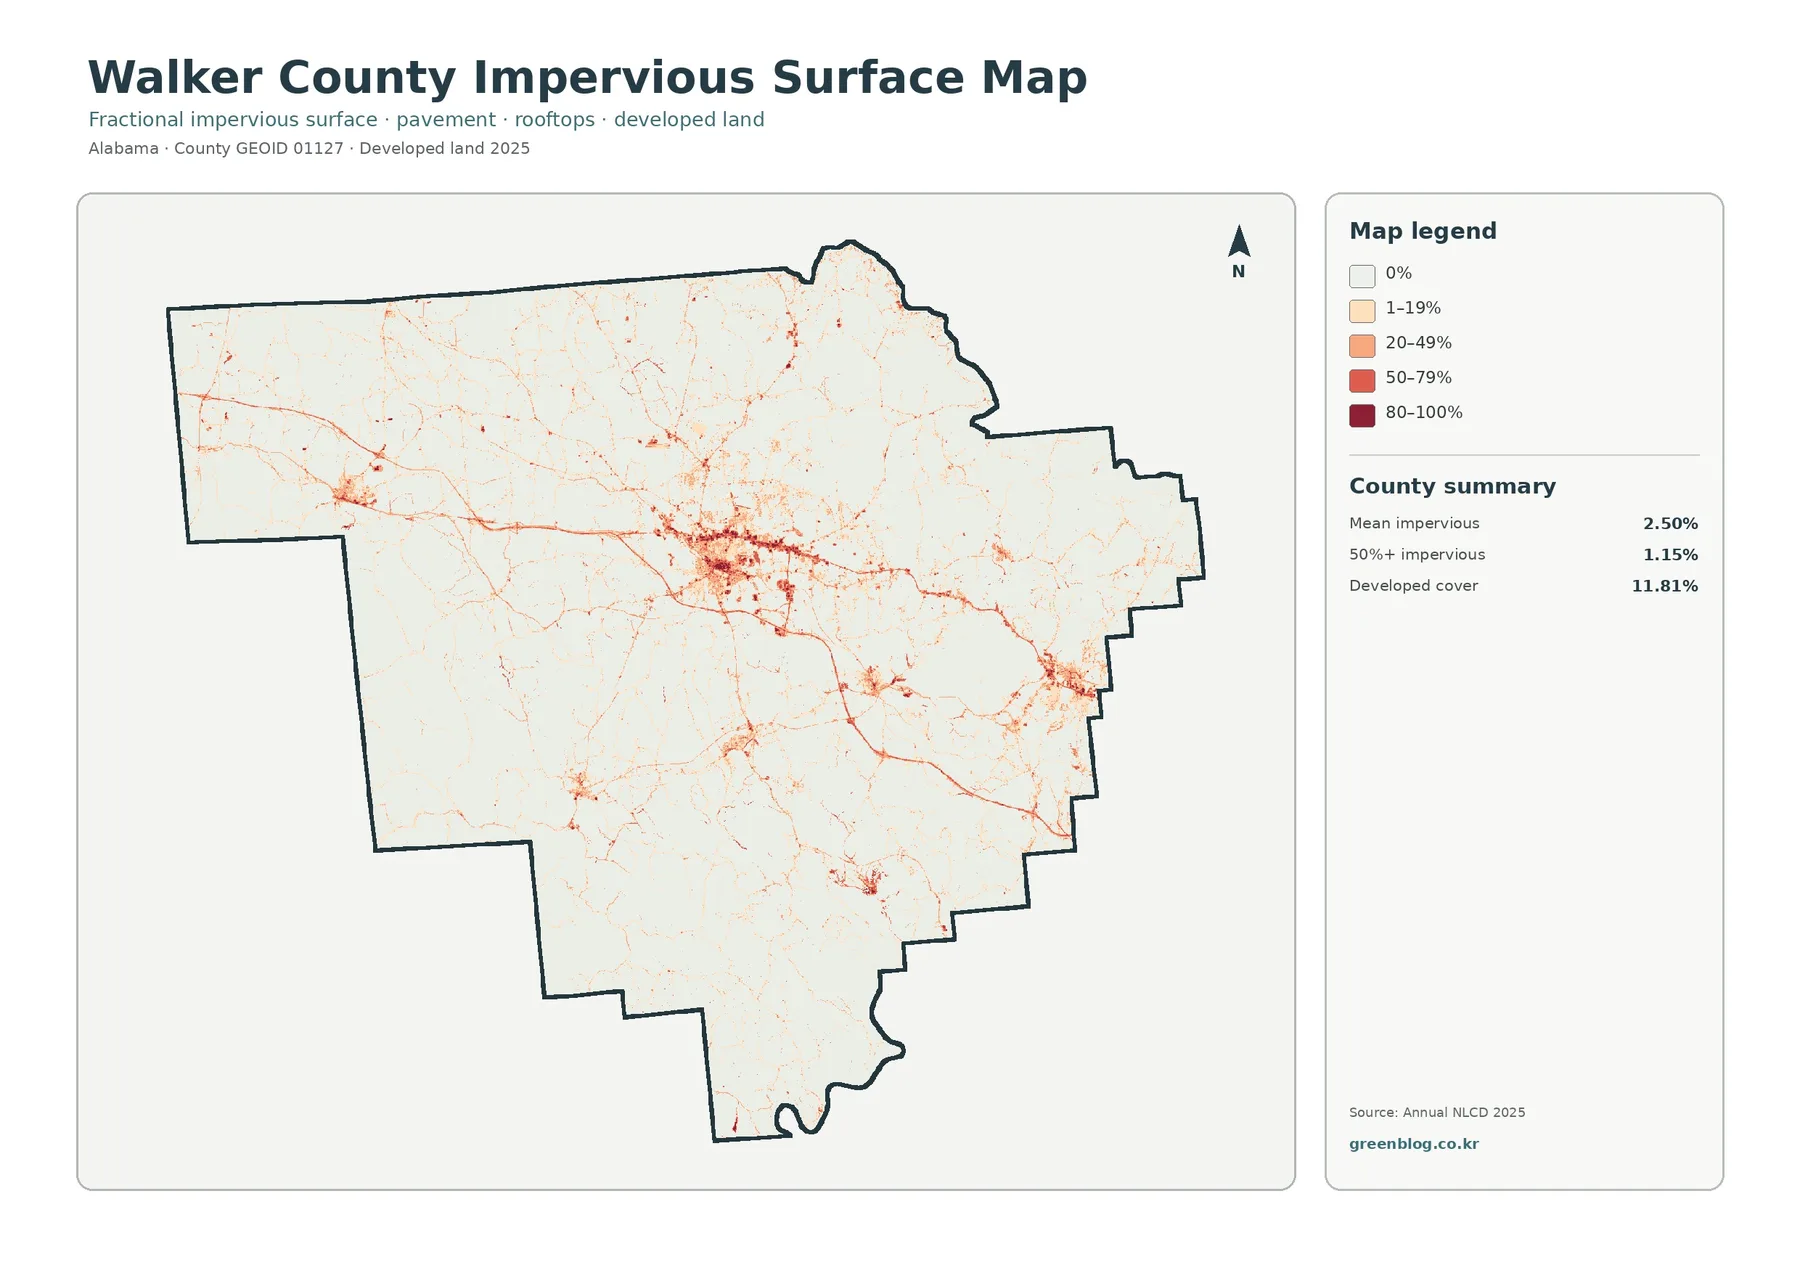
Impervious surface means pavement, rooftops, parking areas, and similar surfaces that do not readily absorb rainfall. Walker County’s mean impervious value is 2.50%, and 1.15% of the county is mapped at 50% or greater imperviousness. Those numbers are much lower than the 11.81% developed-cover share because the two products measure different things. A low-density developed cell may still contain substantial grass, trees, or bare ground even though it belongs to a developed land-cover class.
The darkest values form a clear concentration through the center of the county. Thin linear features radiate from that area and connect with smaller clusters to the west, southeast, and near the eastern boundary. Large parts of the southern tip, southwest, and northeast remain pale, showing that hard-surface coverage is low across most of the county even though developed land is visible in several distinct corridors.
Forest, farmland, water, and wetlands in a simpler view
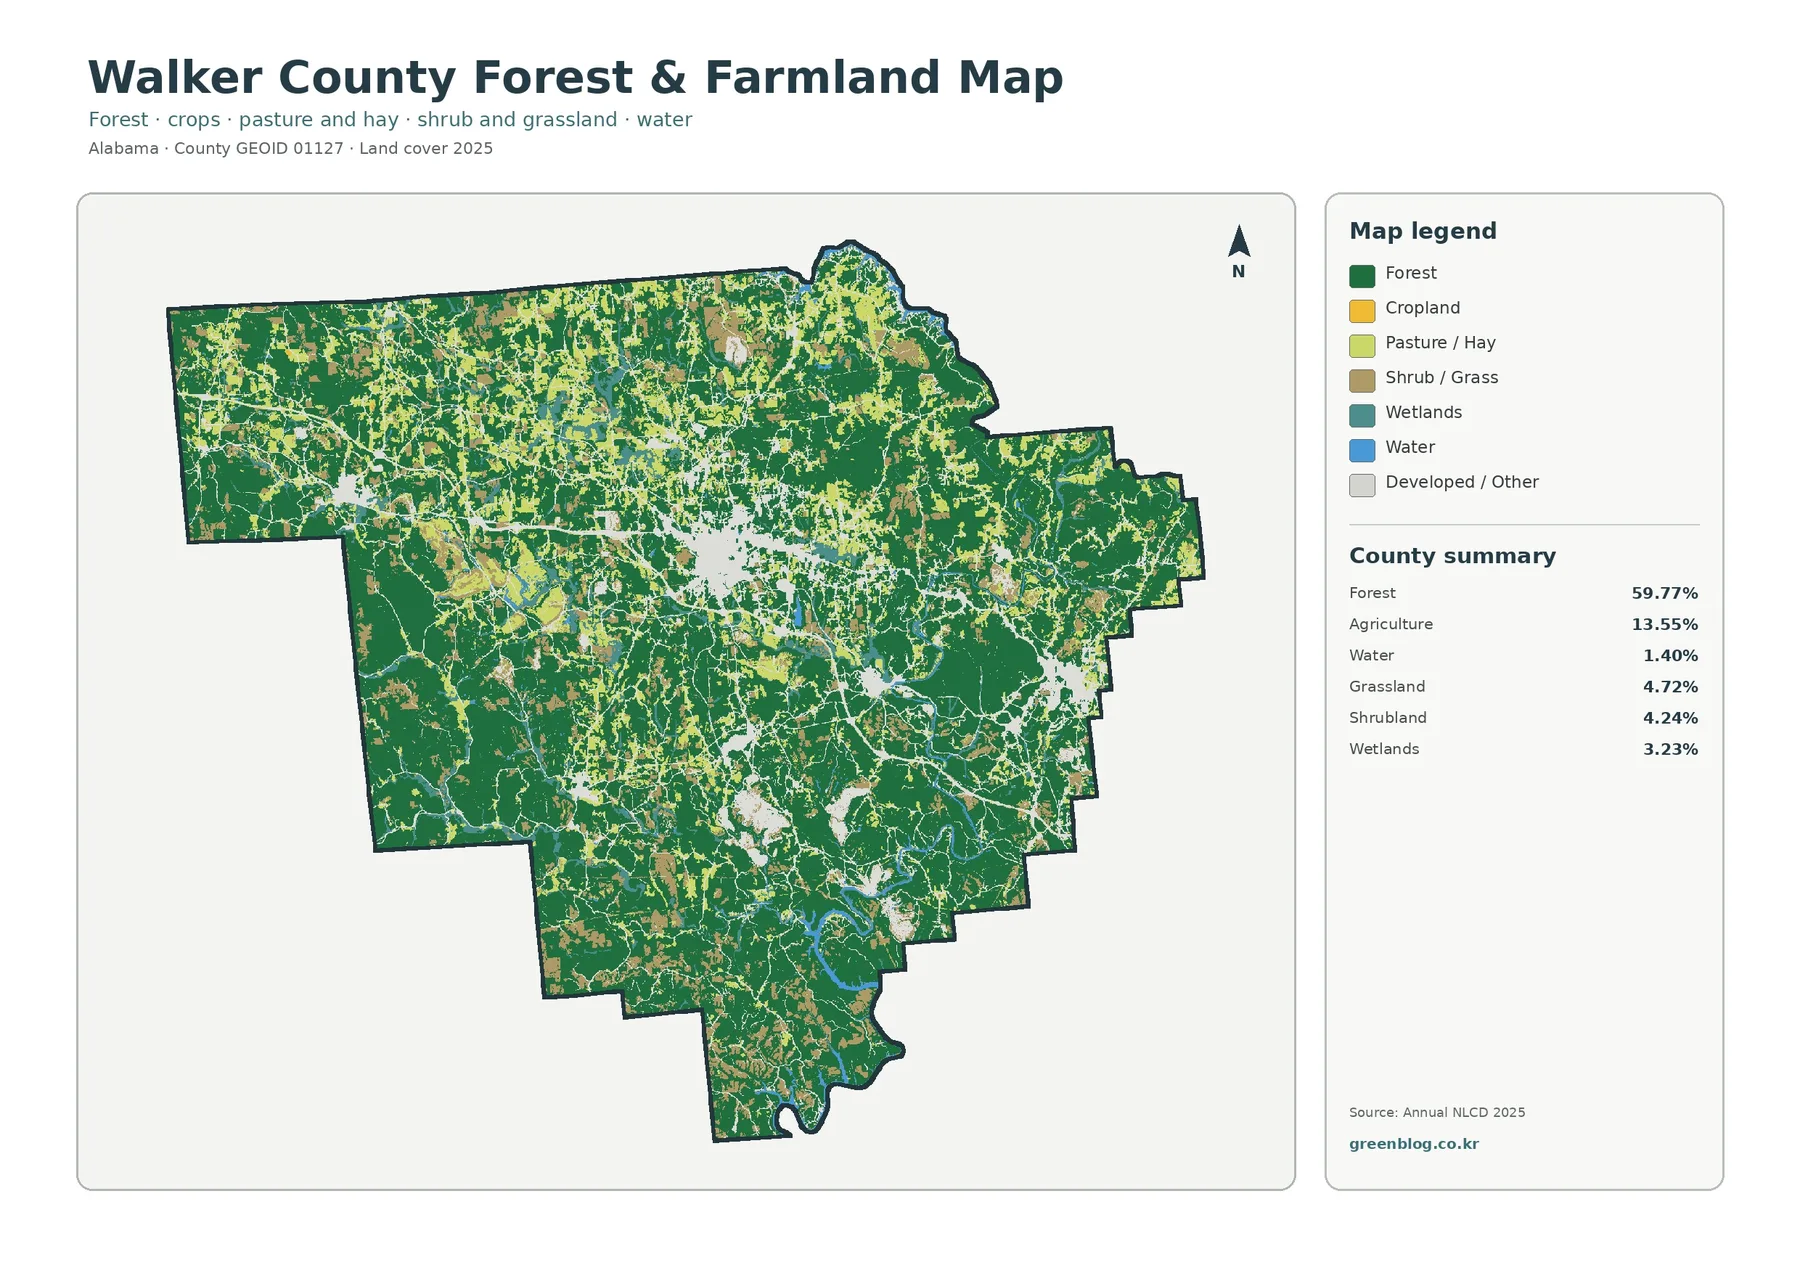
Removing much of the developed-class detail makes the relationship between forest and agricultural cover easier to see. Dark green remains the dominant color, especially across the southwest, southern section, and large parts of the east. Agricultural colors break that forest into smaller pieces across the north and northwest and appear in scattered pockets through the center. Developed and other surfaces are shown more neutrally, so the natural-cover pattern can be read without the red emphasis used on the general map.
The county summary adds water at 1.40% and wetlands at 3.23%. Neither category is large compared with forest, but their placement still matters. Blue water features and teal wetland areas appear along narrow channels and around several southern features. They should be treated as generalized land-cover classes, not as regulatory wetland boundaries, flood zones, or a complete inventory of streams and ponds.
What changed between 1985 and 2025
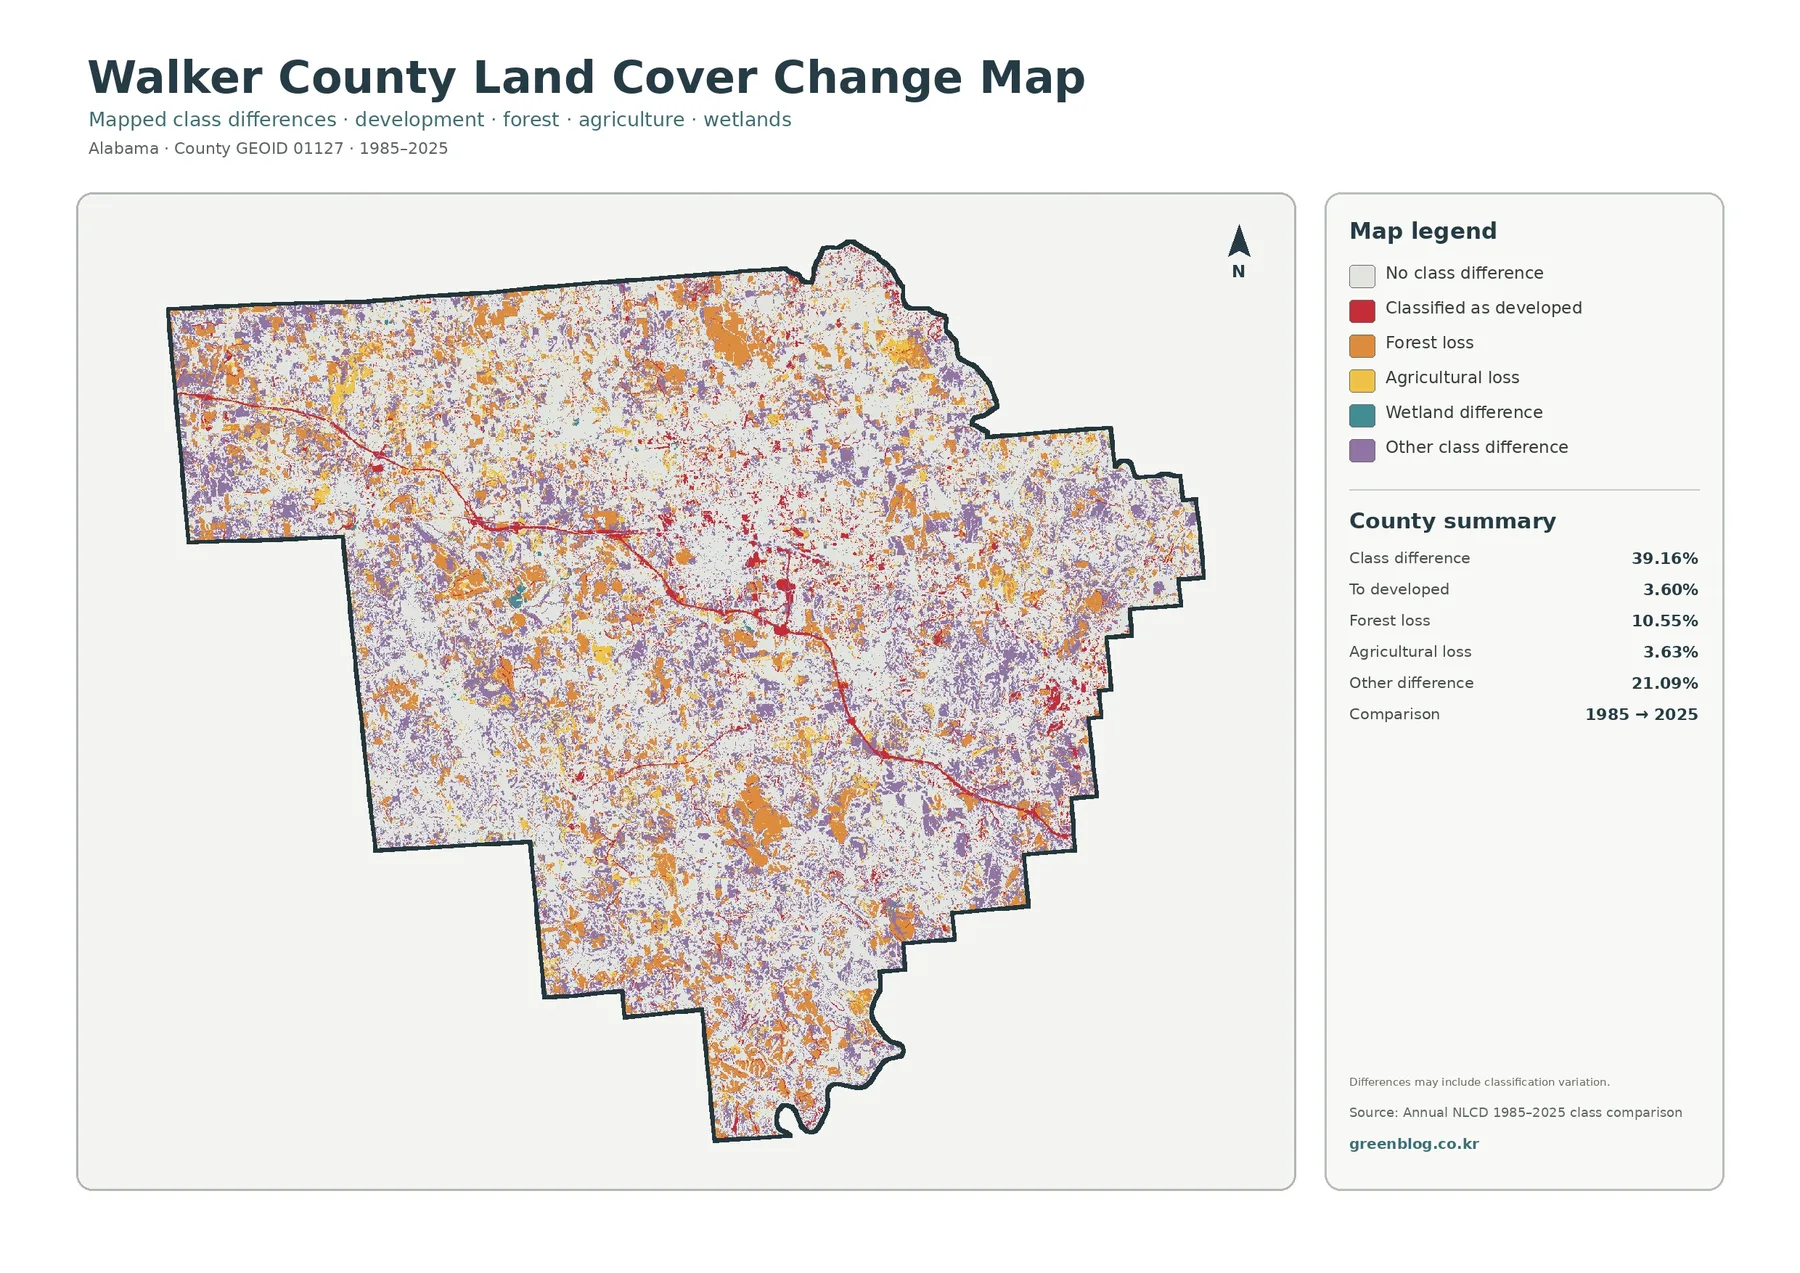
The largest number on the change map is 39.16% class difference. It is important not to read that as a 39.16% development rate. The map separately reports 3.60% converted to developed, 10.55% forest loss, 3.63% agricultural loss, and 21.09% other difference. Wetland difference is also a mapped legend category, but the summary does not provide a separate exact percentage for it.
Red development-change pixels appear frequently around the same broad central area that stands out on the current impervious map, with additional red traces along narrow corridors. Orange forest-loss pixels are much more widely scattered. They occur across northern, western, central, and southern areas instead of forming one single zone. Yellow agricultural-loss pixels and purple “other class difference” are intermixed across the county, which shows that the 40-year comparison contains several kinds of change rather than one dominant process.
The map itself notes that differences may include classification variation. That caveat is important because a changed raster cell is not automatically proof of a permanent physical conversion. Mixed pixels, classification methods, vegetation condition, and differences between observation years can influence the result. The comparison is best used to locate areas that deserve a closer look, not to assign a cause from color alone.
A practical sequence for reading all four maps
Start with the general land-cover map and identify the broad county pattern: forest is widespread, development is concentrated most strongly through the center, and agriculture is more fragmented. Then move to the impervious map to see which parts of the developed footprint actually contain the highest share of hard surface. This two-map comparison separates a land-cover category from the physical intensity of pavement and rooftops.
Useful applications and important limits
Annual NLCD is a raster classification, meaning the landscape is represented by a grid of cells. At the 30-meter scale used for this type of land-cover product, a cell can contain more than one real-world surface even though the map assigns it one class or one impervious value. Small streams, narrow roads, individual buildings, and tiny fields can therefore be simplified at county scale.
Because of that generalization, the map boundary between two colors should never be treated as a surveyed property line. The images do not provide ownership, zoning, permitting, engineering grades, or legal wetland determinations. They are strongest as visual reference maps for countywide patterns and as a guide to where more detailed data may be needed.
Download the four Walker County JPG maps
The downloadable Walker County Alabama Land Cover Map package contains the four original JPG images represented by the WebP previews on this page. The archive includes the general land-cover map, forest-and-farmland map, impervious/developed-land map, and 1985–2025 land-cover-change map. Each original image is 2480 × 1754 pixels.
Frequently Asked Questions
What is the largest land-cover class in Walker County?
Forest is the dominant 2025 class at 59.77%. Agriculture accounts for 13.55% and developed land for 11.81%, while grassland and shrubland are 4.72% and 4.24%. The map shows that those classes are not evenly distributed across the county.
Why is developed cover 11.81% when mean impervious surface is only 2.50%?
They describe different properties. Developed cover is a land-cover category, while impervious surface measures the share of hard materials such as pavement and rooftops. A developed cell can still contain vegetation or exposed soil, so its impervious percentage may be relatively low.
Does 39.16% class difference mean 39.16% of Walker County was developed?
No. The 39.16% figure combines several kinds of mapped differences between 1985 and 2025. Conversion to developed is listed separately at 3.60%. Forest loss, agricultural loss, wetland difference, and other class differences are separate categories within the comparison.
Can these maps be used for parcel boundaries or zoning decisions?
No. They are generalized raster land-cover maps intended for county-scale interpretation. Property boundaries, zoning, permits, engineering work, and legal wetland determinations require the appropriate current local or agency records.
Map File Information
Walker County Land Cover Map Files
- Included Files: Use only the versions confirmed in the article and supplied images
- File Type: Use the confirmed download contents
- Intended Use: Printing, education, presentations, and map-based projects
Related Maps
- Autauga County Alabama Land Cover Map
- Baldwin County Alabama Land Cover Map
- Barbour County Alabama Land Cover Map
Sources
- MRLC Annual NLCD Data — source access for annual land-cover and impervious products
- USGS Annual NLCD Land Cover Classification — definitions and interpretation of mapped land-cover classes
- U.S. Census Bureau TIGER/Line Shapefiles — county boundary reference
Green Map creates custom-edited map images using open geographic data sources such as geoBoundaries, Natural Earth, OpenStreetMap, and government open data.
These maps are edited visual materials, not raw data files, and are provided for education, documents, presentations, and graphic reference.