The Tuscaloosa County Alabama Land Cover Map set brings four different views of the county into one page: current land cover, forest and farmland, impervious surface, and mapped class differences from 1985 to 2025. Forest is the dominant 2025 cover at 55.15%, yet the large developed area near the center and the extensive wetland pattern make the county much more varied than a single percentage suggests.
The four original JPG maps are available together in one download farther down the page. They are useful for classroom work, presentations, broad environmental comparisons, and visual reference. These are generalized land-cover products, however, not parcel maps. They do not establish ownership, zoning, building rights, flood-zone status, or the condition of a specific property.
Table of Contents
What stands out across Tuscaloosa County in 2025
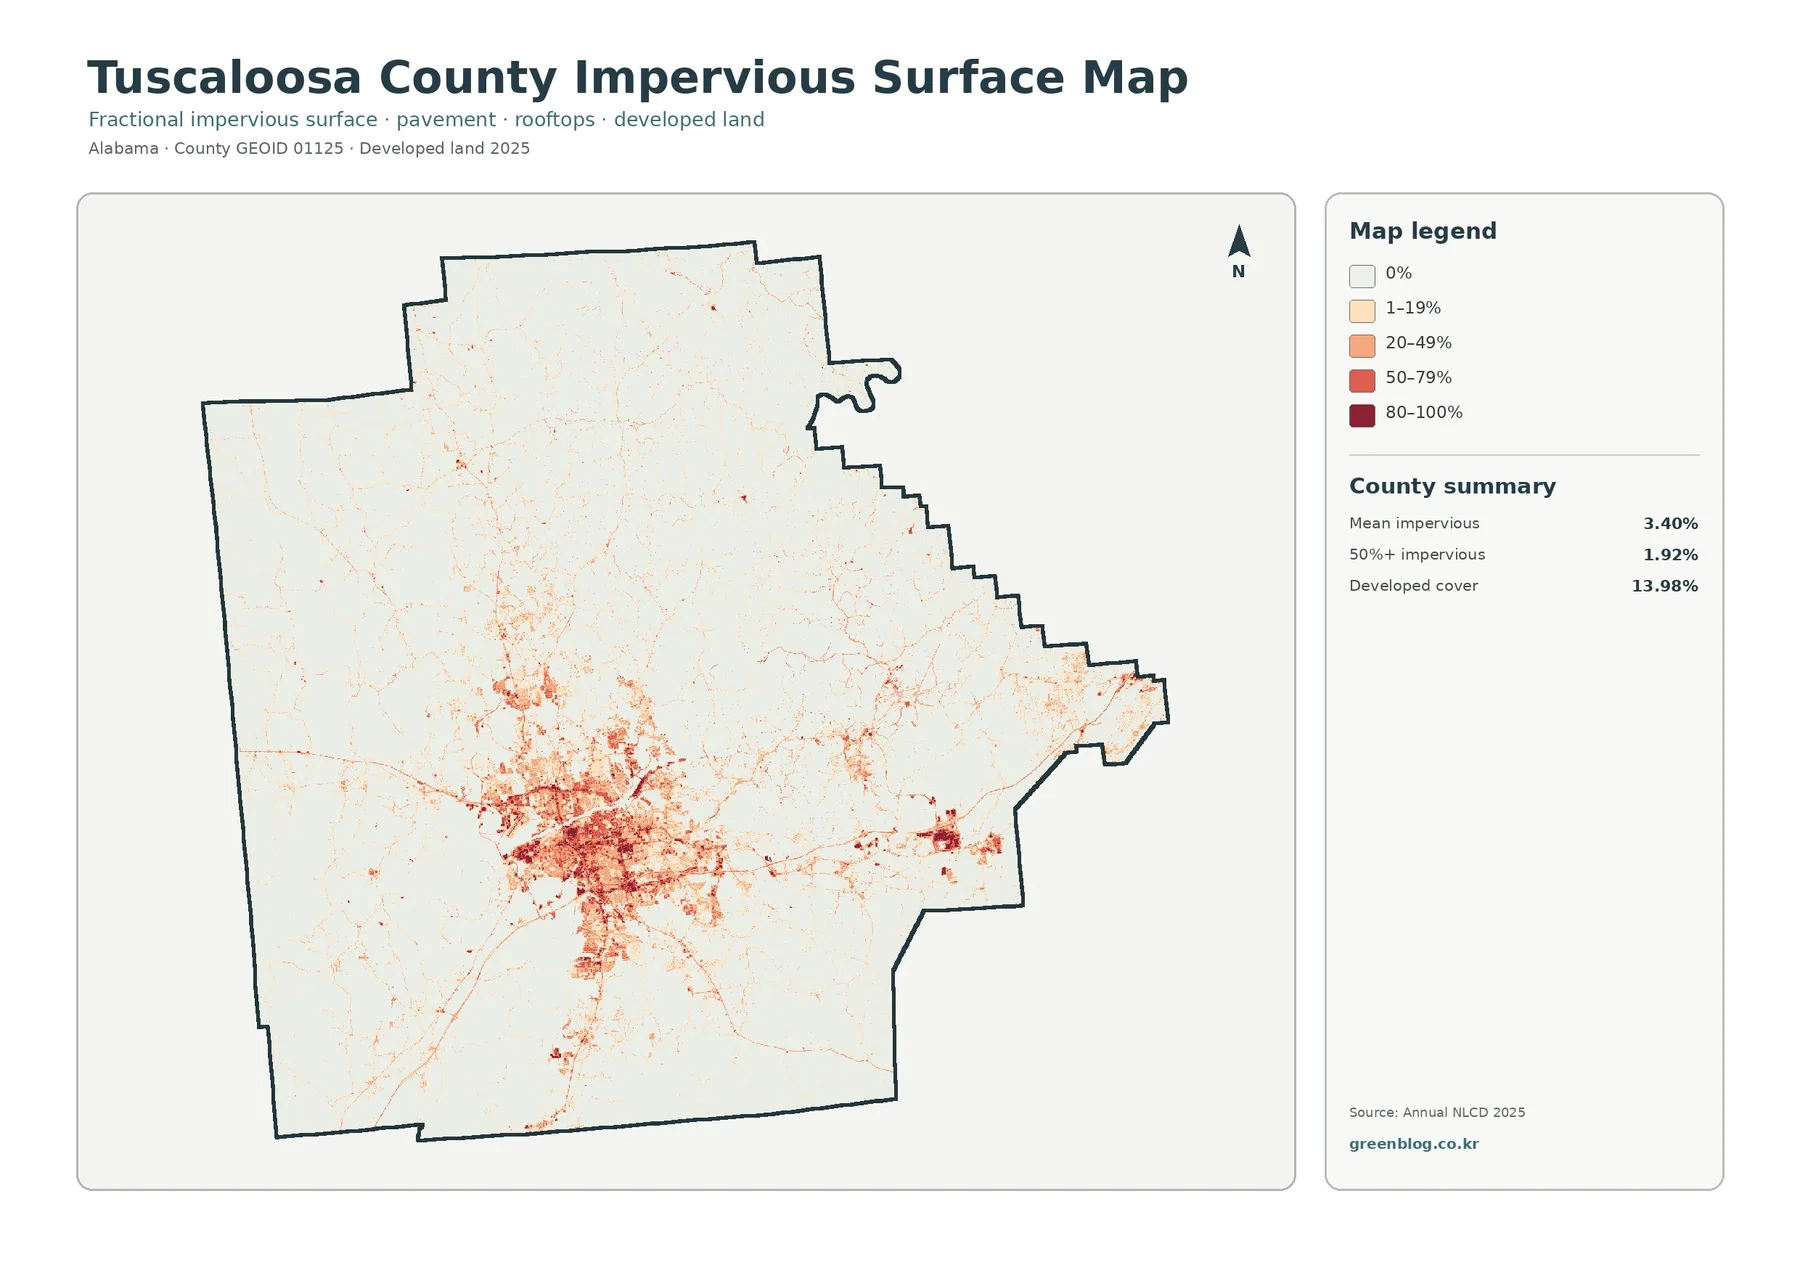
The county summary gives forest the largest share at 55.15%. Developed cover accounts for 13.98%, wetlands 12.02%, agriculture 8.42%, and shrubland 4.24%. Those numbers are helpful, but the map adds something the table cannot: location. The developed area forms a broad concentration near the center of the county, while forest becomes much more continuous toward the northern, eastern, and outer western portions. Wetlands and water break up both patterns, especially along the larger drainage features and across parts of the southwest.
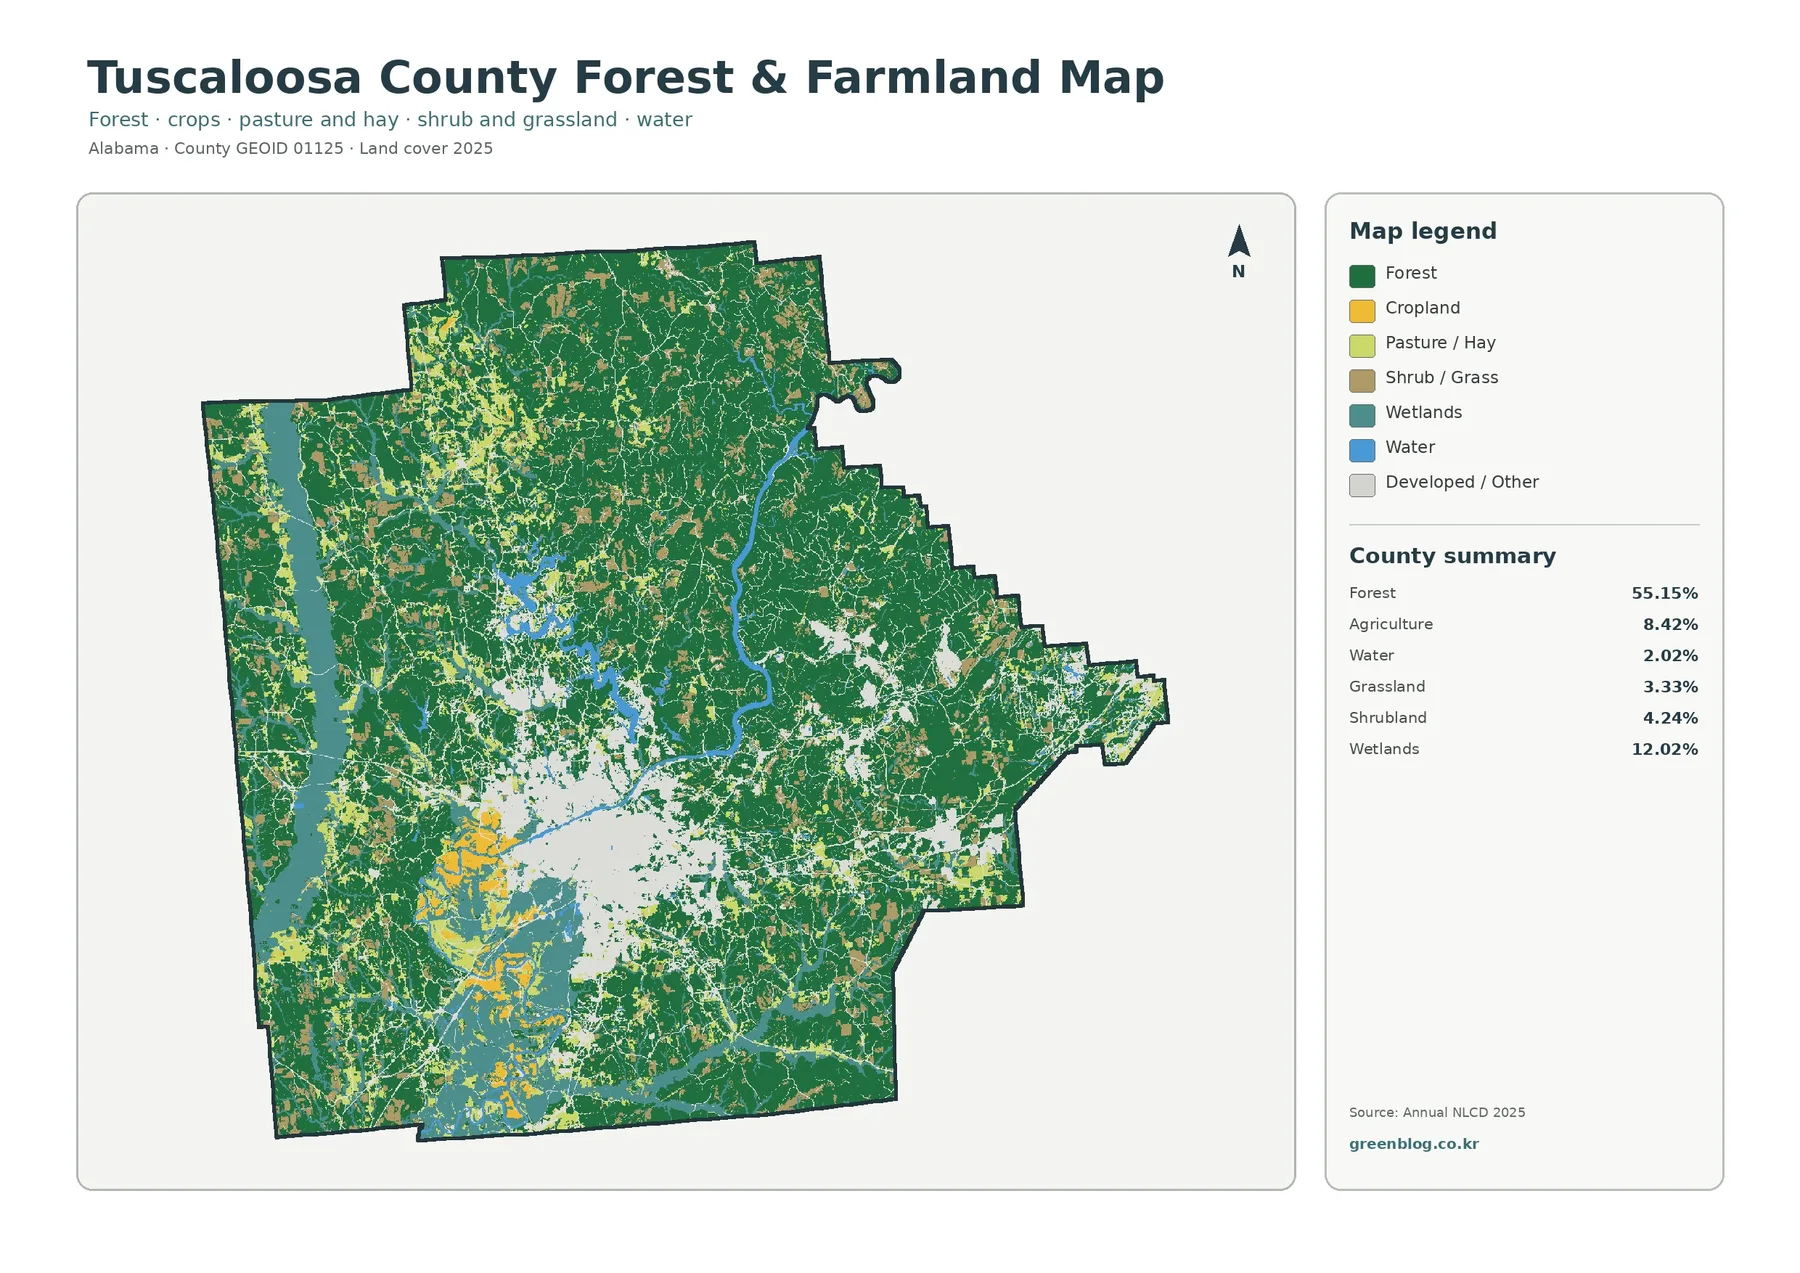
Agricultural cover does not form one countywide block. Yellow areas are more noticeable west and southwest of the central developed area, with smaller concentrations farther north and west. This produces a patchwork in which fields, pasture or other open agricultural cover sit between larger forest tracts. The pattern is useful when comparing the more urbanized middle of the county with the less developed outer areas, because the same legend applies everywhere even though the mix of classes changes substantially from place to place.
The impervious map separates the urban core from the county around it
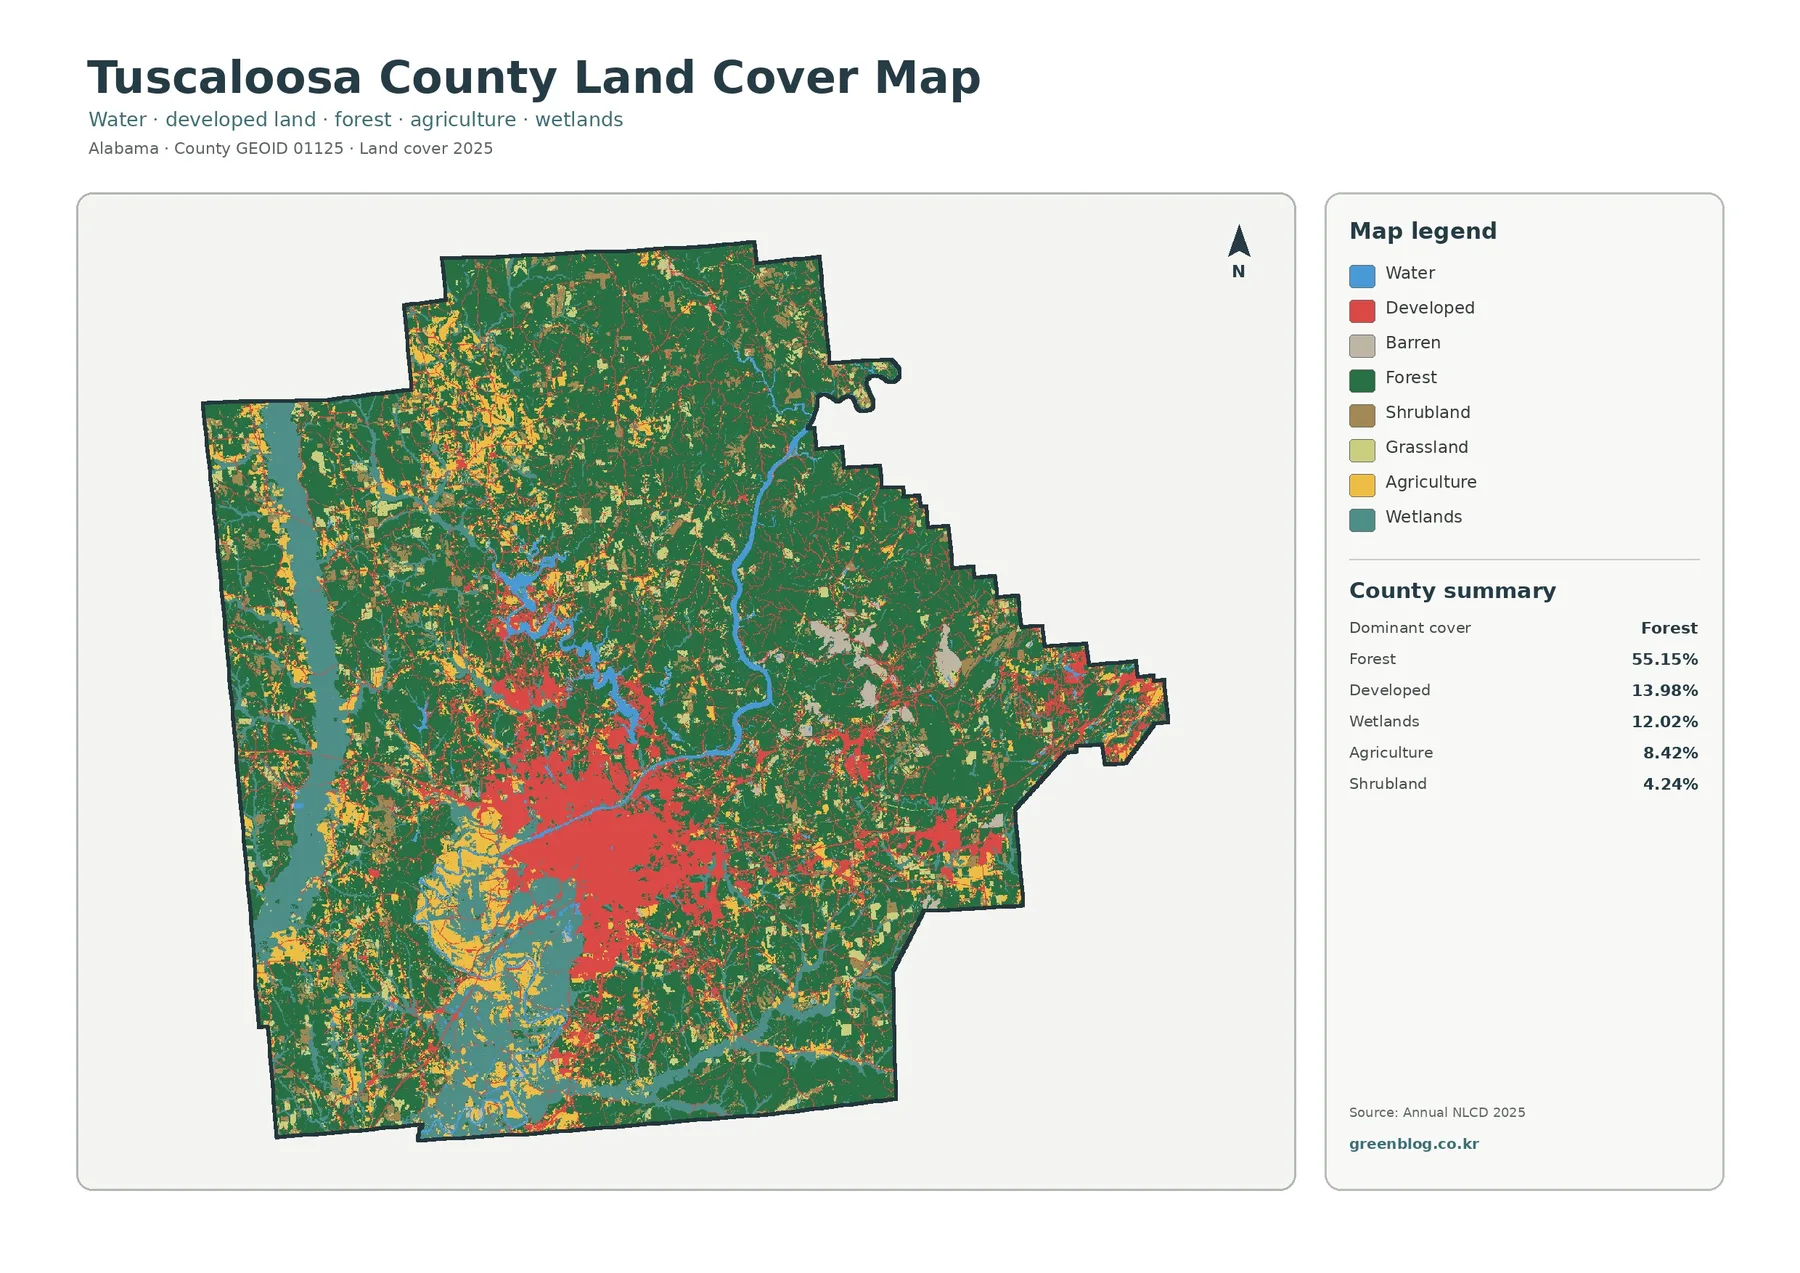
The impervious-surface view makes the central developed concentration easier to examine. Impervious surface means pavement, rooftops, parking areas, and similar surfaces that do not readily absorb rainfall. The countywide mean is 3.40%, while areas where a map cell is at least 50% impervious account for 1.92% of the county. Developed cover, by contrast, is 13.98%. These figures describe different things and should not be treated as interchangeable measures of urbanization.
Dark red and orange cells cluster most strongly around the central urban area. From there, thinner lines and smaller patches extend outward along transportation and settlement corridors. Another noticeable concentration appears toward the eastern projection of the county. Outside those areas, the map becomes much lighter, with only scattered lines and points. That transition is useful for showing how a relatively concentrated built-up area can sit within a county whose overall land-cover total is still dominated by forest.
Forest, farmland, wetlands, and water form a second pattern
Removing much of the developed detail makes the forest-and-farmland map easier to read as a landscape comparison. Forest remains broad and continuous across large parts of the north, east, and outer west. Agriculture occupies 8.42% of the county, but it becomes visually important in several western and southwestern areas because fields and pasture contrast strongly with the surrounding green forest. Grassland accounts for 3.33% and shrubland 4.24%, adding smaller areas of open or transitional cover that should not automatically be labeled as farmland.
Water covers 2.02% of the county, a modest share by area, yet the blue features are easy to follow because they form long, connected shapes. A prominent water corridor runs through the central and northern part of the county, with additional water appearing toward the west and southwest. Wetlands are much more extensive at 12.02%. They appear as broad teal zones in several low-lying parts of the map and around water features, so a reader should distinguish open water from wetland rather than combining the two into a single “water” category.
Why water and wetland areas deserve separate attention
The 12.02% wetland share is larger than the 8.42% agricultural share, which makes wetlands an important part of the countywide picture rather than a minor edge category. In the general map, teal wetland areas help connect the visible river and reservoir features with surrounding low-lying cover. In the southwest, these wet areas are especially noticeable beside forest and agriculture. Looking at both maps together makes it easier to see that the blue open-water class and the teal wetland class describe different surface conditions.
The 1985–2025 comparison is not a development-rate map
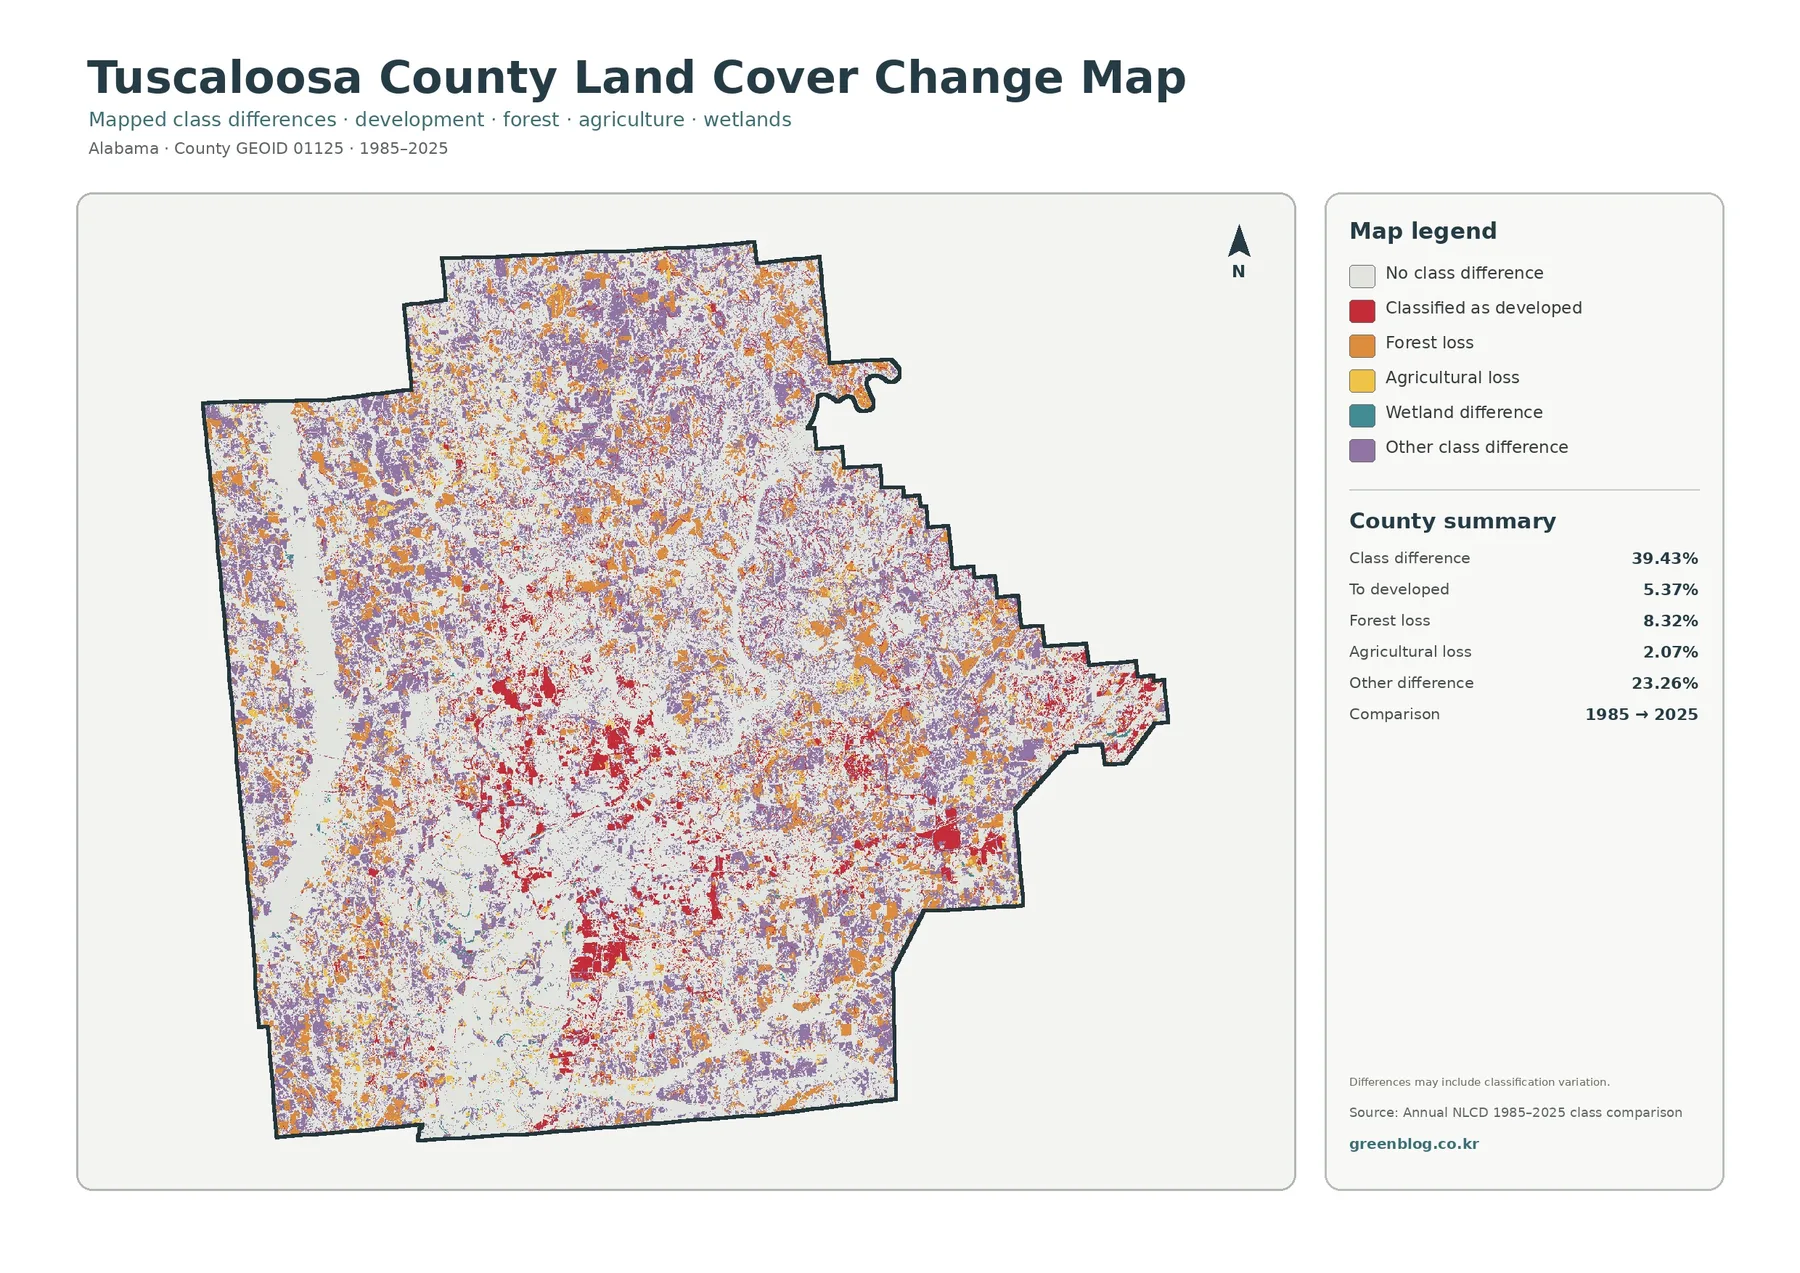
The change map reports a class difference across 39.43% of the county between the 1985 and 2025 classifications. That value includes several kinds of difference. Areas classified as developed in the comparison account for 5.37%, forest loss for 8.32%, agricultural loss for 2.07%, and other class differences for 23.26%. The legend also warns that differences may include classification variation. For that reason, the 39.43% total should never be restated as the share of the county that was developed.
Red development-change areas are concentrated around the central developed zone and appear in additional clusters toward the east. Orange forest-loss cells and purple other differences are much more dispersed across the county. Large pale areas indicate places where the broad class did not differ between the two comparison years. This mix makes the map useful for identifying where a closer look may be worthwhile, but it does not reveal the exact year when a change occurred or the reason for that change.
A practical way to compare the four map views
Start with the general land-cover map when the goal is orientation. It shows the countywide balance among forest, development, agriculture, wetland, and water without forcing the reader to switch between several legends. Next, move to the forest-and-farmland map if the question concerns open land, wooded areas, or the relationship between agriculture and wetland. The impervious map is better for the built surface, and the change map belongs at the end of the sequence because it compares two dates rather than describing a single current landscape.
Land cover is not the same as land use, zoning, or ownership
Land cover describes what is physically covering the ground as classified from remotely sensed data. Forest, water, wetland, grass, agriculture, and developed cover are surface categories. Zoning is a legal planning system, land use describes how people use land, and ownership comes from parcel and deed records. A wooded parcel can have many different legal uses, and an area mapped as developed does not by itself identify a zoning district. The maps on this page should therefore be read as environmental and geographic reference rather than a legal property source.
Download the four Tuscaloosa County land-cover JPG maps
The download archive contains one original JPG for each map shown on this page. Each file is 2480 × 1754 pixels. The package includes the 2025 general land-cover map, the forest-and-farmland map, the impervious-surface map, and the 1985–2025 land-cover-change map. The WebP images embedded in the article are optimized previews, while the JPG files are the better choice when saving the maps for slides, worksheets, or image-based comparisons.
Frequently Asked Questions
Why is developed cover 13.98% while mean impervious surface is only 3.40%?
They measure different things. Developed land is a land-cover class that can include vegetation and open space within developed settings. Impervious surface estimates the share occupied by hard surfaces such as pavement and rooftops. The two values are related, but they are not expected to match.
Does the 39.43% class difference mean 39.43% of the county was developed?
No. The 39.43% total includes all mapped class differences between 1985 and 2025. Only 5.37% is identified as a change to developed in the map summary. Forest loss, agricultural loss, other class differences, and possible classification variation are separate parts of the comparison.
What is included in the download?
The ZIP contains four 2480 × 1754 JPG files: current land cover, forest and farmland, impervious surface, and the 1985–2025 land-cover-change map. The WebP previews used in the article are not the download originals.
Map File Information
Tuscaloosa County Land Cover Map Files
- Included Files: Use only the versions confirmed in the article and supplied images
- File Type: Use the confirmed download contents
- Intended Use: Printing, education, presentations, and map-based projects
Related Maps
- Autauga County Alabama Land Cover Map
- Baldwin County Alabama Land Cover Map
- Barbour County Alabama Land Cover Map
Sources and reference material
- MRLC Annual NLCD Data — source data for current land cover and long-term comparison
- USGS Annual NLCD Land Cover Classification — class definitions and interpretation guidance
- U.S. Census Bureau TIGER/Line Shapefiles — county boundary reference
- Tuscaloosa County Public Works — Environmental — county environmental, stormwater, and flood-related documents
Green Map creates custom-edited map images using open geographic data sources such as geoBoundaries, Natural Earth, OpenStreetMap, and government open data.
These maps are edited visual materials, not raw data files, and are provided for education, documents, presentations, and graphic reference.