The Tallapoosa County Alabama Land Cover Map set is built around a county where forest is the dominant 2025 cover and Lake Martin creates a broad water feature through the western and central landscape. Forest accounts for 63.93% of the mapped area, while developed land, agriculture, grassland, water, shrubland, and wetlands form smaller but clearly visible patterns around the lake, towns, and open land.
Four views are included on this page: general land cover, forest and farmland, fractional impervious surface, and land-cover change from 1985 to 2025. The original 2480 × 1754 JPG versions are available together in one download near the end of the article. They work well for classroom reference, county comparisons, presentation graphics, and a first look at where broad surface-cover types occur.
Table of Contents
What the 2025 land-cover map says about the county
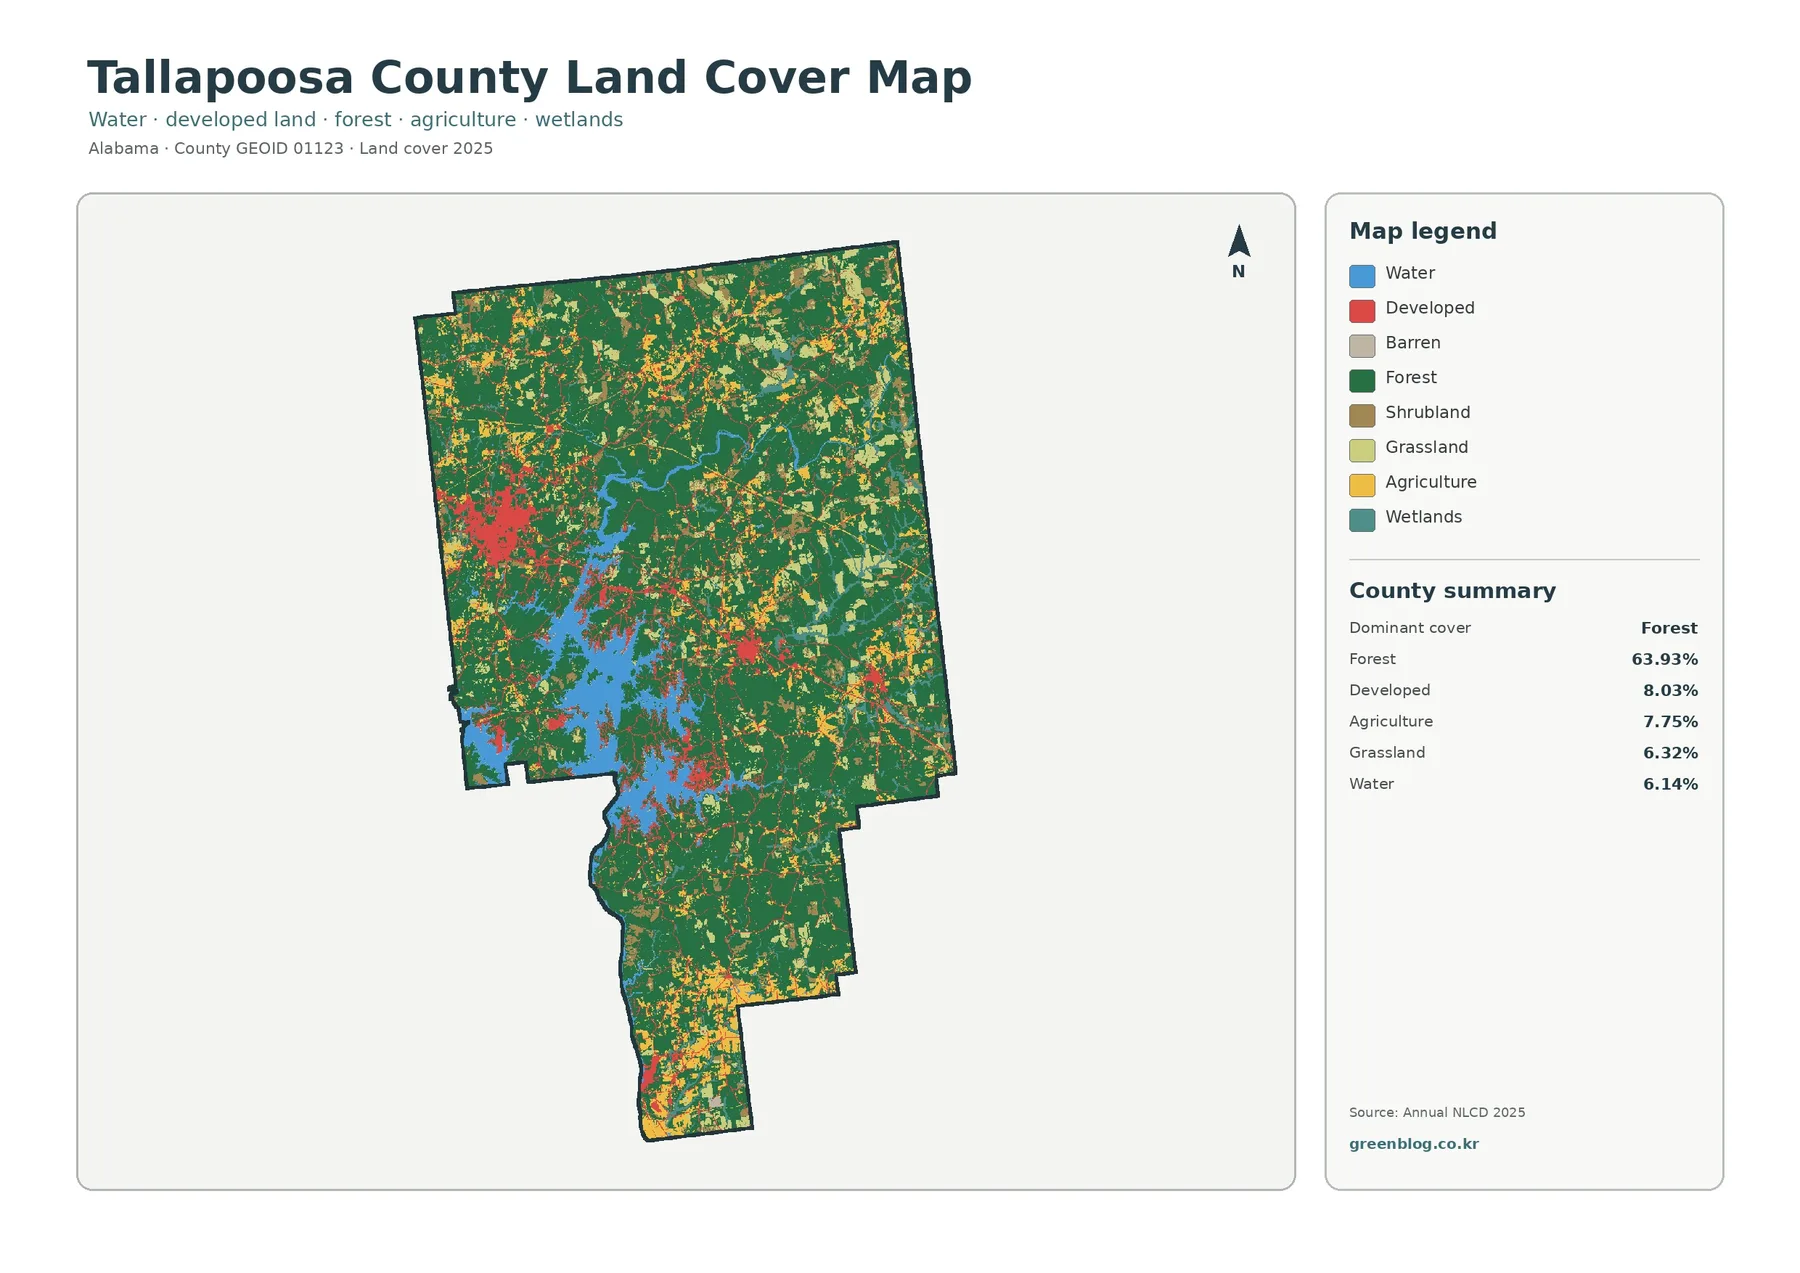
Dark green forest covers most of the county, not just one isolated block. Large wooded areas continue across the center, east, and south, while the north contains a finer mix of forest with agricultural and grassy openings. The county summary lists forest at 63.93%, developed land at 8.03%, agriculture at 7.75%, grassland at 6.32%, and water at 6.14%. Those figures explain why the map looks predominantly green even though the landscape is far from uniform.
The broad blue shape in the west-central part of the county is Lake Martin, a major local reference point on the Tallapoosa River system. The county commission describes communities and facilities around Alexander City, Willow Point, Dadeville, and other places near this lake. On the land-cover image, the shoreline creates many short transitions between water, forest, developed cover, and small wetland areas. These edges are useful for understanding the county at a regional scale, but they are not survey-quality shorelines.
Developed cover is most concentrated in the northwest around Alexander City. Smaller red clusters appear farther east and along connecting settlement corridors, with another modest concentration near the narrow southern end of the county. The map does not label roads or municipal boundaries, so these clusters are general developed areas rather than exact city limits.
Pavement and rooftops are concentrated rather than countywide
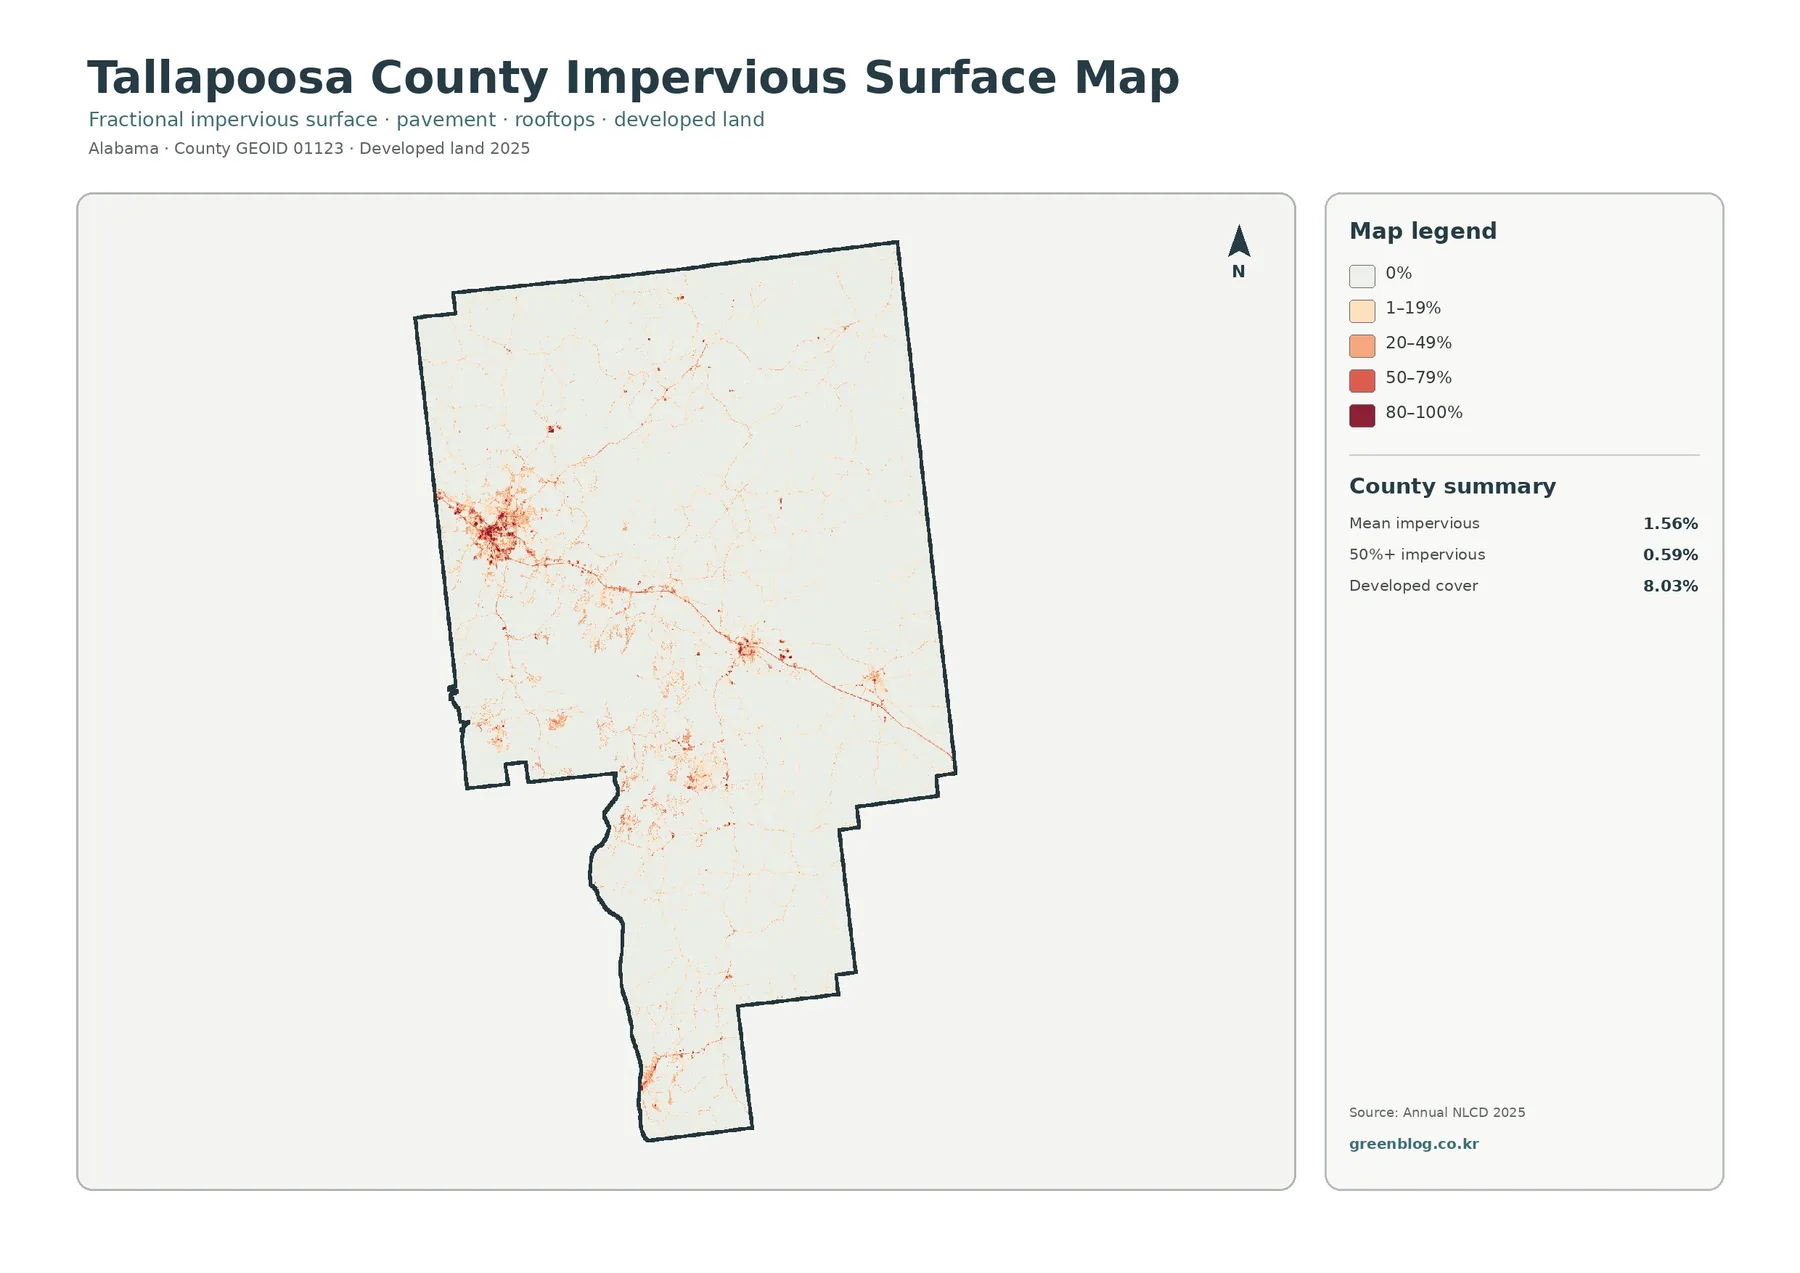
Impervious surface means ground cover such as pavement and rooftops that does not readily absorb rainfall. Tallapoosa County has a mean impervious value of 1.56%, and only 0.59% of the county is mapped at 50% impervious or higher. Those numbers are much lower than the 8.03% developed-cover figure because the two products measure different things. A low-density developed cell may contain homes and roads while still being mostly grass, trees, or bare soil.
The strongest impervious cluster sits in the northwest near Alexander City. From there, thinner lines and small nodes extend toward the central and eastern parts of the county. The pattern becomes much lighter away from settlements, especially across the large forested interior. A smaller hard-surface cluster also appears near the southern extension.
For watershed lessons, the map can help explain why “developed” and “impervious” are related but not interchangeable. It can also provide a starting point for discussing runoff around settled areas near Lake Martin. It cannot identify a specific drainage pipe, polluted site, flood-prone parcel, or stormwater problem. Those questions require current engineering, hydrology, and site-level information.
Forest and farmland form a patchwork outside the main developed areas
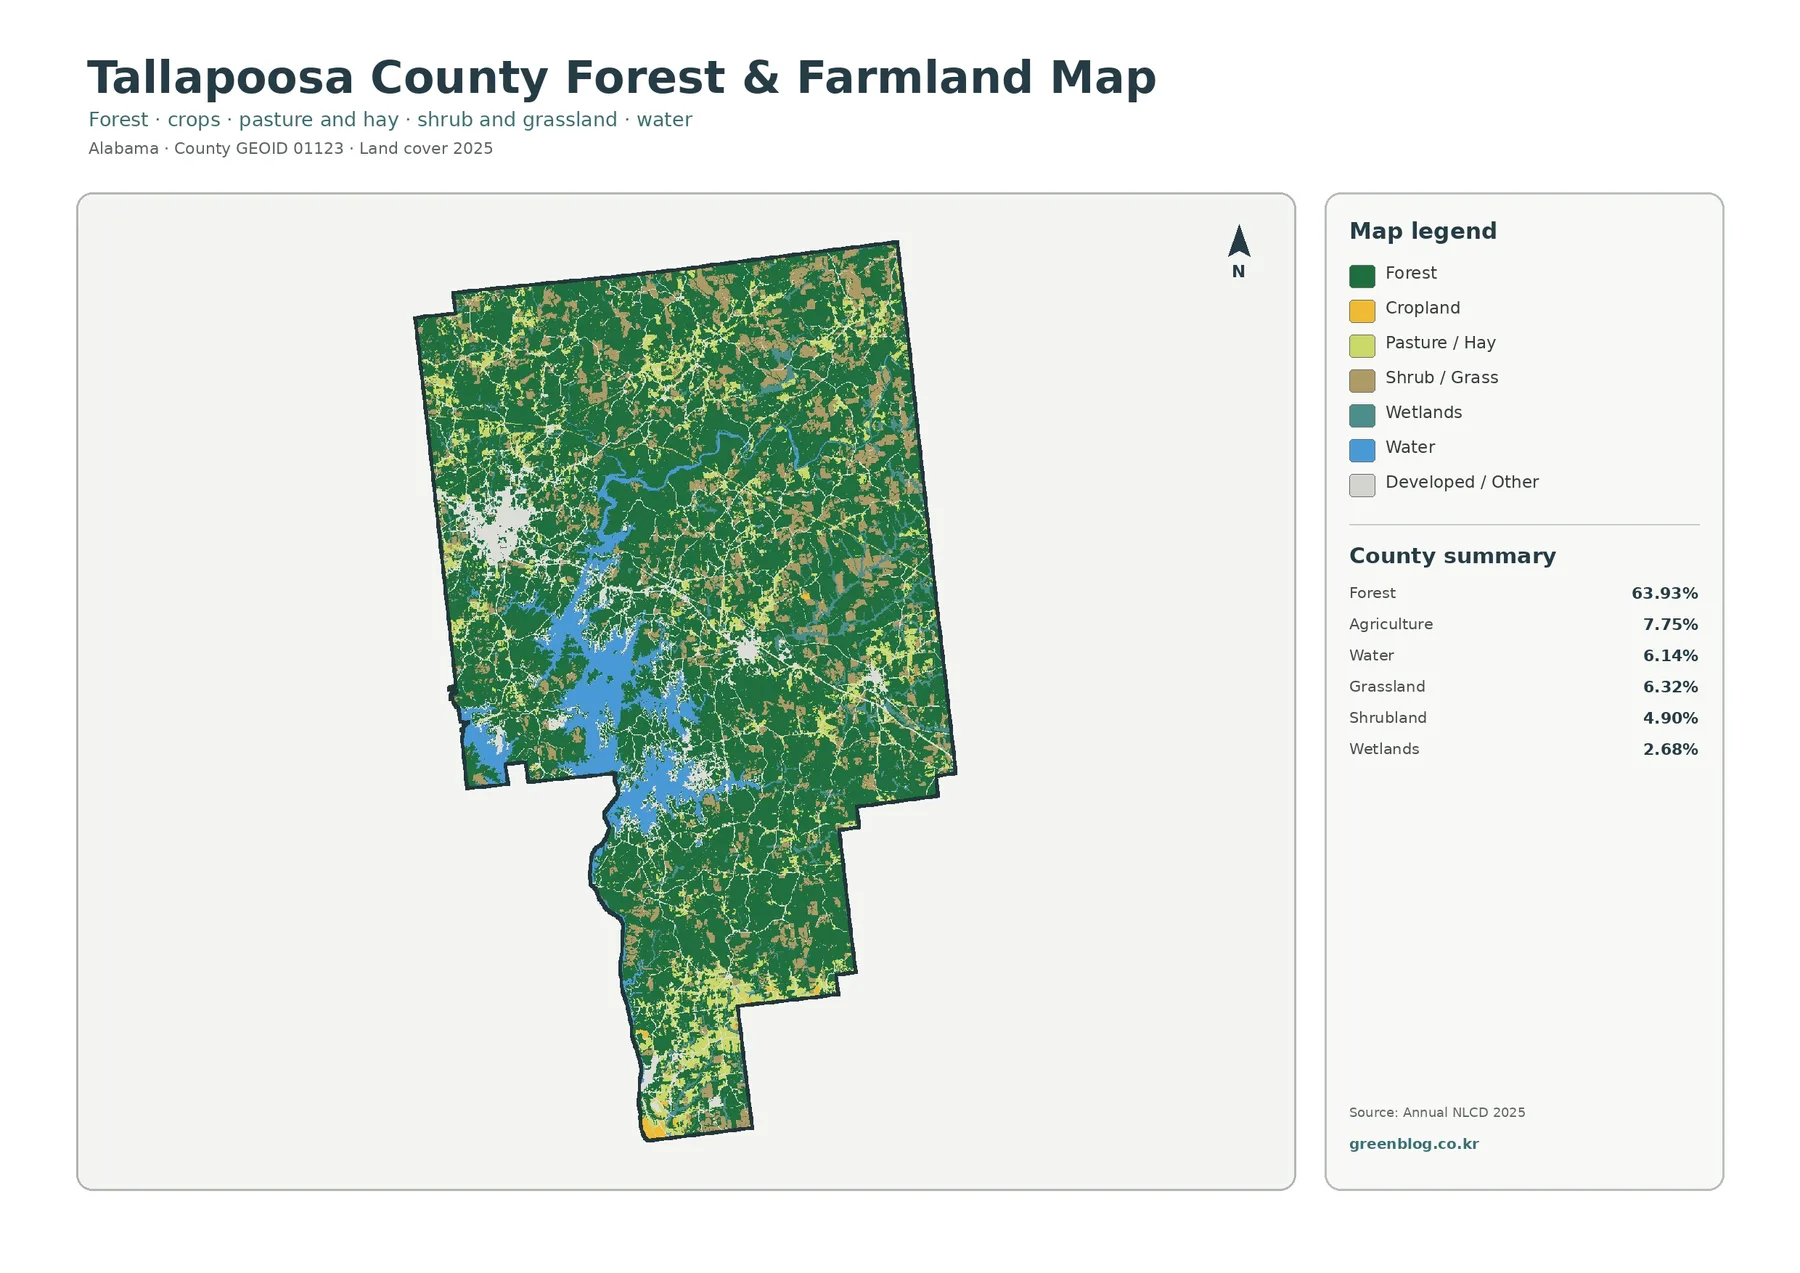
Removing most developed detail makes the county’s forest dominance easier to see. Forest remains continuous across much of the central and eastern area, while agriculture and grassland appear as many smaller openings rather than one broad farming block. The north contains frequent green-and-yellow transitions, and the narrow southern section also includes noticeable agricultural and grassy patches. This distribution is useful when a reader wants to compare wooded and open surfaces without focusing on urban cover.
Agriculture, grassland, and shrubland should remain separate when interpreting the legend. Agriculture represents the mapped crop and pasture/hay classes grouped for this product, while grassland and shrubland are other vegetation covers. Adding them together and calling the result “farmland” would overstate the agricultural share. In the same way, the 63.93% forest value is a land-cover classification, not a legal forestry designation and not a statement that every green pixel is managed timberland.
A 38.13% class difference is not a 38.13% development rate
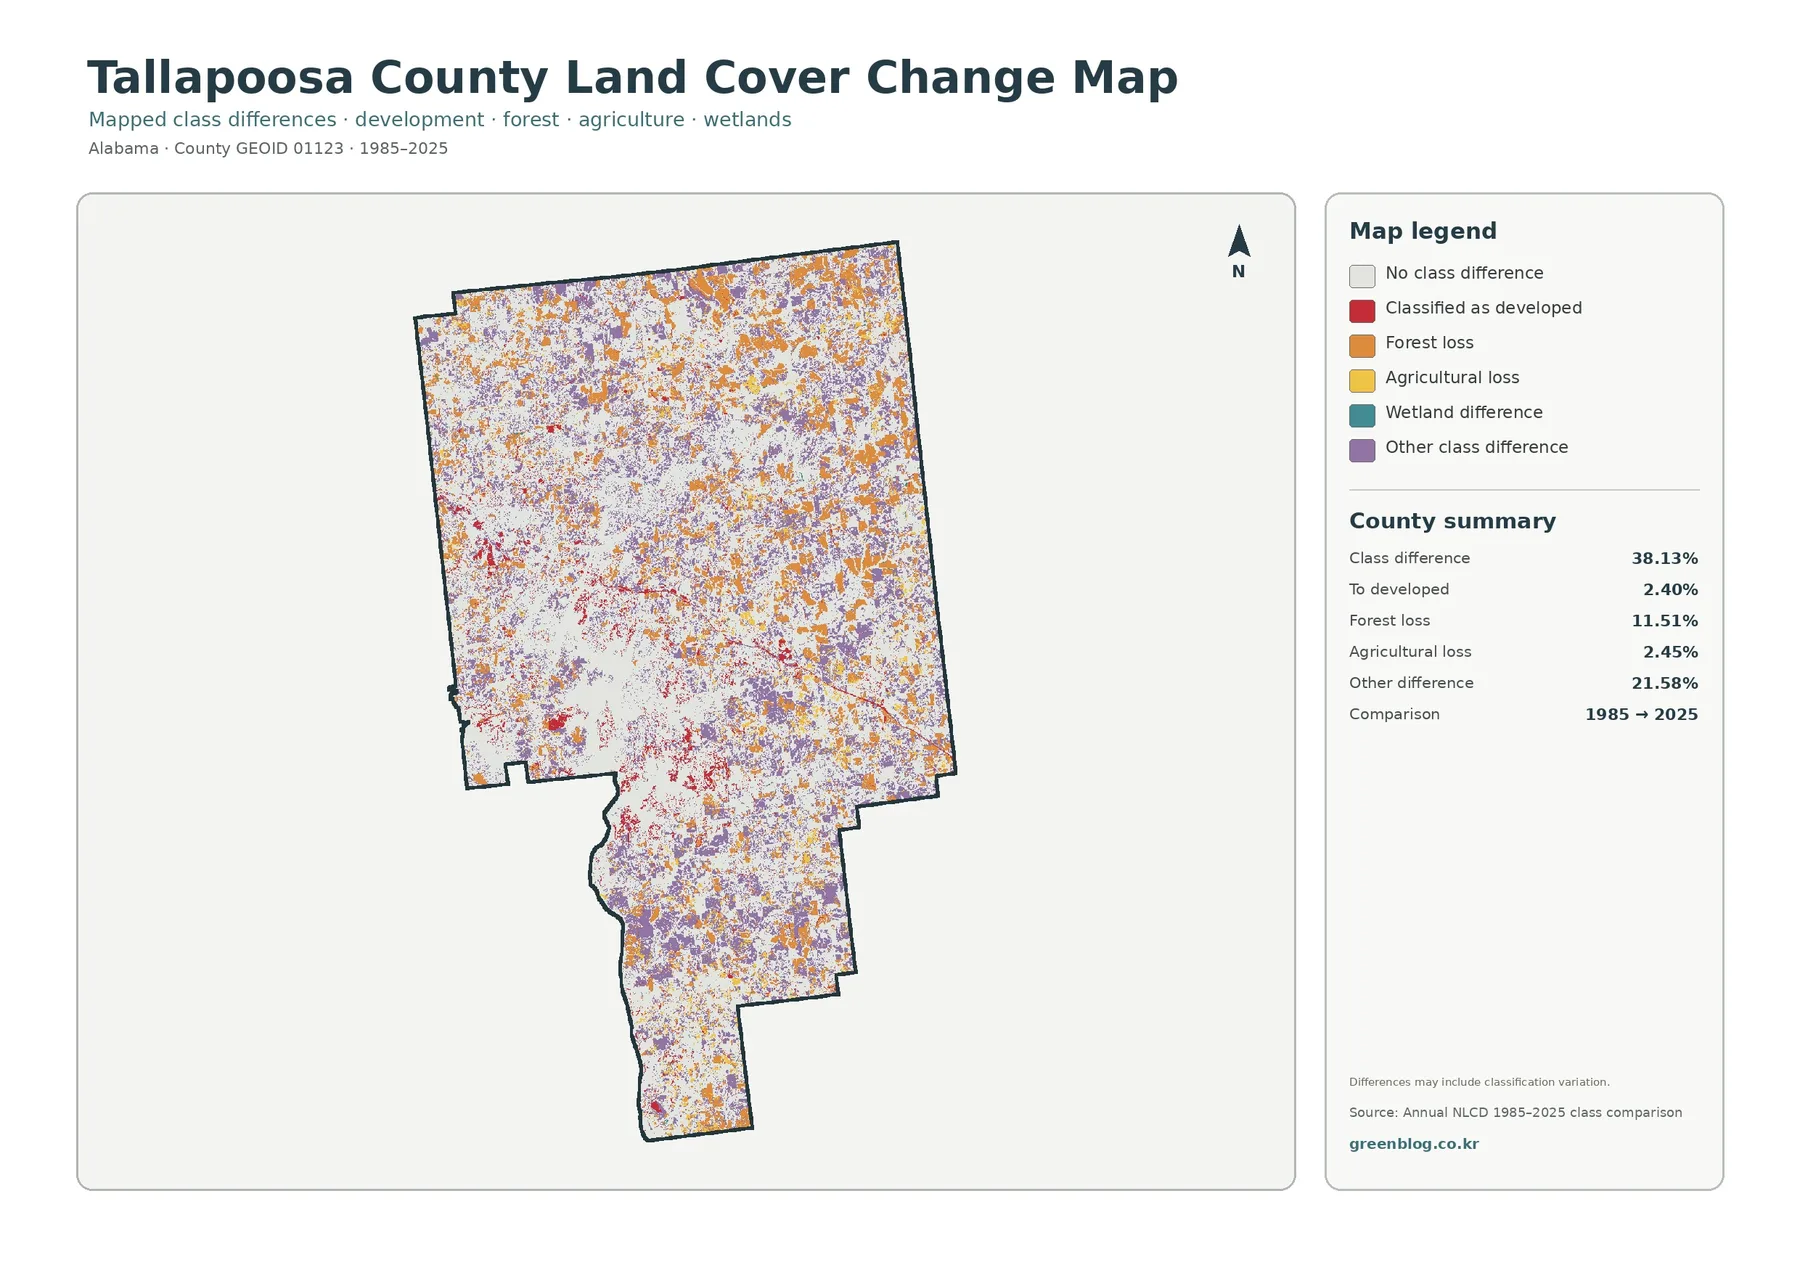
The change summary reports that 38.13% of the county has a different mapped class in 2025 than in 1985. That total includes several kinds of difference. Change to developed accounts for 2.40%, forest loss for 11.51%, agricultural loss for 2.45%, and other class differences for 21.58%. Treating the full 38.13% as development would therefore be a serious misreading of the legend.
Orange forest-loss cells and purple “other difference” cells are scattered widely, especially across the northern and eastern parts of the county. Red change-to-developed cells are more localized and are easier to notice near the northwest development cluster and along smaller settlement corridors. The southern section contains a mix of several change categories. The visual result suggests many different class transitions rather than one simple countywide trend.
The map also carries an important caution: differences may include classification variation. Annual NLCD Collection 1.2 provides annual land-cover products at 30-meter resolution from 1985 through 2025. Each cell receives a predominant class, so narrow roads, small fields, shoreline vegetation, and mixed surfaces may be simplified. When a long-term decision depends on one location, compare additional years, aerial imagery, local records, and field evidence instead of relying on a two-date class comparison alone.
Which map should you use?
Start with the general land-cover image when you need the broadest county picture. It is the best single view for comparing Lake Martin, forest, agriculture, developed land, and wetlands at once. Switch to the forest-and-farmland map when the main question is how wooded land relates to farms, grass, shrub cover, and water. The impervious view is more useful for locating concentrations of hard surface, while the change map adds the 1985-to-2025 time comparison.
The original JPG files measure 2480 × 1754 pixels each. The asset manifest does not mark them as meeting the package’s A3 high-resolution reference, so large-format printing should be tested before final production. They are more comfortably suited to screen presentations, documents, worksheets, and moderate-size prints where the original aspect ratio is preserved. The WebP images embedded in the article are preview versions rather than the download originals.
Download the four Tallapoosa County land-cover JPG maps
Reading the maps without over-interpreting them
Land cover is not zoning, ownership, or a legal land-use designation. A forest-class cell does not prove that a parcel is protected forest, and an agriculture-class cell does not establish a farm boundary. Developed cover does not define a municipality. The maps describe the predominant surface cover represented by the dataset and are best used for regional comparison rather than parcel-level decisions.
The 2025 maps also have a time limit. Construction, harvesting, crop rotation, vegetation recovery, and water-level changes after the observation period may alter what is on the ground. Because the data are raster-based, small features can be merged into a larger cell or represented by the class that occupies the greatest share. If a project depends on current site conditions, verify the location with recent imagery and authoritative local data.
Frequently Asked Questions
What is the largest land-cover class in Tallapoosa County?
Forest is the largest 2025 class at 63.93%. Developed land is 8.03%, agriculture 7.75%, grassland 6.32%, and water 6.14%. The forest-and-farmland map also lists shrubland at 4.90% and wetlands at 2.68%.
Does the map include Lake Martin?
Yes. The large west-central water feature is Lake Martin, which is part of the Tallapoosa River system. It provides an important reference for reading the surrounding forest and development pattern. The land-cover map is not a navigation chart, property map, or precise shoreline survey.
Does the 38.13% class difference mean that 38.13% of the county was developed?
No. The 38.13% figure combines all cells whose mapped class differs between 1985 and 2025. Only 2.40% is categorized as change to developed. Forest loss, agricultural loss, other class differences, and possible classification variation make up the rest of the total.
What is included in the download?
The archive contains four original JPG files at 2480 × 1754 pixels: the general land-cover map, forest-and-farmland map, impervious-surface map, and 1985–2025 change map. The package manifest does not mark these files as meeting its A3 high-resolution reference.
Map File Information
Tallapoosa County Land Cover Map Files
- Printable Size: 2480 × 1754 pixels each
Related Maps
- Autauga County Alabama Land Cover Map
- Baldwin County Alabama Land Cover Map
- Barbour County Alabama Land Cover Map
Sources and references
- MRLC Annual NLCD Data — annual land-cover and related products
- USGS Annual NLCD Collection 1.2 Land Cover — 1985–2025 coverage and 30-meter raster documentation
- U.S. Census Bureau TIGER/Line Shapefiles — county boundary reference
- Tallapoosa County Commission — local communities and Lake Martin context
- Alabama Power Shorelines: Lake Martin — Lake Martin and Tallapoosa River reservoir information
Green Map creates custom-edited map images using open geographic data sources such as geoBoundaries, Natural Earth, OpenStreetMap, and government open data.
These maps are edited visual materials, not raw data files, and are provided for education, documents, presentations, and graphic reference.