The Talladega County Alabama Land Cover Map set shows a county where forest remains the largest surface class, while agriculture and developed land form a series of contrasting patches from north to south. The four views make it easier to separate the broad 2025 land-cover pattern from forest and farmland, hard surfaces, and mapped change since 1985.
All four original JPG maps are available together in one download near the end of the page. They work well for classroom comparison, county-level environmental study, presentations, and general reference when the goal is to understand broad surface patterns rather than individual parcels.
Table of Contents
A forest majority with several distinct developed centers
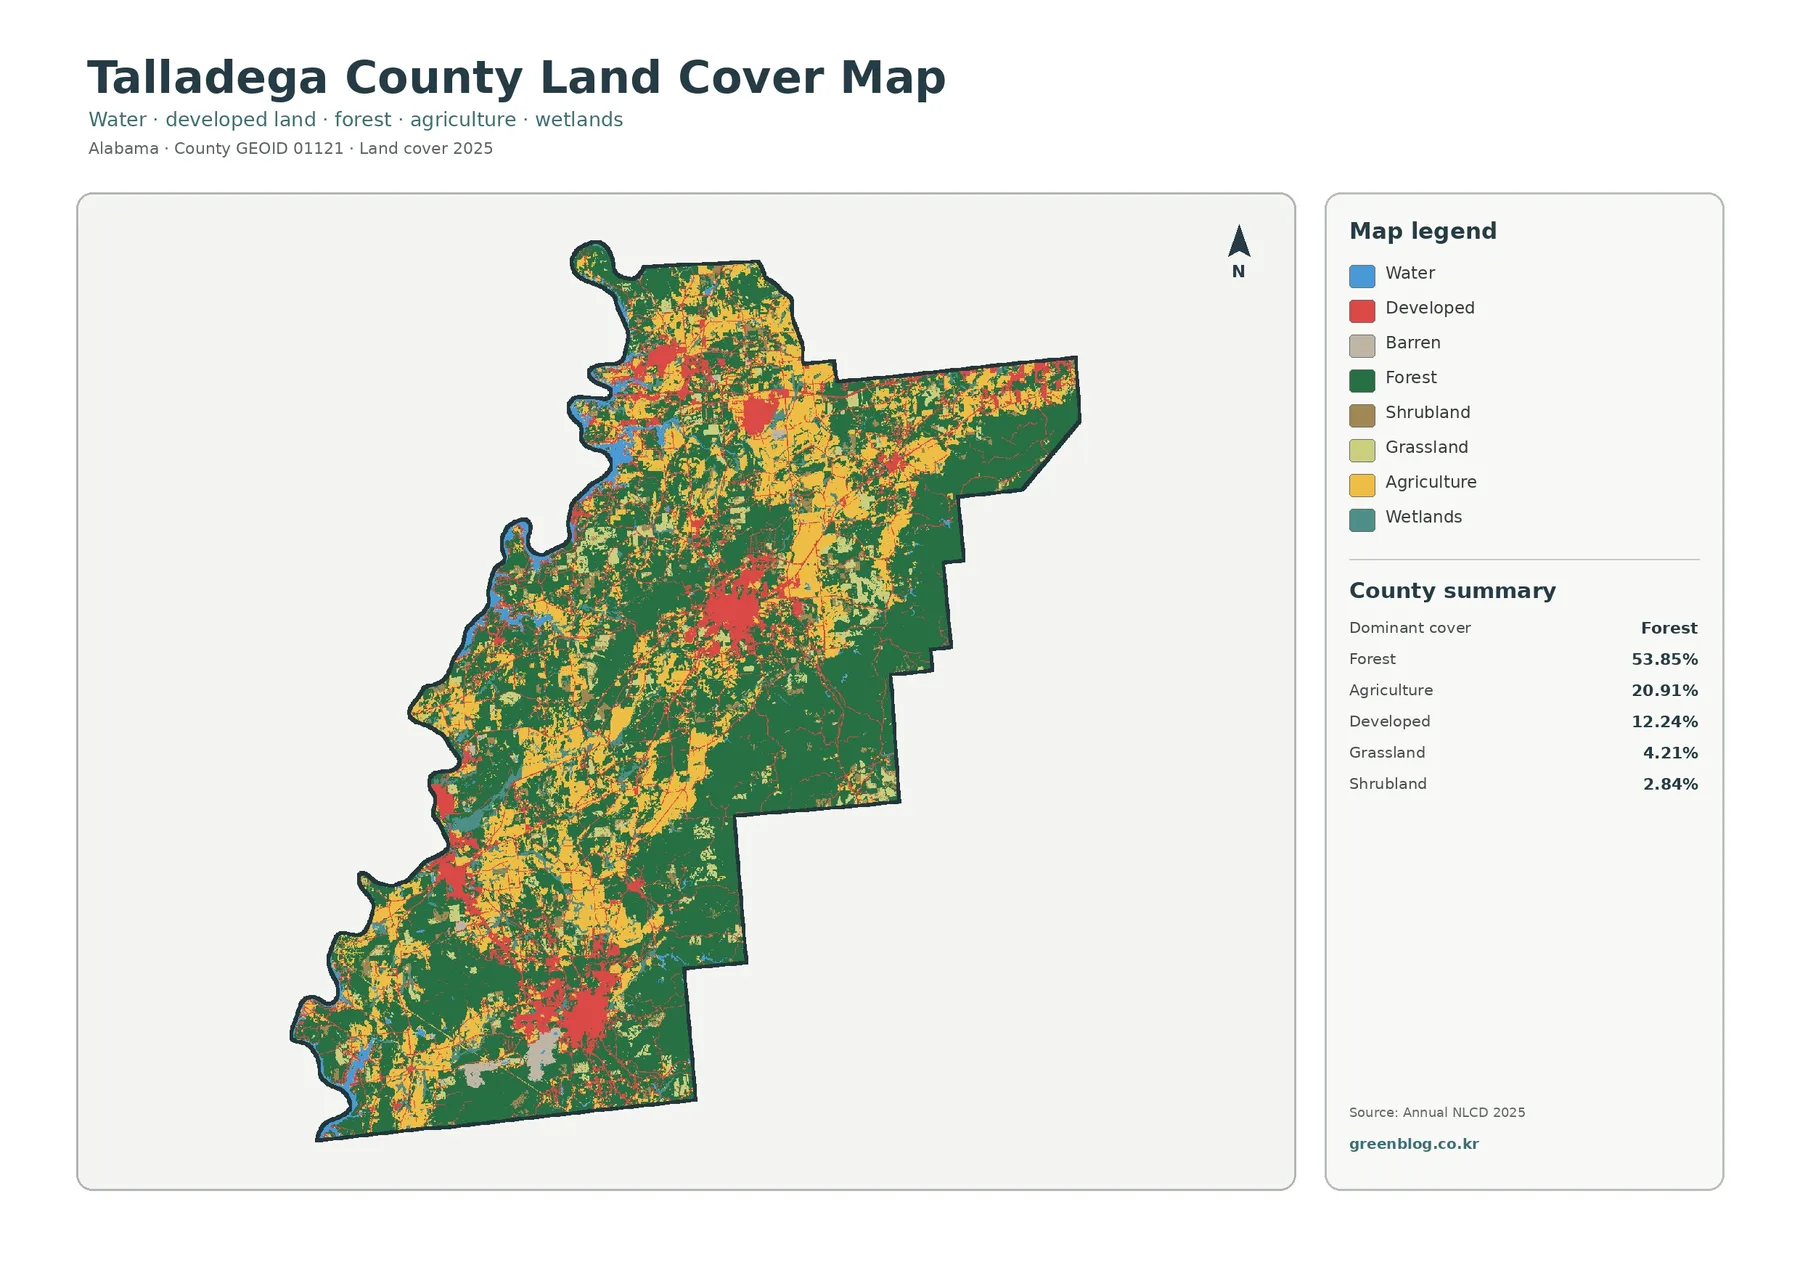
Forest accounts for 53.85% of the county in the 2025 summary, giving the map its dominant dark-green appearance. Agriculture covers 20.91%, developed land 12.24%, grassland 4.21%, and shrubland 2.84%. These countywide percentages are useful starting points, but the map adds the more important spatial detail: the same classes are not spread evenly from one edge of the county to the other.
The eastern side contains some of the broadest continuous forest on the map. Central and western areas show more frequent yellow agricultural patches mixed with woodland, while developed areas appear as stronger red clusters in the north, around the central part of the county, and again in the south. The result is not a simple urban-versus-rural split. Talladega County has several separate settlement areas surrounded by large stretches of forest and farm cover.
Water also helps explain the county’s western edge. Outdoor Alabama identifies Logan Martin Lake and Lay Lake as Coosa River reservoirs that border Talladega County. The general land-cover map shows blue water along portions of that side, with nearby wetland colors in smaller bands and pockets. The map is useful for seeing those surface relationships at county scale, but it is not a hydrography chart and should not be used to define shorelines, flood zones, or regulated wetland boundaries.
Hard surfaces reveal where development is most concentrated
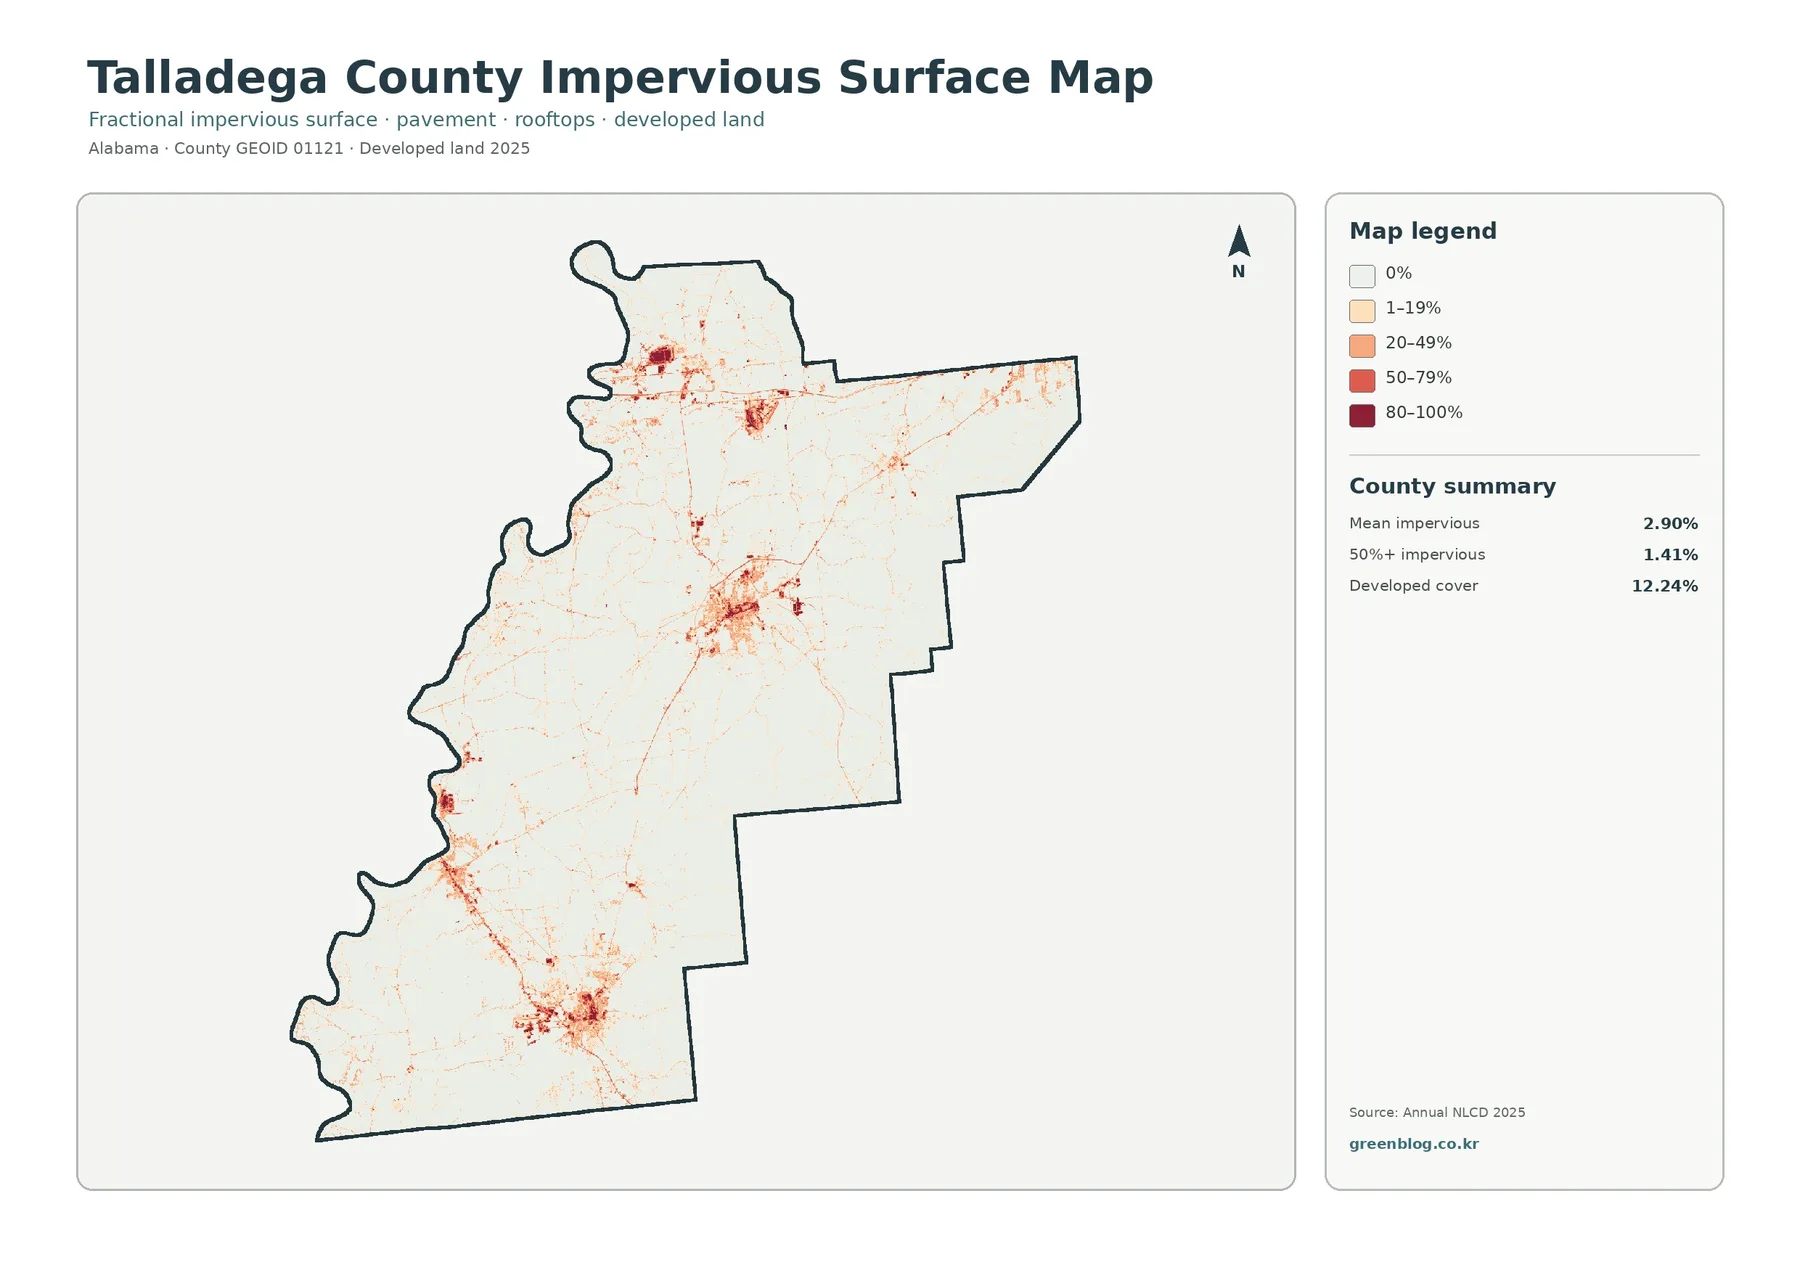
Impervious surface means pavement, rooftops, and other surfaces that do not readily absorb rainfall. Talladega County’s mean imperviousness is 2.90%, and only 1.41% of the county is mapped at 50% impervious or higher. Those figures are much smaller than the 12.24% developed-land share because a developed class can include lawns, trees, bare soil, and other permeable ground in addition to roads and buildings.
The strongest dark-red concentrations are localized rather than continuous. A northern cluster aligns with the Lincoln area, a larger central cluster with Talladega, and another strong concentration appears around Sylacauga in the south. Smaller developed concentrations and linear traces extend elsewhere, including the Childersburg side of the county. Thin red lines also follow transportation corridors between settlement areas, making the hard-surface map a useful companion to the broader developed category.
Forest and farmland become clearer when other classes are muted
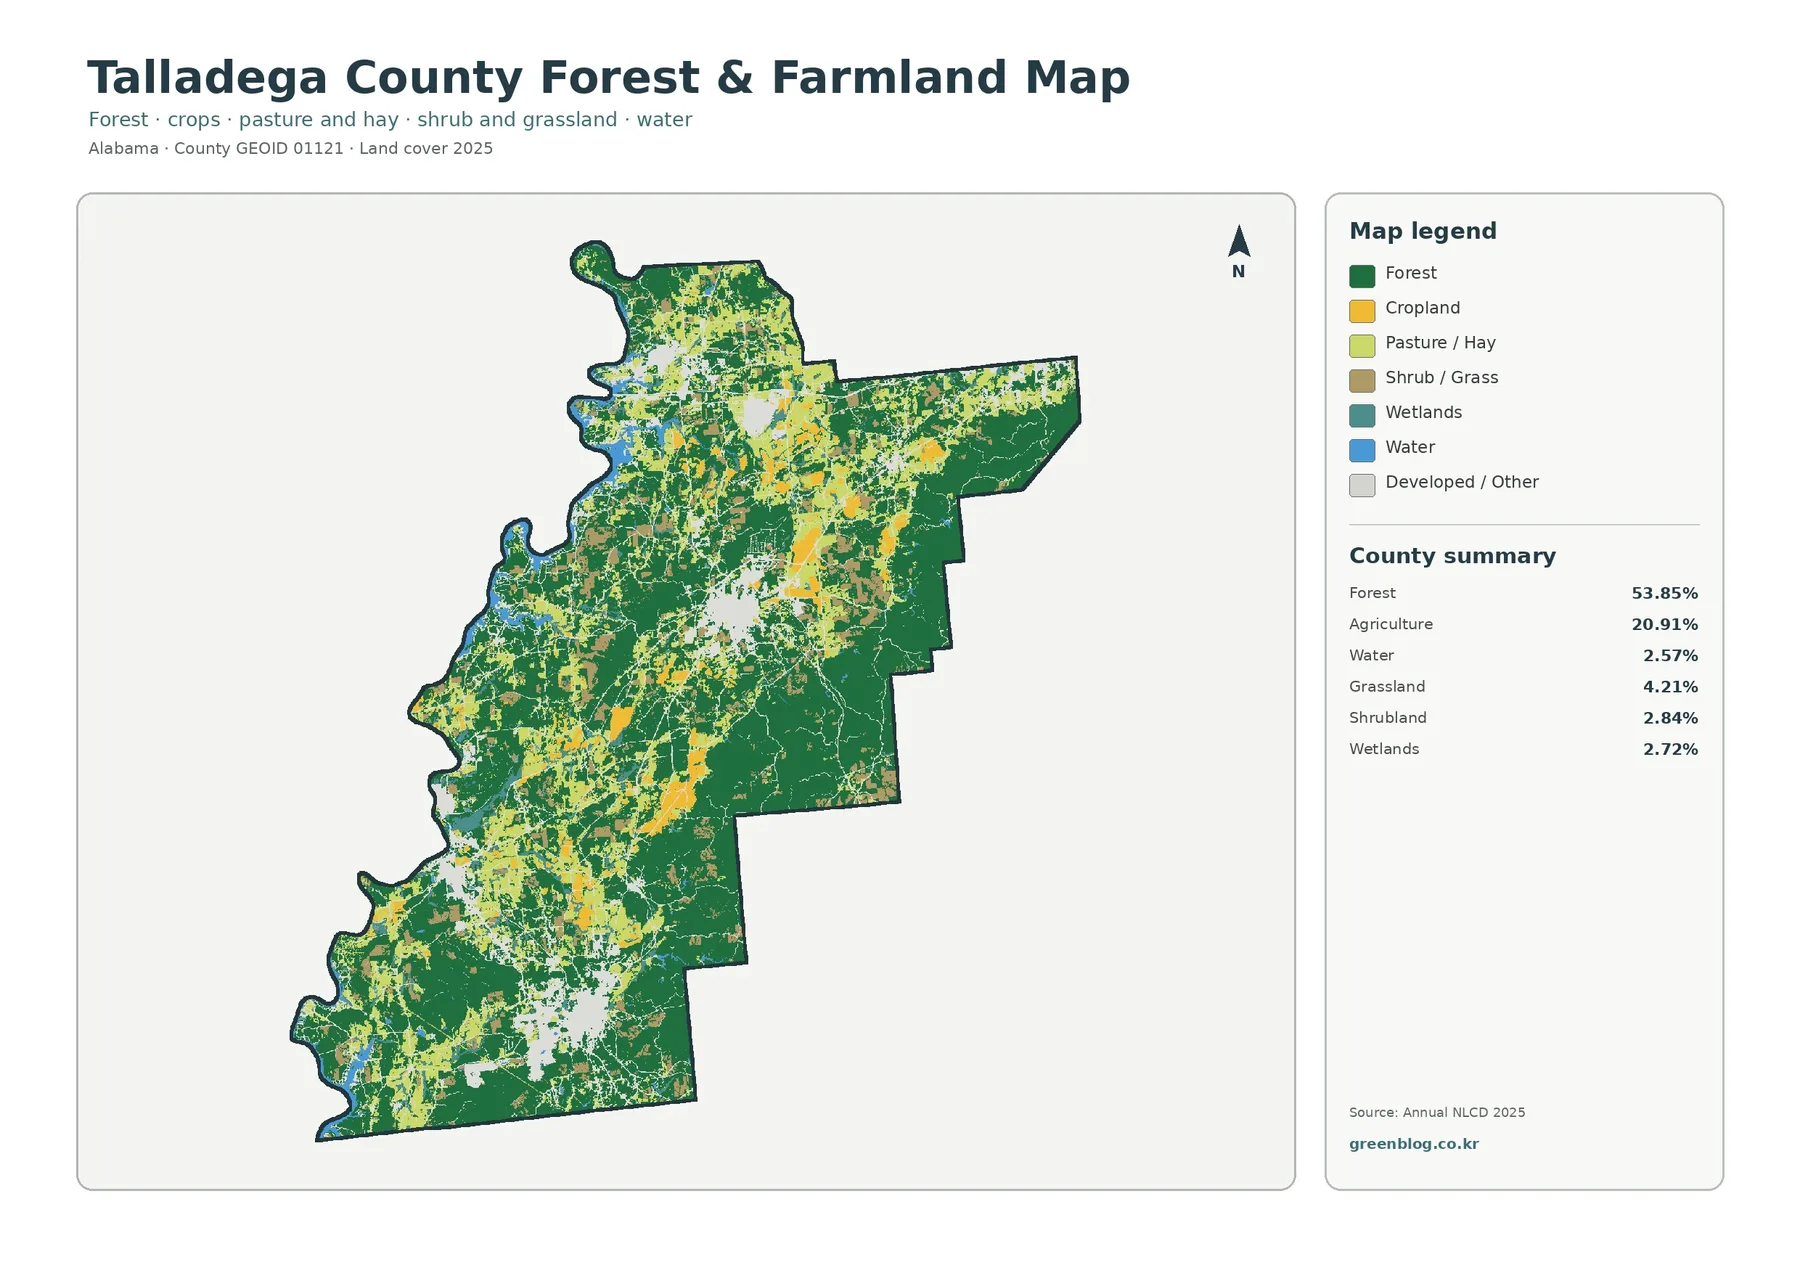
Removing much of the developed-color emphasis makes the county’s wooded structure easier to see. The east stands out as a broad forested block, with additional large green areas through the central and southern portions of the county. Agriculture appears in a much more broken pattern. Yellow cropland and lighter pasture or hay areas form many separate patches, especially across northern, central, western, and southwestern sections.
The map also gives useful context for the Talladega National Forest area without turning land cover into an ownership map. The USDA Forest Service operates the Talladega Ranger District, and the City of Talladega describes its community as being adjacent to the national forest. That regional setting helps explain why extensive woodland is an important part of the county landscape, but every green pixel on this map should not be labeled as federal forest. NLCD forest is a surface-cover classification, not a property or management boundary.
Water represents 2.57% and wetlands 2.72% in this focused summary. Those percentages are modest compared with forest and agriculture, yet their shapes matter. Blue and teal features follow parts of the western reservoir edge and narrower drainage corridors. They can help students or researchers compare nearby upland cover with water-associated environments, but regulatory wetland determinations require dedicated field and agency information.
The 1985–2025 map separates overall class difference from development
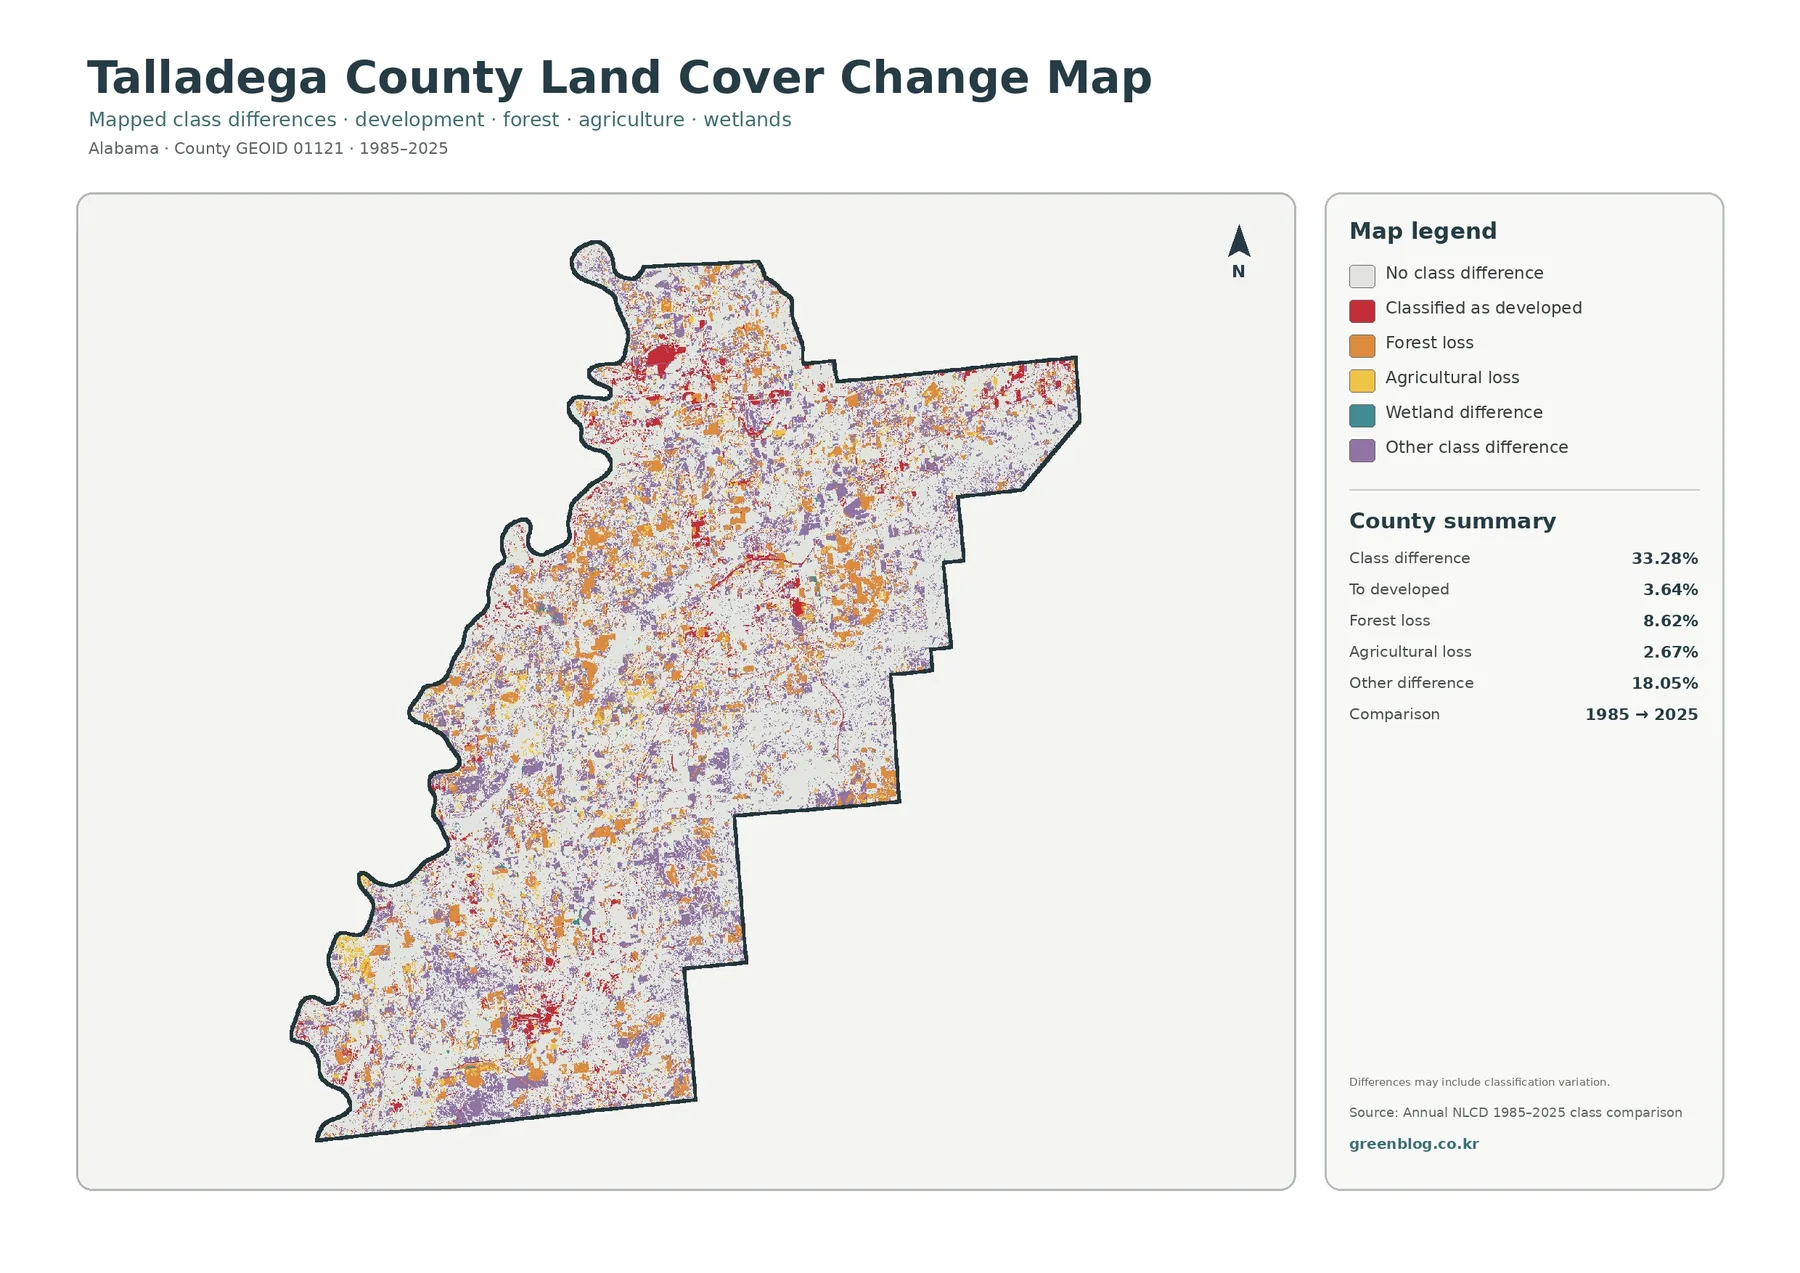
The most important reading rule for the change map is that 33.28% total class difference is not a development rate. It is the share of mapped cells that carry a different land-cover class in the 1985 and 2025 comparison. Within that total, 3.64% is categorized as change to developed, 8.62% as forest loss, 2.67% as agricultural loss, and 18.05% as other class difference.
Red change cells are noticeable around several of the same northern, central, and southern settlement areas that stand out on the impervious map. Orange forest-loss cells appear as smaller patches and bands across much of the county, including forested parts of the east and center. Purple “other difference” cells are widely scattered, which is one reason the total class-difference figure is much larger than the specific developed-transition percentage.
The comparison should be used to identify places worth examining more closely, not to assign causes. A cell classified differently after forty years might reflect actual land-cover change, but differences can also include classification variation. Confirming a specific conversion requires annual source data, aerial imagery, project records, or field evidence. The change map is therefore best treated as a screening and teaching layer.
A practical reading order for study, teaching, and presentations
For a quick county overview, start with the general land-cover map and identify the broad forest majority, major agricultural patches, developed centers, and western water. Move next to the impervious map if the question concerns settlement intensity. It will separate the hard-surface cores from the broader developed class and make the larger municipal areas easier to compare.
These maps are well suited to county reports, environmental education, watershed discussions, comparison with neighboring counties, and presentation graphics. They can also help frame questions before consulting more detailed GIS layers. A teacher might ask why impervious surface is a smaller percentage than developed land, while a local study might compare forest cover near reservoirs with forest in the eastern interior.
What the maps do not show at parcel scale
Annual NLCD is a raster classification, meaning the landscape is divided into grid cells and each cell receives a class or surface value. That approach is excellent for regional comparison but necessarily generalizes small features. A cell can contain a mixture of tree cover, pavement, grass, and structures, so the mapped boundary between two classes will not always match a fence, lot line, road edge, or stream bank on the ground.
Do not use these images to decide zoning, ownership, development rights, wetland jurisdiction, flood insurance status, or engineering conditions. Those questions require current county records, regulatory maps, surveys, and sometimes field inspection. The value of this set is the broad county pattern and the ability to compare four related views in a consistent format.
Download the four Talladega County land-cover JPG maps
The downloadable archive contains the four original JPG files corresponding to the previews on this page: general land cover, forest and farmland, impervious surface, and 1985–2025 land-cover change. Each original is 2480 × 1754 pixels. The asset manifest does not mark these files as meeting an A3 high-resolution reference, so check print size and text sharpness before producing a large-format copy.
Frequently Asked Questions
Why is developed land 12.24% while mean imperviousness is only 2.90%?
They measure different things. The developed land-cover class can include buildings and pavement along with lawns, trees, and other open surfaces inside developed settings. Imperviousness measures the share of surface that is actually hard and water-resistant, such as roofs and pavement, so its county average can be much lower.
Does 33.28% class difference mean one-third of Talladega County was developed?
No. The 33.28% figure combines all cells classified differently in 1985 and 2025. The specific “to developed” category is 3.64%. Forest loss, agricultural loss, and other class differences make up other portions of the total.
Are the downloaded JPGs high-resolution A3 files?
The originals measure 2480 × 1754 pixels, but the supplied asset manifest does not flag them as meeting the package’s A3 high-resolution reference. They are suitable for screen use and many ordinary print layouts, but a large-format job should be tested at the intended size first.
Map File Information
Talladega County Land Cover Map Files
- Included Files: Use only the versions confirmed in the article and supplied images
- File Type: Use the confirmed download contents
- Intended Use: Printing, education, presentations, and map-based projects
Related Maps
- Autauga County Alabama Land Cover Map
- Baldwin County Alabama Land Cover Map
- Barbour County Alabama Land Cover Map
Sources and reference links
- MRLC Annual NLCD Data — source portal for Annual NLCD land-cover data
- USGS Annual NLCD Land Cover Classification — land-cover class definitions and documentation
- U.S. Census Bureau TIGER/Line Shapefiles — county boundary reference
- Alabama EMA: Talladega County — county location, municipalities, and regional background
- USDA Forest Service: National Forests in Alabama — Talladega Ranger District context
- Outdoor Alabama: Logan Martin Lake and Lay Lake — Coosa River reservoir context along Talladega County
Green Map creates custom-edited map images using open geographic data sources such as geoBoundaries, Natural Earth, OpenStreetMap, and government open data.
These maps are edited visual materials, not raw data files, and are provided for education, documents, presentations, and graphic reference.