Butler County lies in south-central Alabama, with Greenville providing the easiest starting point for understanding the county. Interstate 65 passes just east of the county seat, U.S. 31 continues south toward Georgiana and McKenzie, and Alabama 10 crosses the Greenville area from west to east. Away from those roads, the landscape is shaped by many branching creeks, small lakes and ponds, rolling northern uplands, and lower valleys that become more noticeable toward the southern half of the county.
This page separates those features into clear map views so you can look at roads, town positions, water, and elevation without crowding everything onto a single sheet. The previews below are useful for quick reference, and the downloadable archive contains four high-resolution A3 portrait JPG maps for printing, classroom work, presentations, and general county study. The maps are intended for geographic reference rather than parcel research, surveying, flood determinations, or turn-by-turn navigation.
Table of Contents
Greenville, Roads, and County Orientation
Greenville stands out immediately on the county reference map because several important routes meet in or near the city. I-65 runs north-south just to the east, while U.S. 31 follows another north-south path through the county. Alabama 10 provides an east-west connection through Greenville, and state routes such as Alabama 106, 185, and 263 add local links to surrounding communities. For someone seeing Butler County for the first time, this road pattern is more useful for orientation than trying to memorize the exact shape of every county-boundary bend.
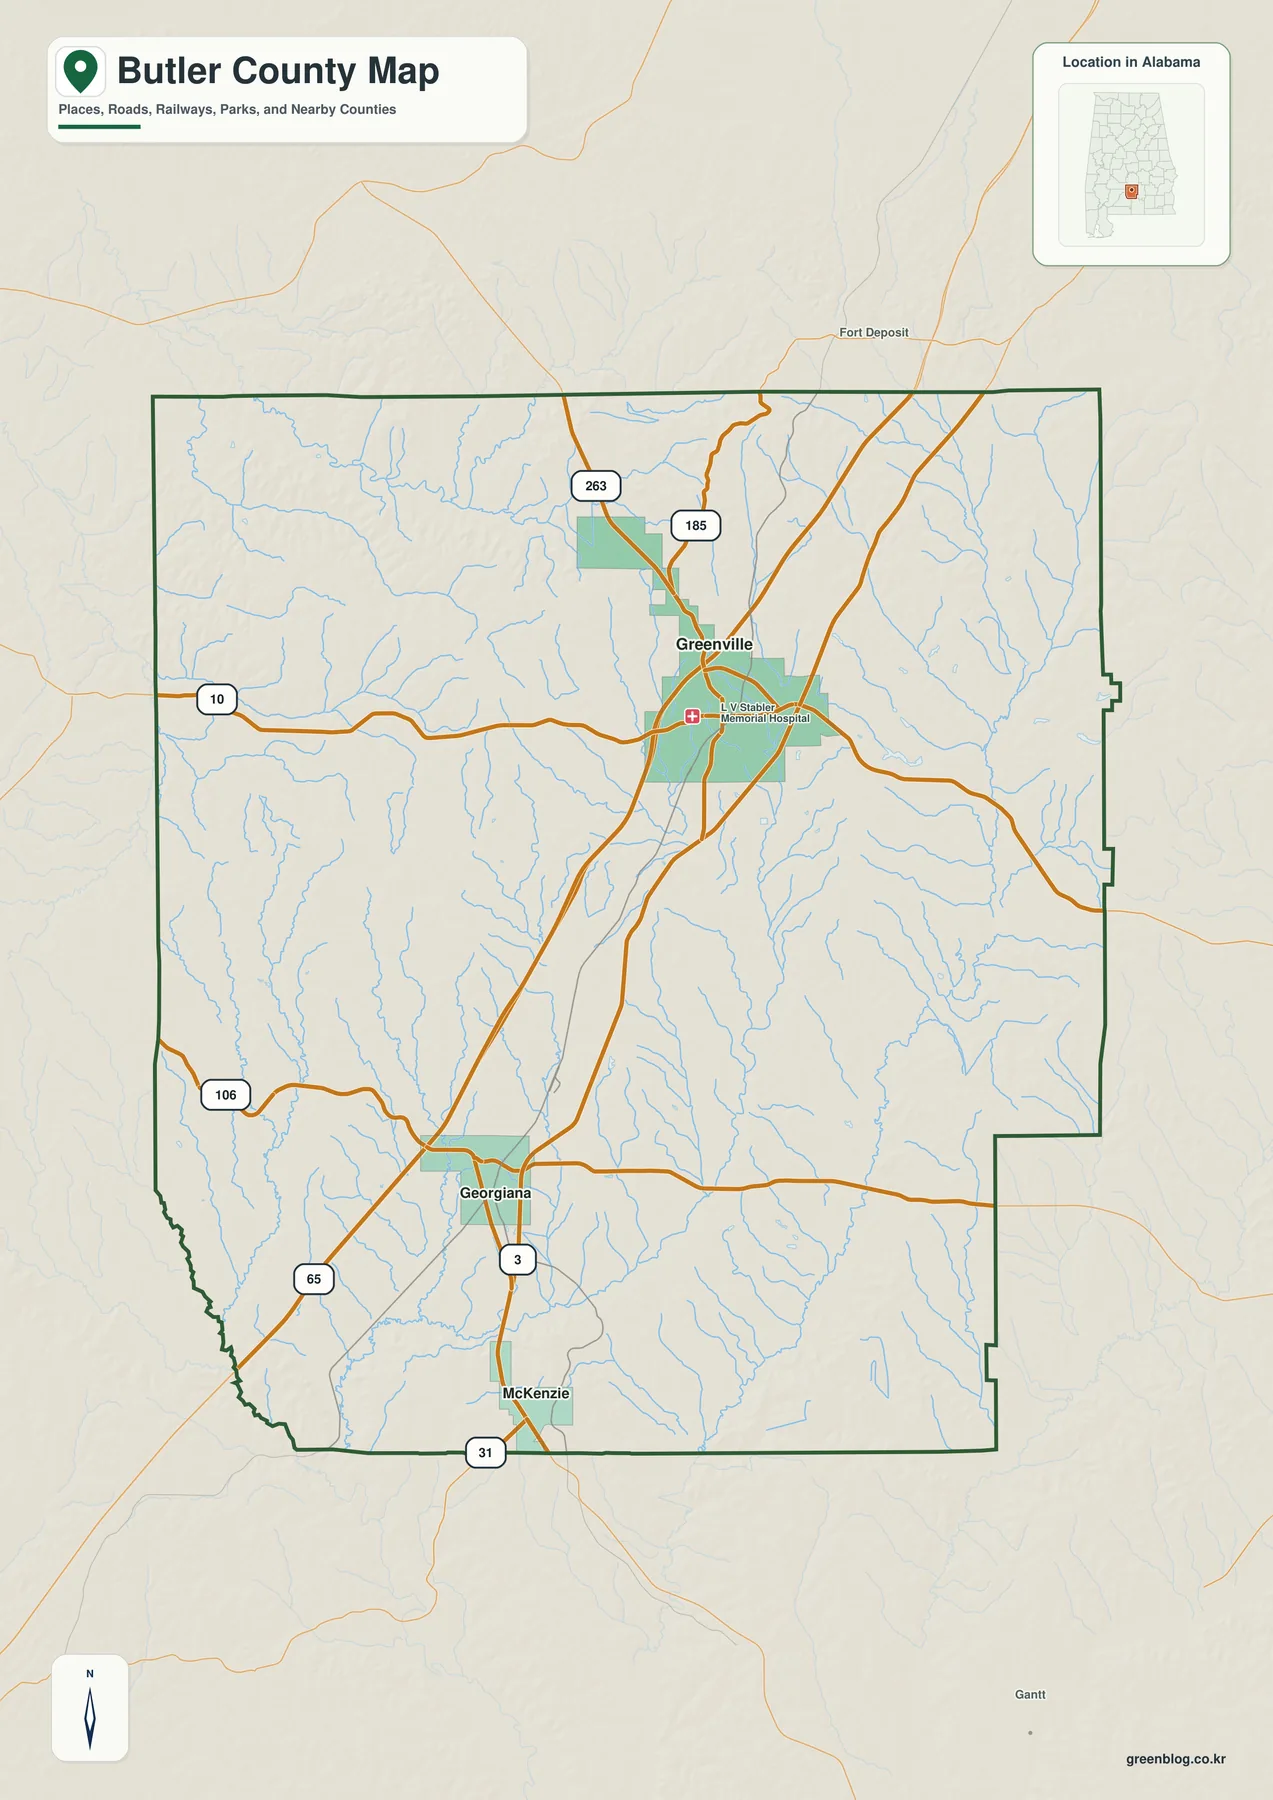
Following U.S. 31 south from Greenville leads toward Georgiana and then toward the lower part of the county near McKenzie. Fort Deposit appears beyond the northern edge of the mapped county, while Gantt is labeled to the south, giving useful outside reference points for placing Butler County within this part of Alabama. The boundary itself changes direction several times along the eastern and southern sides, so roads and settlements provide practical landmarks when reading the map at a smaller size.
The county sheet works best as a general orientation map. It answers questions such as which highway passes Greenville, where Georgiana sits relative to the county seat, and how the road network reaches the southern end of the county. It is not designed to establish parcel boundaries or legal property lines. Once those basic locations are familiar, the city, water, and elevation views make much more sense because the same places can be compared against a simpler set of features.
Greenville, Georgiana, and McKenzie in One View
The city-connections map removes most of the background detail and focuses on three labeled places. Greenville is marked as point 1, Georgiana as point 2, and McKenzie as point 3. That simplified design makes the county’s north-to-south settlement pattern easy to see: Greenville occupies the northern position in the comparison, Georgiana lies farther south, and McKenzie is closer to the county’s southern edge.
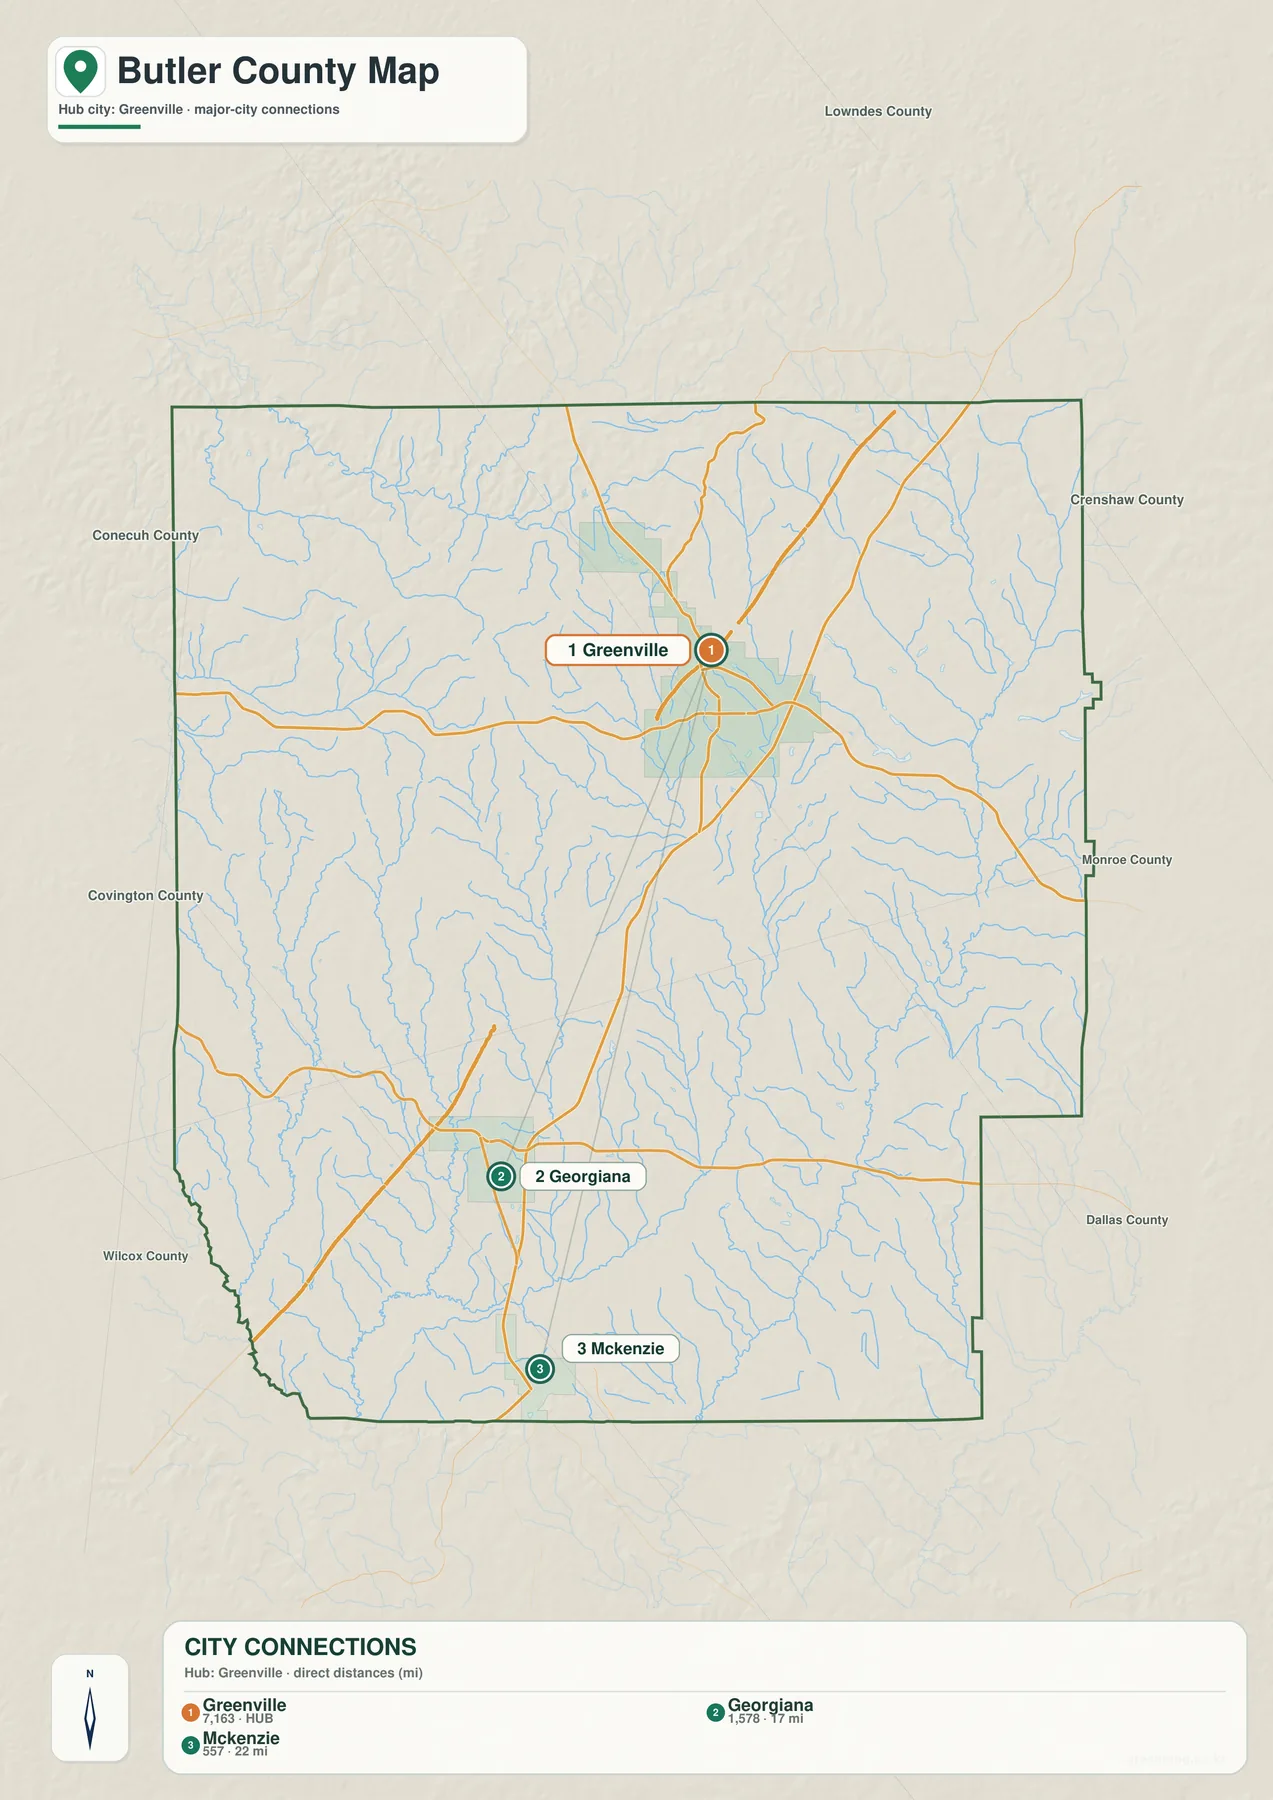
The labels show Georgiana at roughly 17 miles from Greenville and McKenzie at about 22 miles. Those figures represent straight-line distance between the mapped city points, not mileage along a highway. Driving distance can be longer because roads curve, exact starting points differ, and the most convenient route may not follow the direct line. The distance labels are therefore best used to compare relative separation rather than to plan a trip.
Large areas between the three highlighted towns appear almost empty on this simplified sheet, but that is a result of the map’s purpose rather than a statement about the land. Rural roads, homes, small communities, timberland, farms, tributaries, and low ridges fill the spaces between the labeled places. If you need the road context, return to the county map; if you want to understand what lies between the towns physically, the water and elevation sheets add much more detail.
Creeks, Lakes, and Ponds Across Butler County
Butler County does not have one dominant river running through the center of the map. Instead, a branching system of creeks spreads across much of the county. Pigeon Creek is especially prominent in the southeast, Rocky Creek occupies a central-southern corridor, and Panther Creek can be followed farther west. Persimmon Creek and Long Branch Creek add named drainage in the southwest, while many thinner tributaries connect these larger channels to smaller valleys.
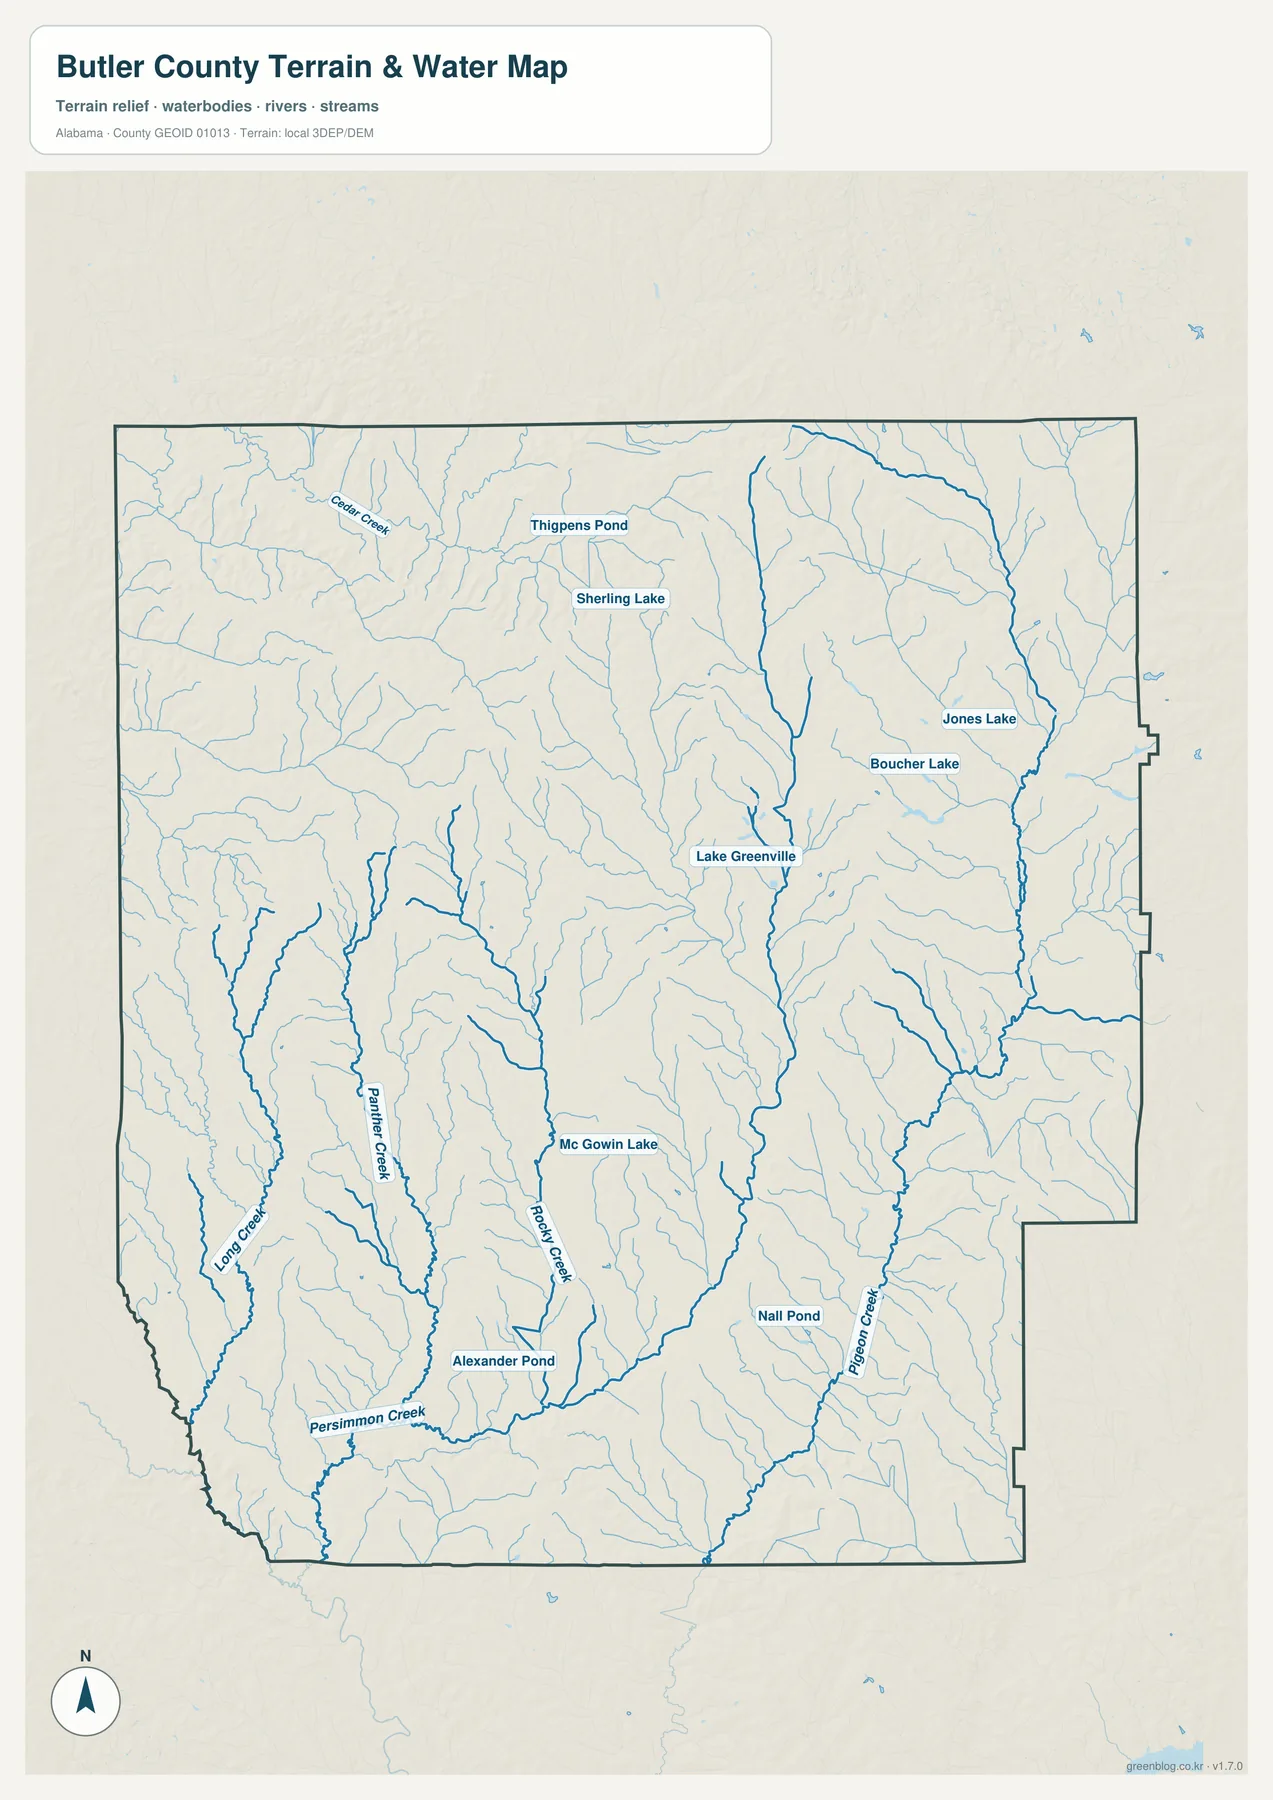
Several lakes and ponds are useful landmarks as well. Lake Greenville is labeled near the central part of the county, while Thigpens Pond and Sherling Lake appear farther north. Jones Lake and Boucher Lake are shown to the east, and Mc Gowin Lake, Alexander Pond, and Nall Pond add recognizable points in the southern half. Seeing these still-water features alongside the creek network makes it easier to match familiar local names with the wider drainage pattern.
The water sheet is intentionally generalized for county-scale viewing. It cannot show every farm pond, ditch, seasonal channel, wetland, or minor tributary, and the presence of a blue line does not describe flood frequency, access rights, or channel condition. For flood-risk decisions, construction, stream access, or site-specific land work, use current authoritative hydrography and hazard information rather than this overview map.
Uplands, Valleys, and Elevation Change
The elevation view reveals a landscape that looks much more varied than the road sheet alone suggests. Within this map, elevations range from about 56 meters to 177 meters, with a mean near 105 meters. Browns and tans indicate relatively higher ground, while greens mark lower terrain. The northern and northeastern parts of Butler County contain many small ridges and hollows, producing a tighter pattern of color and shaded relief.
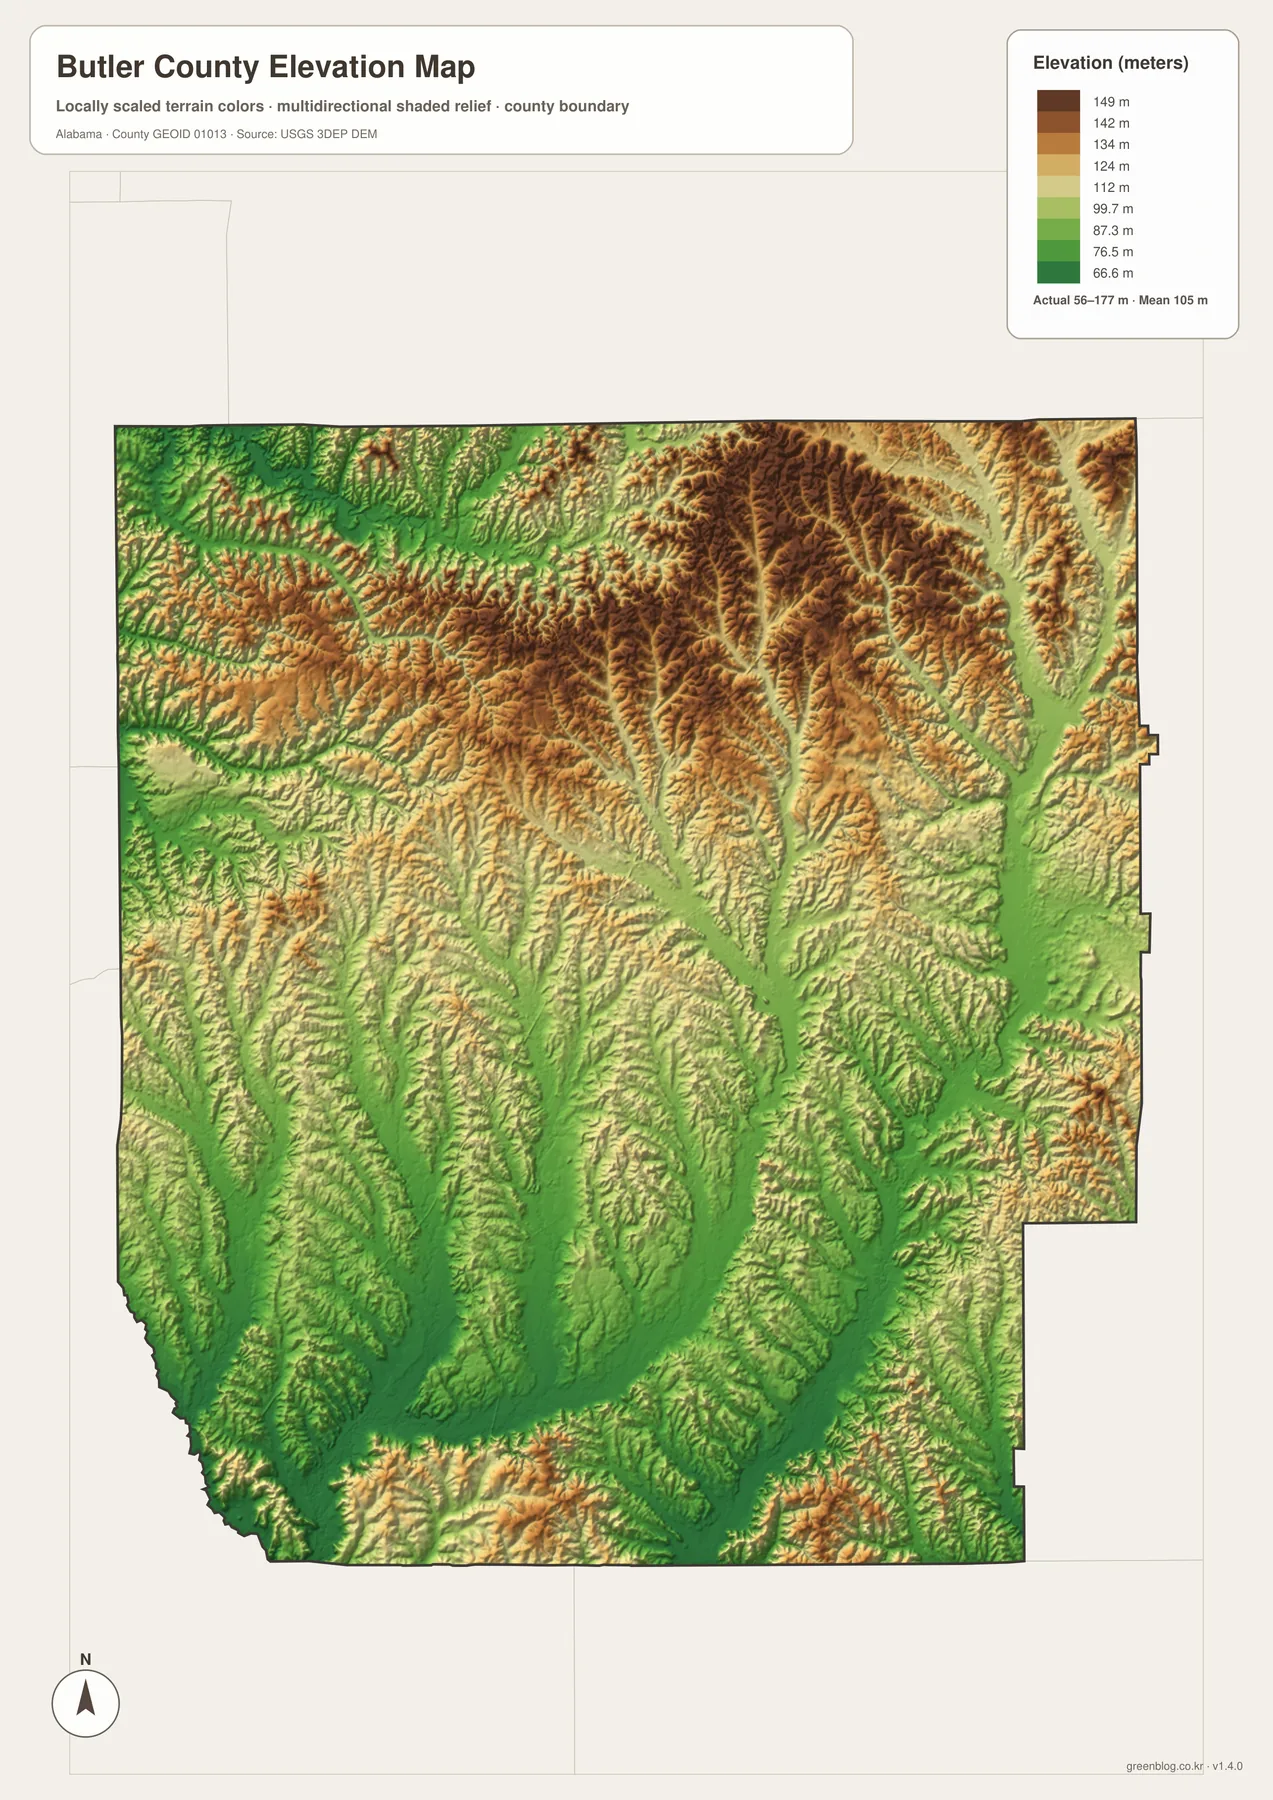
Lower green corridors become broader and more continuous toward the south. Comparing the terrain with the water map shows why many streams follow those passages. Pigeon Creek and Rocky Creek, for example, occupy lower corridors that stand out clearly against nearby higher ground. This side-by-side comparison is one of the most useful ways to understand the county: the water network is not simply a collection of isolated lines but is closely related to the valleys cut through the rolling landscape.
Greenville itself lies in rolling terrain rather than on a perfectly flat plain. Farther south toward Georgiana and McKenzie, lower areas become more extensive on the map, though ridges and smaller changes in relief remain present. The map is appropriate for seeing county-wide terrain differences, not for reading the exact elevation of a building site. Surveying, grading, drainage design, and other site-level work require detailed elevation data such as current USGS 3DEP products.
Choosing the Right Butler County Map
The best sheet depends on what you are trying to find. For a first look at Butler County, the road-and-boundary map is the most useful because Greenville, I-65, U.S. 31, and the southern towns provide familiar anchors. The city view is better when you only need to compare Greenville, Georgiana, and McKenzie without road clutter. Water features are much easier to follow on the hydrography sheet, while the elevation map is the better choice for understanding ridges, low corridors, and the broader difference between northern uplands and southern valleys.
Georgiana provides a good example of why separate views are helpful. On the county sheet, its relationship to U.S. 31 and the surrounding roads stands out. The city map makes its position south of Greenville immediately clear. The water view fills the nearby countryside with creeks that are absent from the simplified city sheet, and the elevation view shows the longer low corridors that become more common in the southern part of the county. No single map needs to carry every detail when each file can answer a different practical question clearly.
The downloadable originals are 2572 by 3638 pixels, matching A3 portrait proportions. That resolution provides more room for labels than a small webpage preview and is useful for classroom handouts, presentations, personal map collections, and printed reference sheets. If you print at a specific physical size, check your printer settings because many applications automatically scale pages to fit the available paper area.
Frequently Asked Questions
Are the 17-mile and 22-mile labels driving distances?
No. They are straight-line distances from Greenville to the mapped points for Georgiana and McKenzie. Actual driving mileage can be longer because roads do not follow a direct line and the exact start and destination points can vary.
Does the water map include every pond and small stream?
No. It is a county-scale reference map that emphasizes named creeks and selected lakes and ponds. Small farm ponds, ditches, seasonal channels, and minor tributaries may be omitted, so use current official hydrography when a specific water feature matters.
What is included in the downloadable ZIP?
The archive contains four high-resolution JPG files: a county road-and-boundary map, a city-connections map, a water map, and an elevation map. Each image is 2572 × 3638 pixels in A3 portrait proportions.
Can these maps be used for surveying, property boundaries, or flood decisions?
No. They are general reference maps created for readable county-scale viewing. Legal boundaries, parcel research, engineering, flood determinations, and emergency decisions should rely on the appropriate current authoritative datasets and agencies.
Map File Information
Download four high-resolution Butler County JPG maps in one ZIP archive: the county reference map, city-connections map, water map, and elevation map. Each file is 2572 × 3638 pixels in A3 portrait proportions.
- Included Files: 4 high-resolution A3 JPG maps
- File Type: JPG files in one ZIP archive
- Intended Use: Printing, education, presentations, and map-based projects
Related Maps
- Along the Cahaba Valley: Bibb County Alabama Map
- Calhoun County Alabama Map
- Cherokee County Alabama Map
Butler County Sources and References
For more detailed road, water, elevation, or county background information, the following sources provide useful official or regional references. The maps on this page are designed for clear general viewing, so current source data should take priority when precision matters.
- ALDOT Butler County road map — a more detailed reference for the county road network.
- USGS National Hydrography — authoritative U.S. hydrography information and datasets.
- USGS 3D Elevation Program — detailed elevation data and information about 3DEP coverage.
- Encyclopedia of Alabama: Butler County — regional background on the county’s history and geography.
- U.S. Census Bureau QuickFacts for Butler County — current demographic and statistical reference information.
- Alabama Population Density Map: Urban Clusters, County Totals and a Decade of Change
- Butler County Alabama Land Cover Map: Forest, Creek Wetlands & Greenville–Georgiana Development
Green Map creates custom-edited map images using open geographic data sources such as geoBoundaries, Natural Earth, OpenStreetMap, and government open data. These maps are edited visual materials, not raw data files, and are provided for education, documents, presentations, and graphic reference.