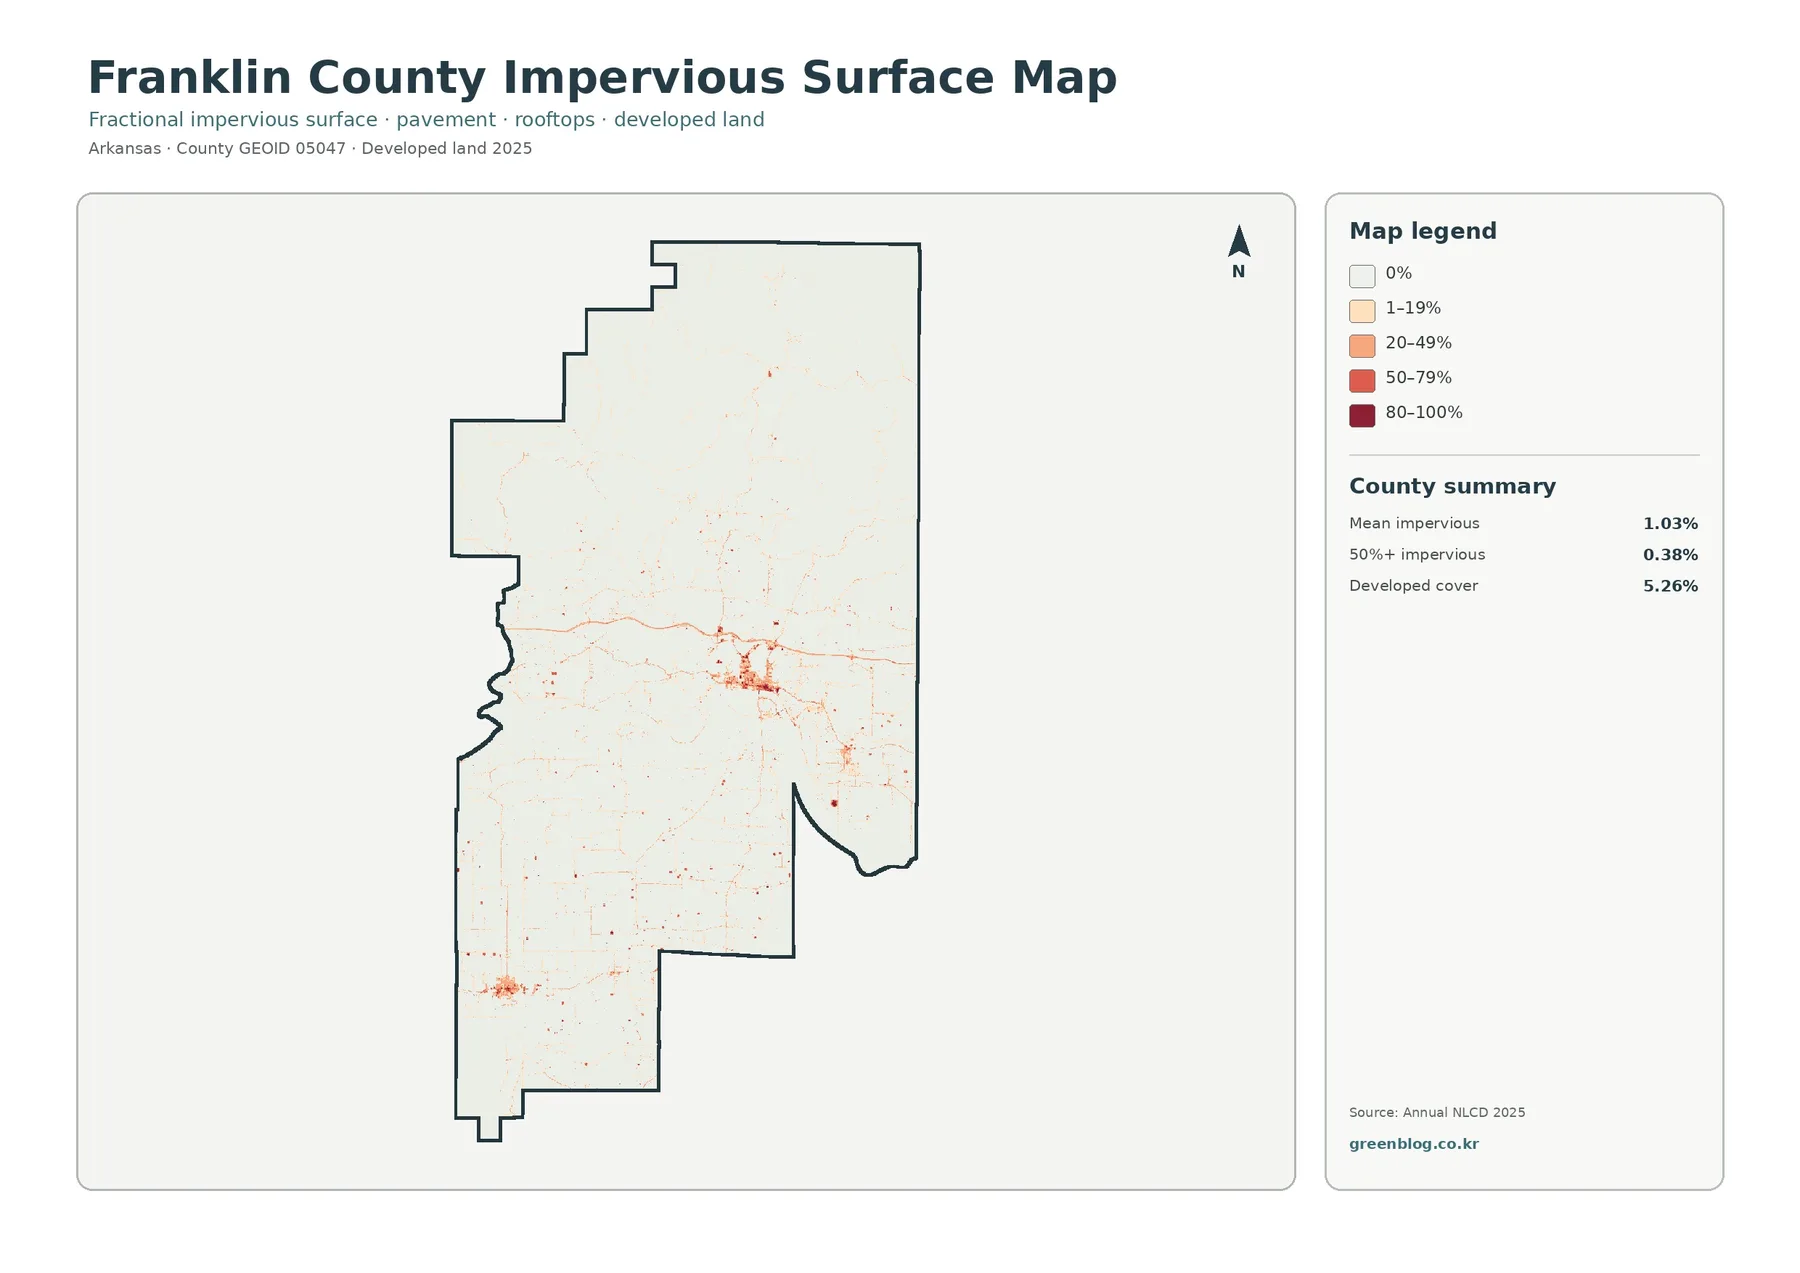
The Franklin County Arkansas Land Cover Map set shows a county where forest and agriculture dominate the 2025 surface but occupy different parts of the landscape. Forest accounts for 53.93% and is especially continuous across the north. Agriculture covers 36.52% and becomes much more prominent around the Arkansas River corridor and across the southern half. Developed land, water, grassland, shrubland, and wetlands fill smaller but locally important areas between those two major cover types.
Four map views are included: general land cover, forest and farmland, impervious surface with developed land, and a 1985–2025 class comparison. The four original 2480×1754-pixel JPG files are available together in one download. They can be used for classroom work, county comparisons, environmental interpretation, reports, and presentations that need either a current overview or a separate view of mapped change.
Table of Contents
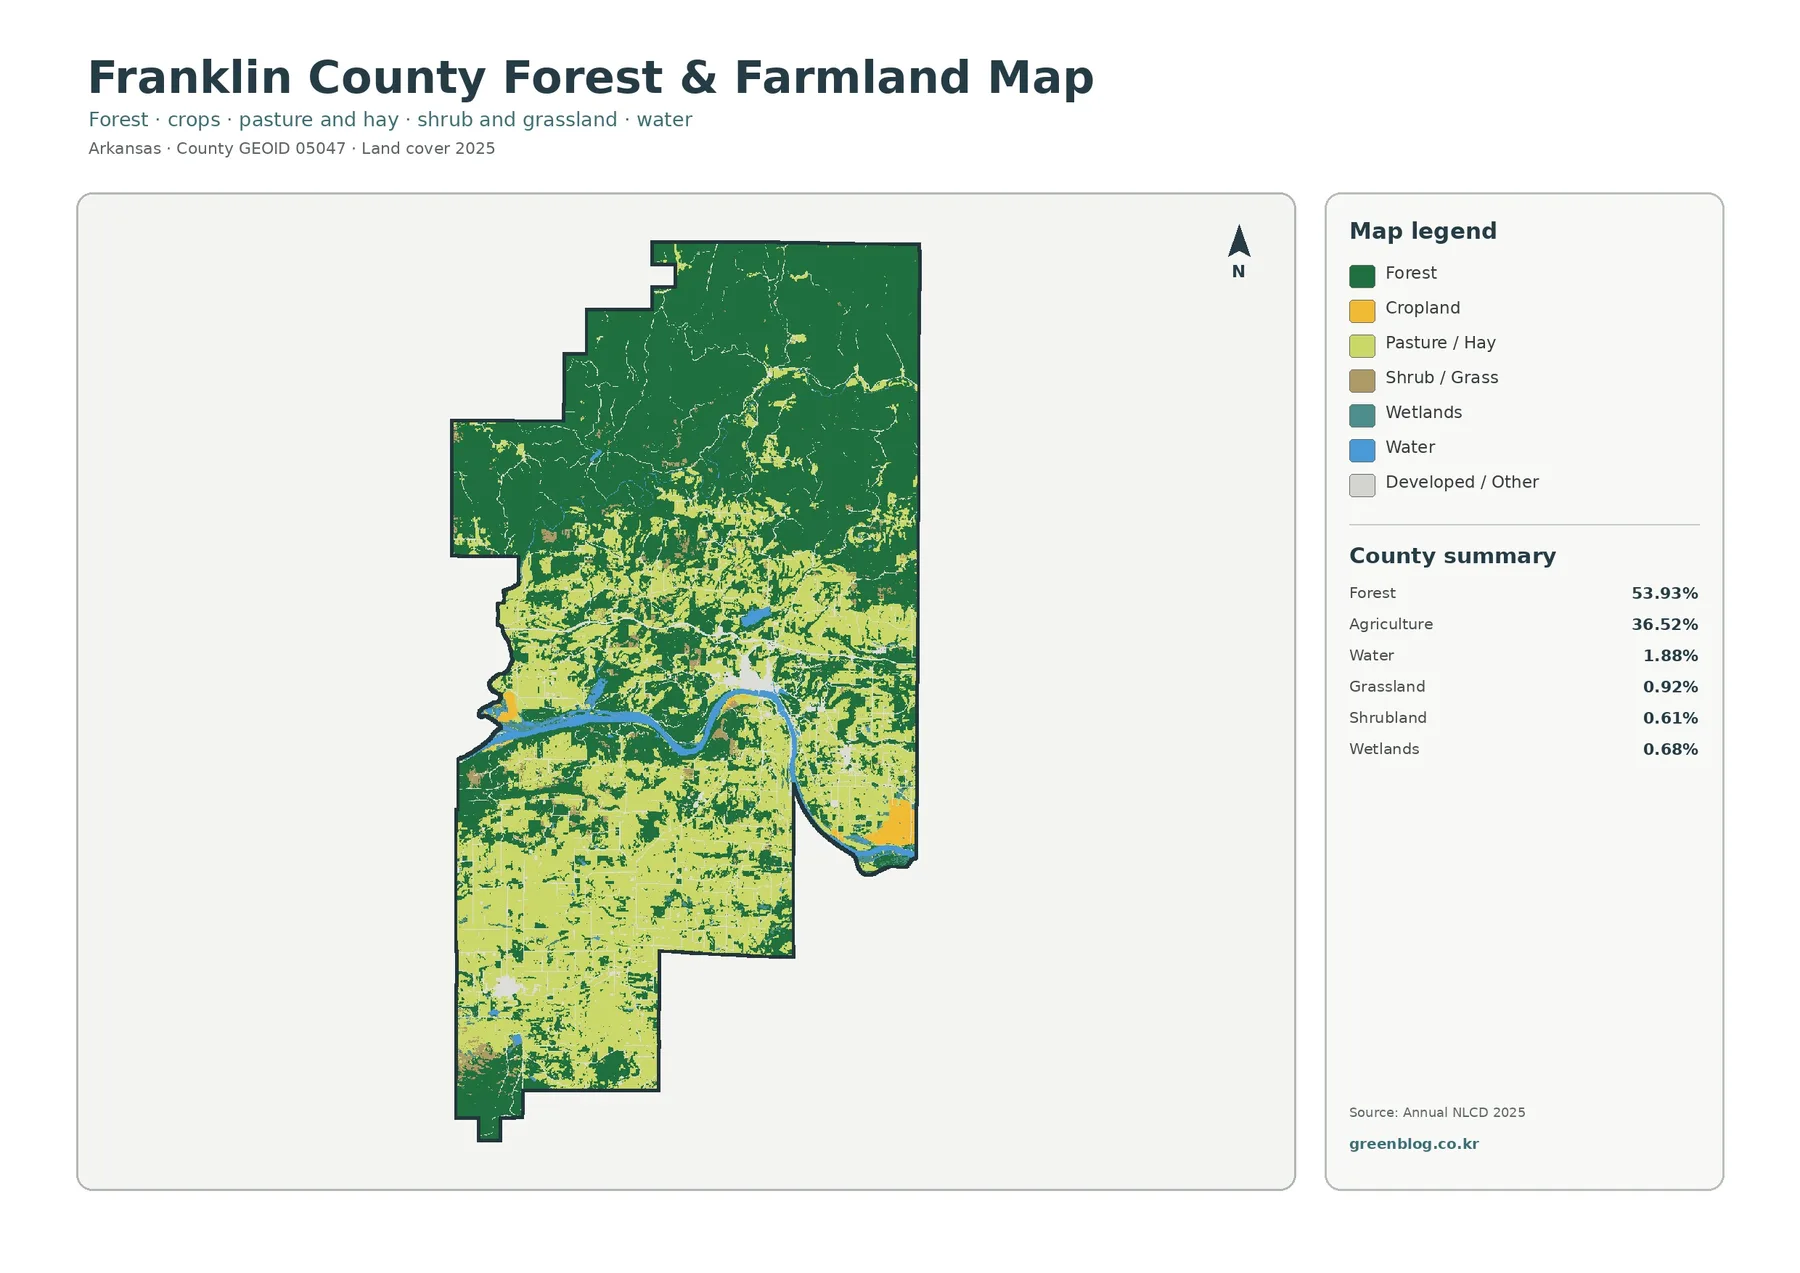
The Arkansas River organizes the county’s forest-to-farm contrast
A west-to-east river corridor cuts through the middle of Franklin County and provides a clear reference for comparing the two broad halves. North of the river, dark green forest forms large connected areas with agricultural openings scattered through valleys and lower terrain. South of the river, yellow agricultural cover becomes the more common background, while forest persists in irregular blocks, ridges, stream corridors, and along the southern edge.
Franklin County’s official history describes rugged terrain in the northern half and a mix of rolling farmland, forested ridges, and isolated mountains to the south. The land-cover map does not measure elevation, but that local description helps place the visible pattern in context. Water accounts for 1.88% and is led by the Arkansas River, while wetlands are only 0.68% in the forest-and-farmland summary and appear mainly as smaller patches and narrow corridors.
Ozark and Charleston stand out on the impervious-surface view
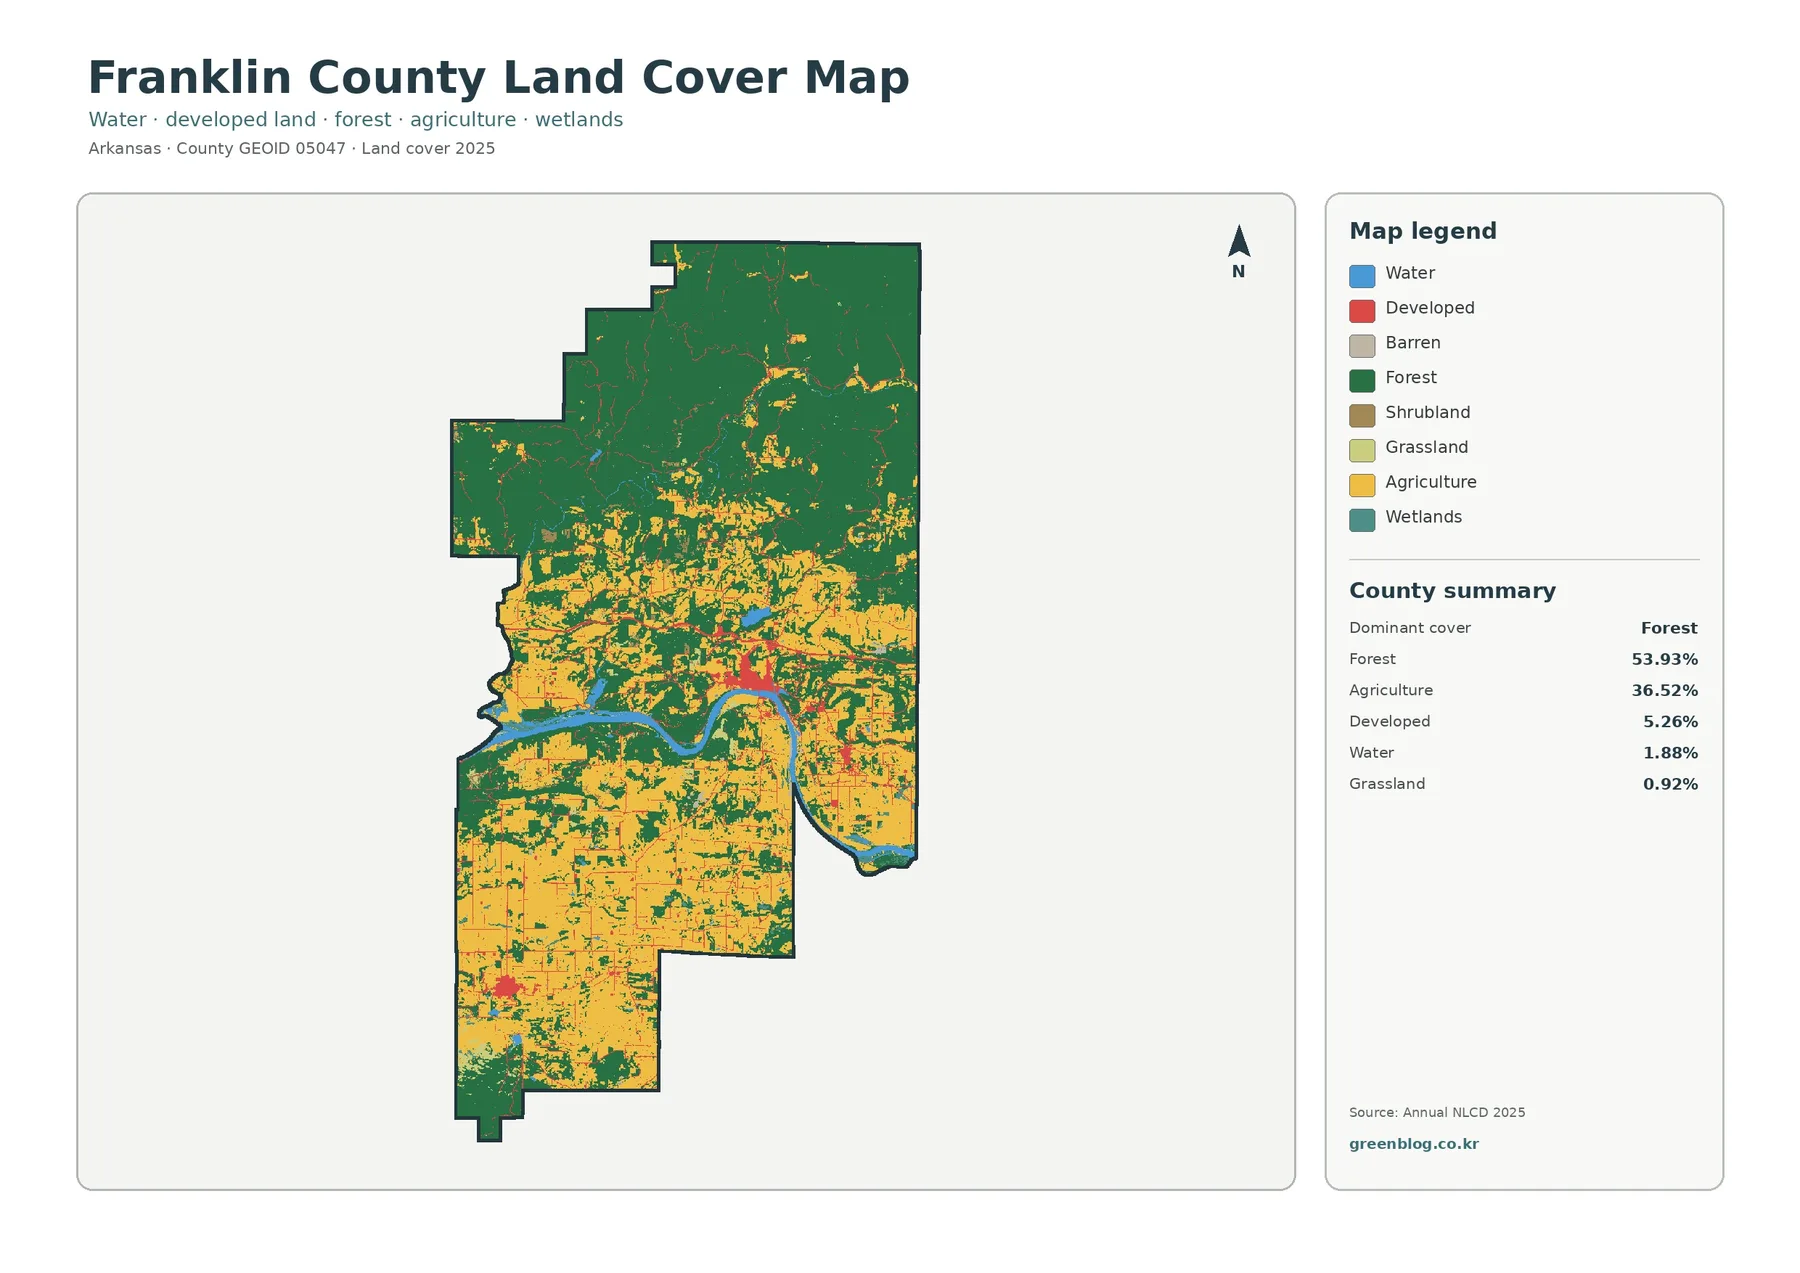
Impervious surface means rooftops, pavement, parking areas, and other hard materials that do not readily absorb rainfall. Franklin County has a mean impervious value of 1.03% in the supplied 2025 summary, while 0.38% of the county is mapped at 50% impervious or greater. Those numbers are much smaller than the 5.26% developed-land share because developed classes can also include lawns, trees, bare soil, and other permeable surfaces.
The strongest hard-surface concentration sits near the central Arkansas River corridor around Ozark. A second compact cluster appears farther south around Charleston, and thin linear traces extend outward from both areas along transportation routes. Smaller points occur elsewhere, but the northern forested part of the county remains mostly pale. The layer is useful for locating built-surface concentration, not for counting buildings, measuring traffic, or proving that a particular road caused development.
Forest and farmland become simpler to compare without most developed detail
The forest-and-farmland view keeps the major rural and natural classes in focus. Forest remains 53.93% and agriculture 36.52%, while water is 1.88%, grassland 0.92%, wetlands 0.68%, and shrubland 0.61%. With developed detail muted, the north looks even more continuously wooded and the broad agricultural blocks south of the river become easier to follow. Forest still breaks through the southern farm pattern in ridges, stream corridors, and irregular blocks.
Agriculture is not a single field type on this map. The category does not identify crop, farm operator, parcel boundary, zoning status, or ownership, and green forest pixels do not indicate whether land is public or private. County sources identify agriculture as an important local activity, while the University of Arkansas Cooperative Extension office serves Ozark, Charleston, Altus, and nearby communities with agriculture and natural-resource programs. The map adds the spatial picture without replacing those local records.
The 1985–2025 comparison records 11.28% overall class difference
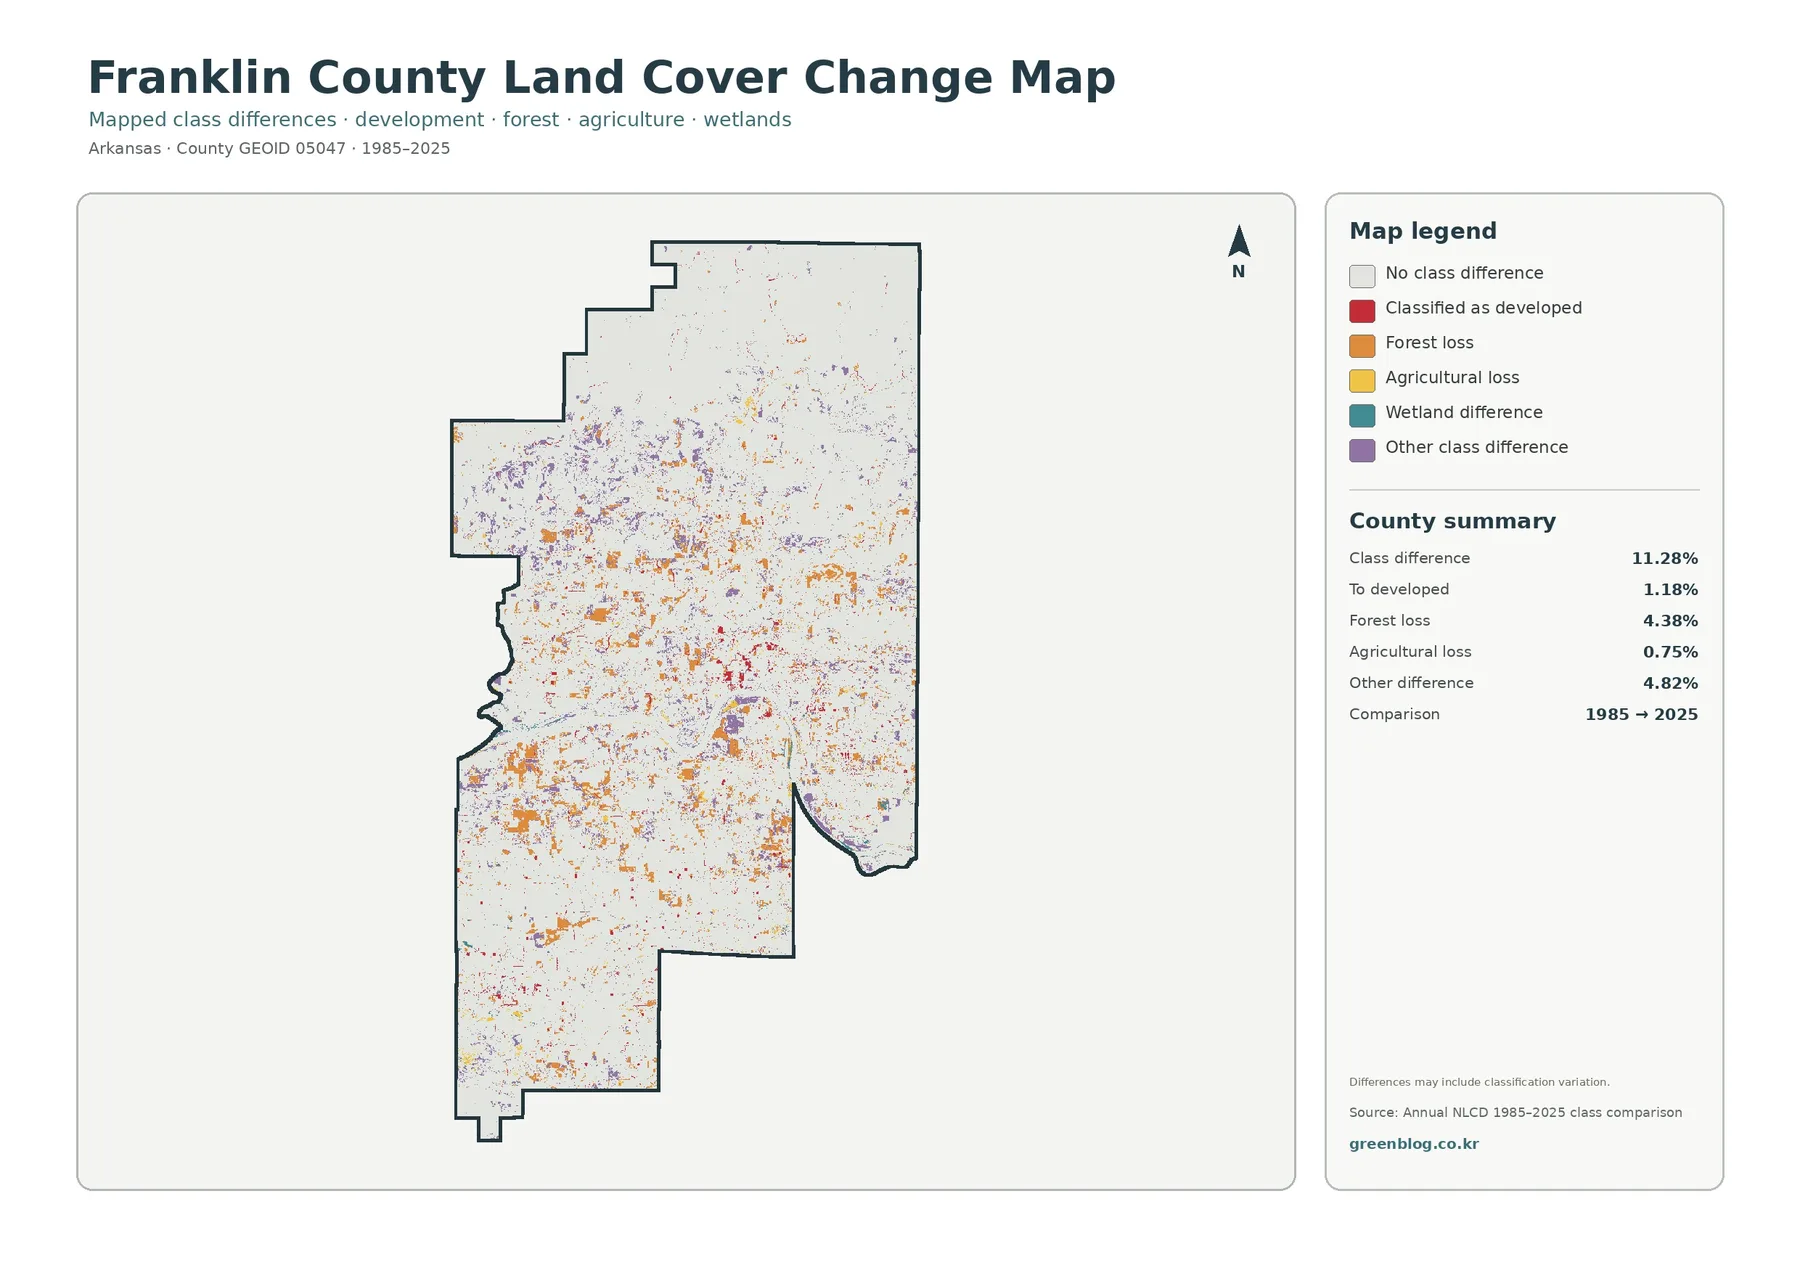
The change map compares the class assigned to each location in 1985 with the class assigned in 2025. The overall class-difference figure is 11.28%. The displayed summary identifies 1.18% as change to developed land, 4.38% as forest loss, 0.75% as agricultural loss, and 4.82% as other class difference; the legend also includes wetland difference. The total therefore cannot be used as a development rate.
Orange forest-loss marks are scattered across both the northern forest and the smaller wooded areas farther south. Red change-to-developed marks are most noticeable near present settlement concentrations and along thinner corridors. Yellow agricultural-loss marks are less extensive, while purple other-class differences appear in many irregular patches through the central and southern parts of the county. Change is distributed rather than confined to one single growth front.
Each change color records a difference between two mapped classes, not the cause of that difference. A forest-loss cell could have changed to agriculture, development, grass, or another class. Raster cells can also contain several surface types at once, especially near forest-field and river-edge boundaries, so a small mapped difference may partly reflect classification variation. Intermediate Annual NLCD years or historical imagery are needed to reconstruct the exact transition.
Choose the map according to the question
For a one-page county overview, the general land-cover image is the strongest starting point because it keeps forest, agriculture, development, water, and smaller classes together. The forest-and-farmland view is better for comparing rural cover without the distraction of detailed developed colors. When the subject is settlement or hard surfaces, the impervious layer separates the compact Ozark and Charleston concentrations from the much lighter rural background.
Historical comparison works best after the current pattern is familiar. Present forest gives context to orange forest-loss patches, and present settlement areas help orient red change-to-developed marks. Placing the maps side by side is more informative than treating the change layer alone as a list of events, because the current land-cover images show what surrounds each marked difference today.
Scale, date, and original image size set practical limits
These maps are countywide raster classifications rather than parcel surveys. Narrow roads, small ponds, isolated houses, and complicated boundaries between forest and fields can be generalized. The current land-cover and impervious products are labeled 2025, so construction, clearing, farming changes, or river-edge changes after that observation period may not appear. Site-specific work should add recent aerial imagery, field checks, parcel information, and appropriate local records.
Each source JPG is 2480×1754 pixels and is kept at that original size rather than being artificially enlarged to claim a higher print resolution. The WebP previews are convenient for quick browsing, while the original JPGs are the better choice when a report, worksheet, or slide deck needs the full source image provided with the map package.
Download the four Franklin County land-cover JPGs
The ZIP contains general land cover, forest and farmland, impervious surface with developed land, and the 1985–2025 land-cover comparison. Because all four use the same county boundary, they can be placed side by side without changing the geographic frame.
Frequently Asked Questions
What is the largest 2025 land-cover class in Franklin County?
Forest is the largest class at 53.93%, followed by agriculture at 36.52%. Forest is especially extensive across the north, while agricultural cover becomes broader around and south of the Arkansas River. Developed land accounts for 5.26% and water for 1.88%.
Why is developed land 5.26% when mean impervious surface is only 1.03%?
Developed land can contain roofs and pavement together with lawns, trees, soil, and other permeable surfaces. The impervious layer measures only the harder fraction that resists water infiltration. In Franklin County, 0.38% of the county is mapped at 50% impervious or greater.
Does the 11.28% class difference mean that 11.28% of Franklin County became developed?
No. The 11.28% figure includes every location assigned a different mapped class in 1985 and 2025. Only 1.18% is specifically categorized as change to developed land. Forest loss, agricultural loss, wetland differences, other class differences, and some classification variation are also part of the comparison.
Map File Information
The ZIP contains the four original Franklin County land-cover JPG maps described on this page.
- File Type: four JPG images in one ZIP archive
Related Maps
- A Craighead County Arkansas Land Cover Map
- Arkansas County Arkansas Land Cover Map
- Ashley County Arkansas Land Cover Map
Sources and reference material
- MRLC Annual NLCD Data – official access to current and historical Annual NLCD land-cover products.
- USGS Annual NLCD Land Cover Classification – definitions for developed, forest, agriculture, wetlands, water, and other mapped classes.
- Franklin County official history – county background on the Arkansas River, rugged northern terrain, rolling farmland, forested ridges, and agriculture.
- University of Arkansas Cooperative Extension Service – Franklin County – local agriculture and natural-resource programs serving Ozark, Charleston, Altus, and surrounding communities.
Green Map creates custom-edited map images using open geographic data sources such as geoBoundaries, Natural Earth, OpenStreetMap, and government open data.
These maps are edited visual materials, not raw data files, and are provided for education, documents, presentations, and graphic reference.