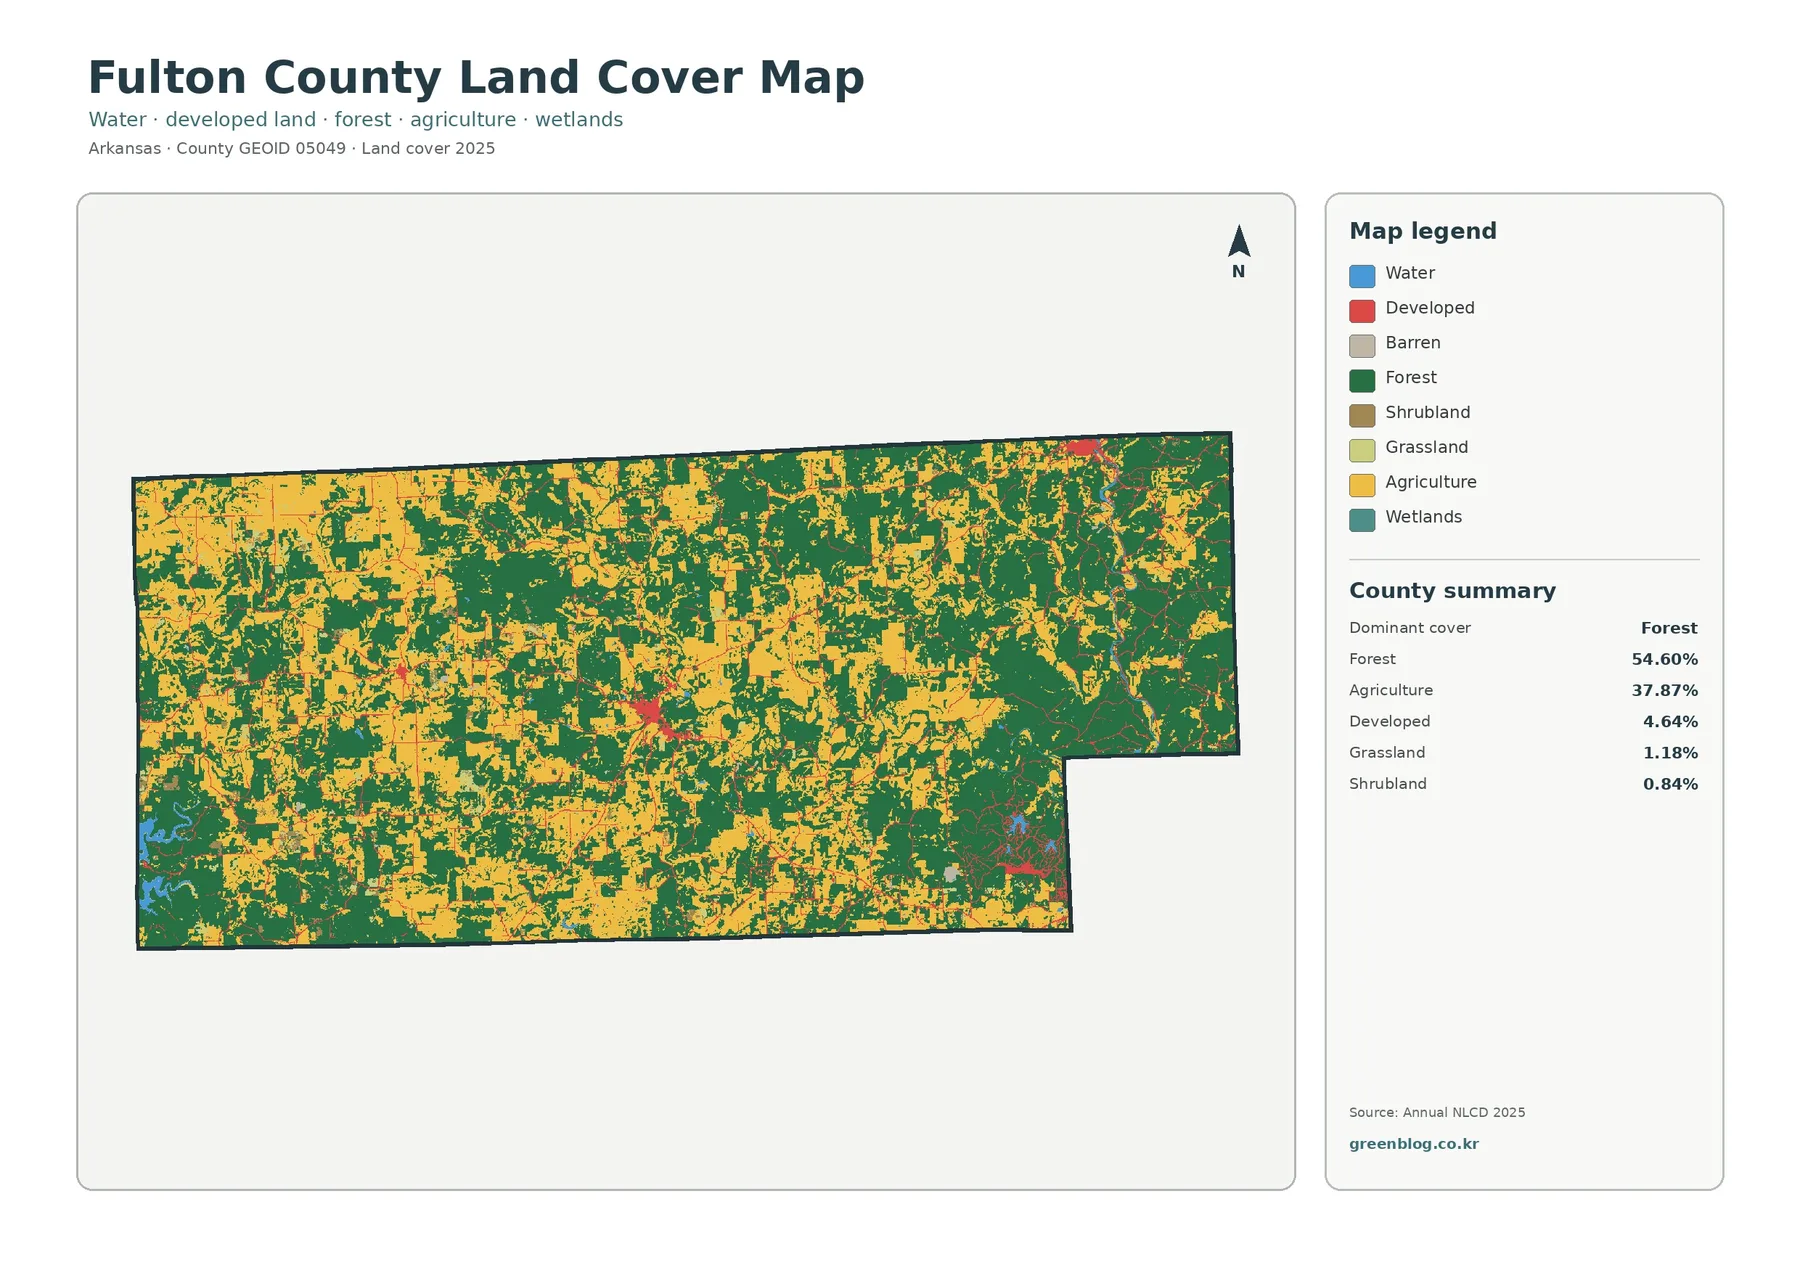
The Fulton County Arkansas Land Cover Map set presents a rural county where forest covers 54.60% of the 2025 surface and agriculture accounts for 37.87%. The eastern side is noticeably more wooded, especially through the long northeastern extension, while the west and center contain a tighter patchwork of forest and agricultural cover. Developed land is much smaller at 4.64%, yet several compact settlement areas still stand out when the maps are compared.
This page provides four views of the same county boundary: current land cover, forest and farmland, impervious surface with developed land, and a 1985–2025 class comparison. The four original 2480×1754-pixel JPG maps are available together in one download. They are useful for county reference, environmental education, classroom comparison, presentations, and reports that need either a current surface overview or a separate look at mapped change.
Table of Contents
Forest dominates the east while farms break up the west and center
Dark green forest is the strongest color across Fulton County, but its distribution matters as much as the countywide percentage. Large wooded areas become more continuous toward the east and northeast. Across the west and much of the center, yellow agricultural cover appears more often between green blocks, producing a finer-grained rural mosaic. That contrast is easy to miss in a simple table because the county average combines two visibly different parts of the landscape.
Fulton County government describes the county as generally rugged and hilly and notes that substantial pastureland supports cattle, poultry, and feed production. That local description helps explain why wooded and agricultural surfaces can both be important in the same county. It should not be used to label every agricultural pixel as pasture, however. Annual NLCD agriculture is a mapped surface category, not a parcel-by-parcel record of crop type, farm operator, ownership, or legal land use.
The simplified forest-and-farmland view makes the rural contrast easier to follow
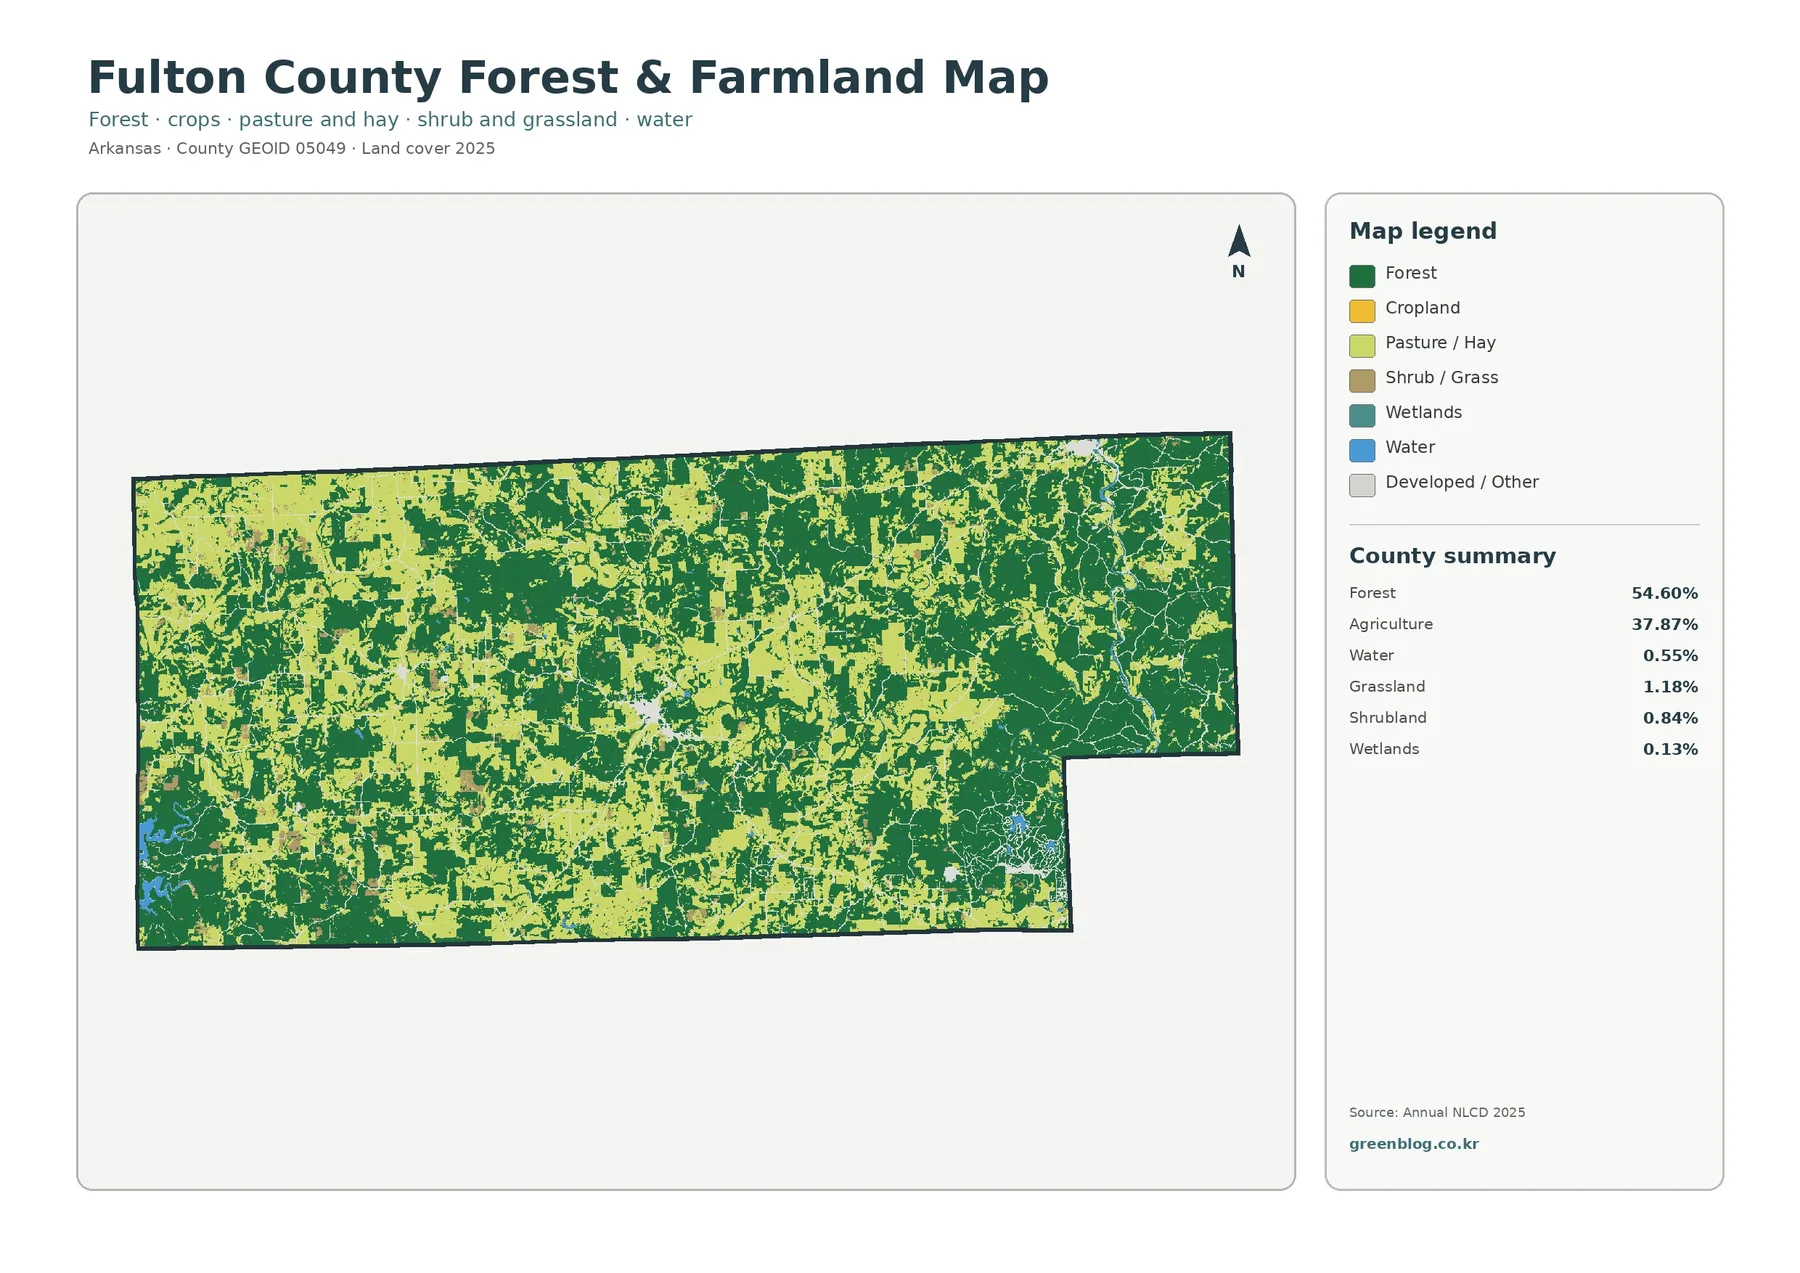
Removing most developed detail makes the major rural cover types much easier to compare. Forest remains 54.60% and agriculture 37.87%, while water is 0.55%, grassland 1.18%, shrubland 0.84%, and wetlands 0.13%. On this version, the long eastern section reads as a broad green zone, whereas the western half contains many more light agricultural openings that divide the forest into smaller pieces.
Land cover is not zoning. A green cell does not say whether a forest is public or private, and an agricultural cell does not determine whether the land is legally protected, available for development, or part of a particular farm. The classification describes what the surface looked like to the dataset at the mapped date. Parcel boundaries, deeds, planning regulations, and current aerial imagery are separate sources and should be added when the question moves from countywide pattern to a specific property.
Hard surfaces stay limited but form distinct central and northeastern clusters
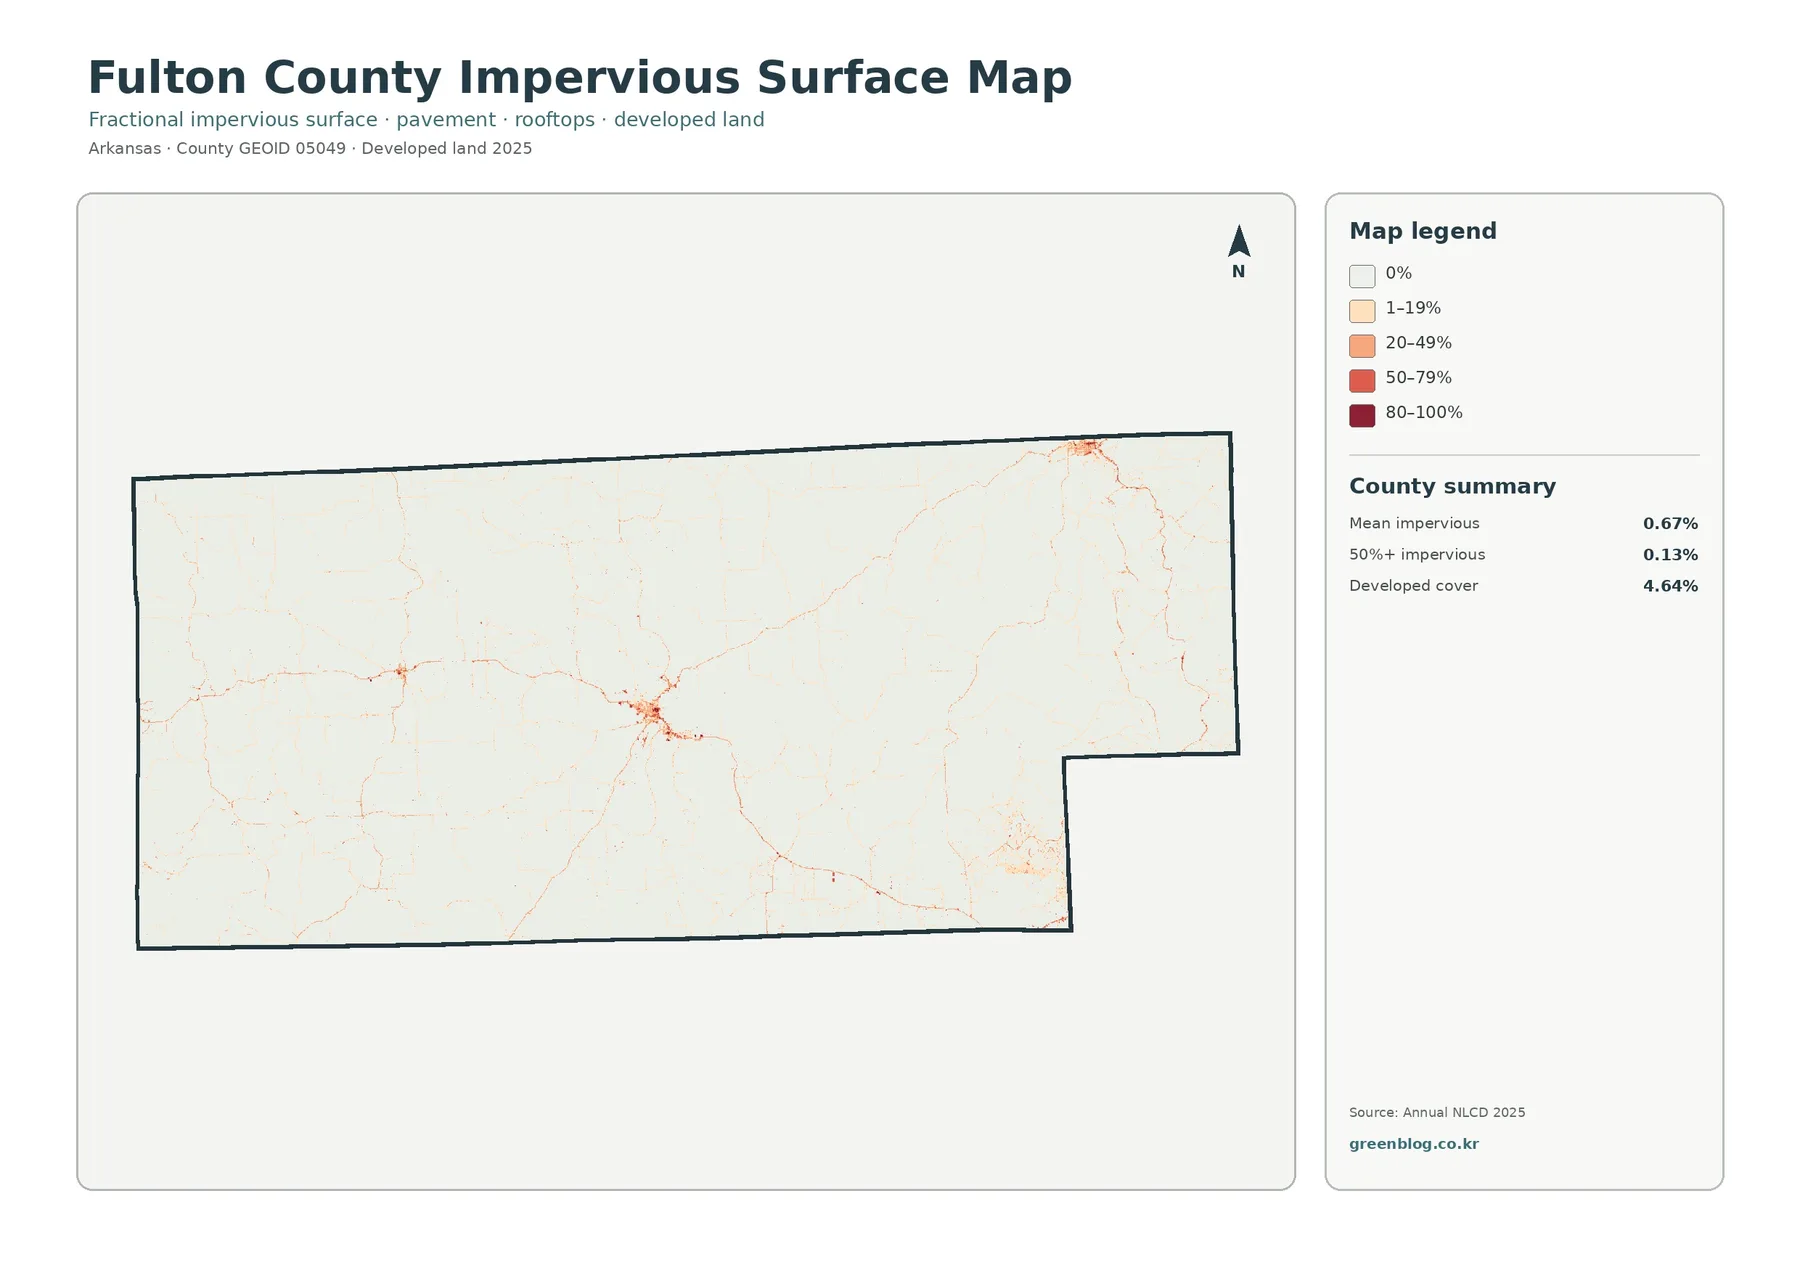
Impervious surface means pavement, rooftops, parking areas, and other hard materials that do not readily absorb rainfall. The supplied 2025 summary gives Fulton County a mean impervious value of just 0.67%, and only 0.13% of the county is mapped at 50% impervious or greater. That is far below the 4.64% developed-land share because developed classes can also include lawns, trees, bare soil, and other surfaces that still allow some water infiltration.
Most of the county appears very pale on this layer, which is consistent with a largely rural landscape. A stronger cluster sits near the middle of the county and another concentration appears at the far northeastern edge. Fulton County’s official site identifies Salem as the county seat near the center, where U.S. Highway 62-412 and State Highway 9 meet, and it also identifies Mammoth Spring as a major community in the county. Those locations provide useful orientation for the two more visible clusters, although the map alone does not establish that a specific road caused development.
The 1985–2025 comparison is driven more by forest loss than development
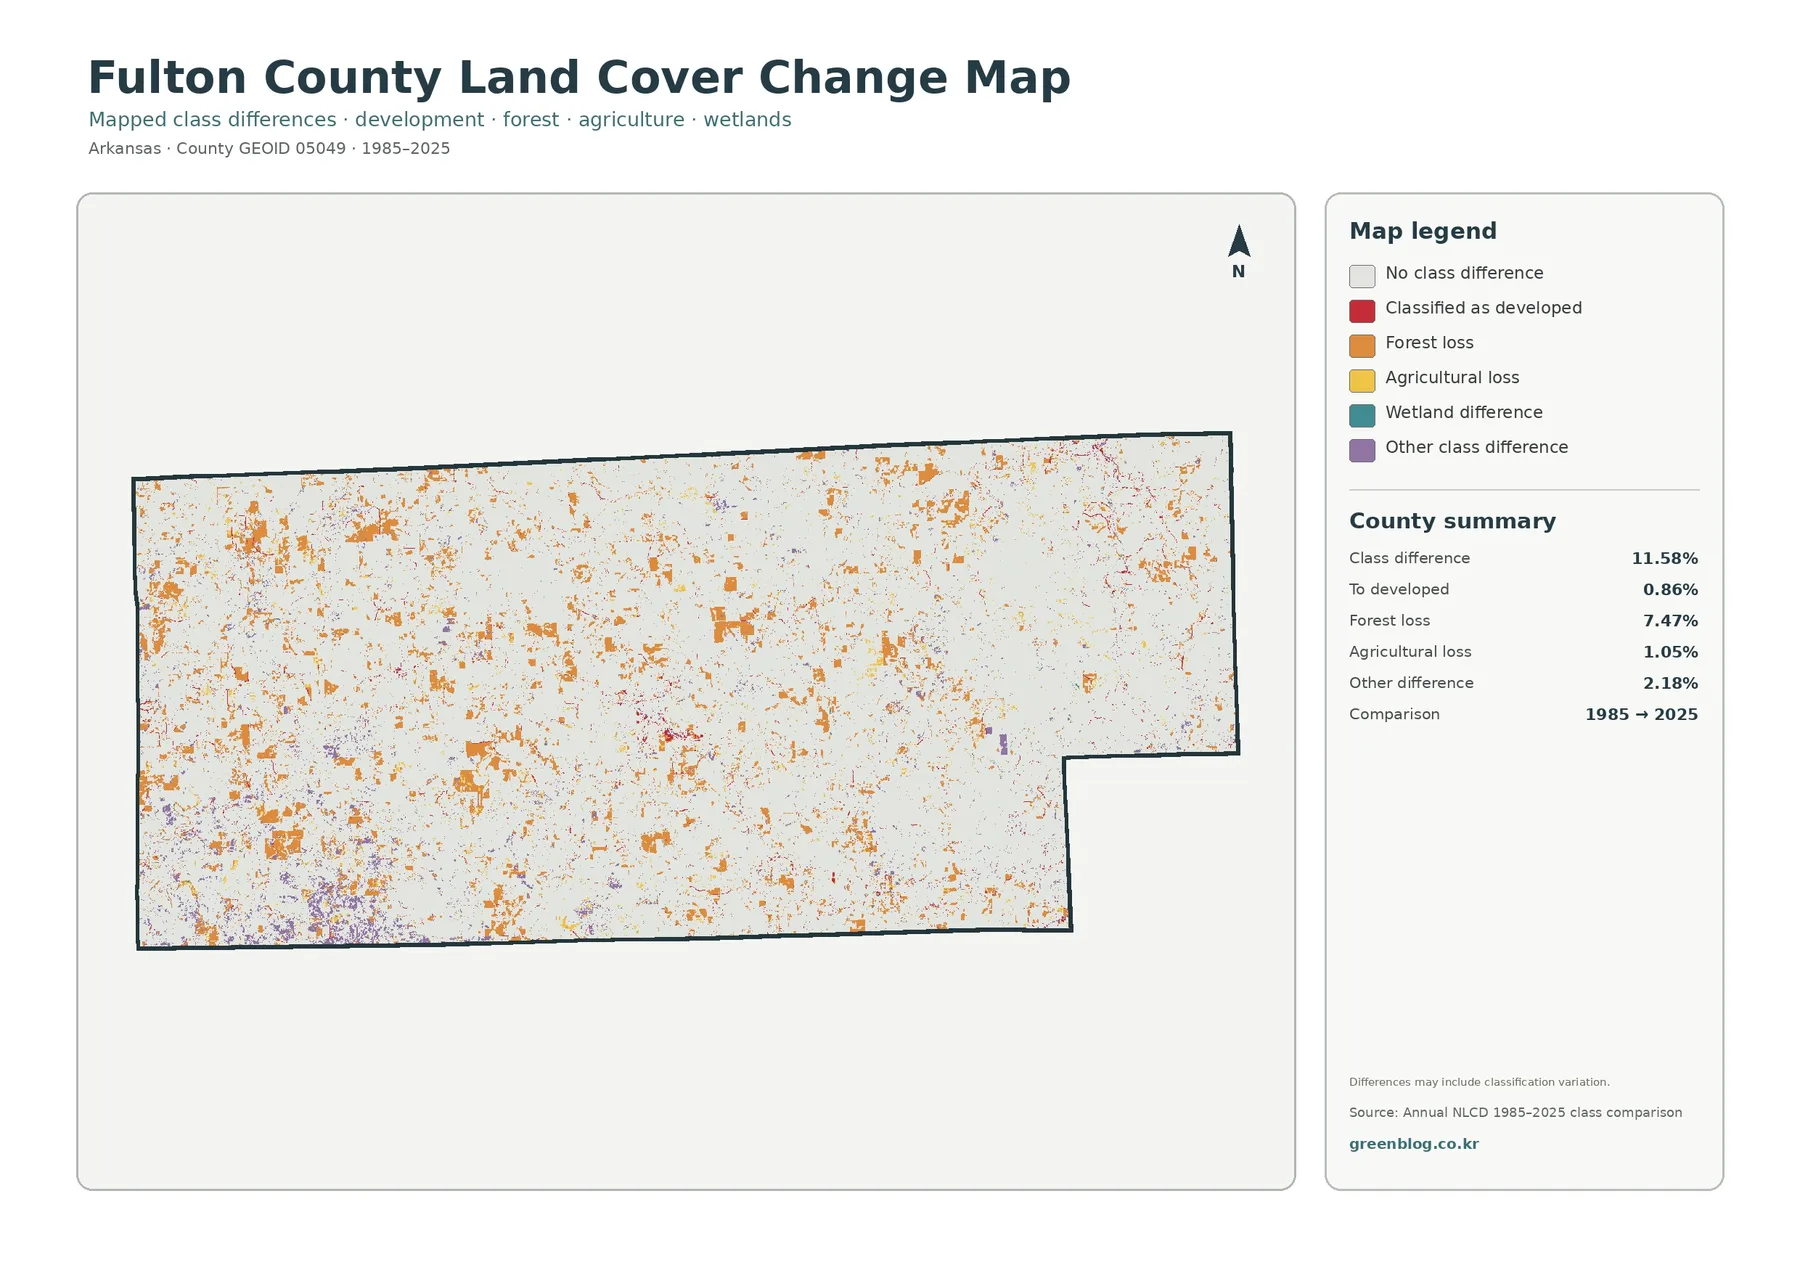
The change map compares the class assigned to each location in 1985 with its class in 2025. Overall class difference is 11.58%. The summary identifies 0.86% as change to developed land, 7.47% as forest loss, 1.05% as agricultural loss, and 2.18% as other class difference; wetland difference is also represented in the legend. These categories make it clear that the 11.58% total is not a development rate.
Orange forest-loss marks are scattered across much of the county and form several stronger patches in the west and center. Red change-to-developed marks cover much less area and are more localized around present settlement concentrations and narrow corridors. Yellow agricultural-loss marks are smaller again, while purple other-class differences appear irregularly, including in the southwest and around transitions between major cover types. The map therefore records many distributed changes rather than one single front moving across Fulton County.
A forest-loss cell only tells us that a place mapped as forest in 1985 received another class in 2025. It does not identify the cause. Timber activity, agriculture, development, vegetation change, or classification differences could all require separate evidence. The map itself warns that class differences may include classification variation, so small isolated marks should not be treated as individual historical events without checking intermediate Annual NLCD years or aerial imagery.
Reading the current maps before the change layer prevents misleading conclusions
The current map gives the change layer a geographic frame. A forest-loss patch has a different meaning when it sits inside today’s large eastern woodland than when it appears along a fragmented forest-farm boundary in the west. Likewise, a red change-to-developed mark can be compared with the impervious layer to see whether the present location now belongs to a stronger hard-surface cluster or remains a relatively light rural area.
Each view answers a different practical question
For a general county profile, start with the full land-cover map. It shows the dominant wooded east, the more mixed western farm country, developed clusters, and smaller natural classes in one image. The forest-and-farmland version is better when the main subject is rural land because it strips away much of the developed detail and makes the forest-agriculture contrast easier to explain.
Countywide raster classifications are informative but not parcel surveys
Annual NLCD is a raster classification, meaning the landscape is represented as a grid of cells. A single cell can contain several real surfaces, such as forest beside a road or a building surrounded by grass, yet the dataset still has to assign a class or percentage. These mixed pixels are one reason narrow features and complicated boundaries may appear simplified when the map is viewed at county scale.
The current land-cover and impervious products in this package are labeled 2025, while the historical view compares 1985 with 2025. Construction, farming changes, forest management, stream changes, or new infrastructure after the observation period will not necessarily appear. Property decisions should use current parcel records, recent imagery, field checks, and relevant local regulations in addition to a countywide land-cover map.
Download the four Fulton County land-cover JPG maps
The download contains the general land-cover map, forest-and-farmland map, impervious/developed-land map, and 1985–2025 land-cover change map. Keeping the four originals together makes it easy to move from current county pattern to a more focused rural, developed, or historical comparison without changing the boundary.
Frequently Asked Questions
What is the largest 2025 land-cover class in Fulton County?
Forest is the largest class at 54.60%, followed by agriculture at 37.87%. Developed land is 4.64%, grassland is 1.18%, and shrubland is 0.84%. The forest is especially continuous toward the east and northeast, while agriculture appears more frequently through the west and center.
Why is developed land 4.64% when mean impervious surface is only 0.67%?
Developed land can include rooftops and pavement together with lawns, trees, soil, and other permeable cover. The impervious layer measures the hard fraction more directly. In Fulton County, only 0.13% of the county is mapped at 50% impervious or greater, so the strongest hard-surface areas remain compact.
Does 11.58% class difference mean that 11.58% of Fulton County became developed?
No. The 11.58% figure includes every location that received a different mapped class in 1985 and 2025. Change to developed land is listed separately at 0.86%. Forest loss is 7.47%, agricultural loss is 1.05%, other class difference is 2.18%, and the legend also includes wetland difference. Some small differences may reflect classification variation.
Map File Information
The ZIP contains the four original Fulton County land-cover JPG maps described on this page.
- File Type: four JPG images in one ZIP archive
Related Maps
- A Craighead County Arkansas Land Cover Map
- Arkansas County Arkansas Land Cover Map
- Ashley County Arkansas Land Cover Map
Sources and reference material
- MRLC Annual NLCD Data – official access to current and historical Annual NLCD land-cover products.
- USGS Annual NLCD Land Cover Classification – definitions for developed, forest, agriculture, wetlands, water, and other classes.
- U.S. Census Bureau TIGER/Line Shapefiles – official county-boundary and geographic reference data.
- Fulton County AR Government – official local information on county terrain, Salem, Mammoth Spring, highways, and agriculture.
Green Map creates custom-edited map images using open geographic data sources such as geoBoundaries, Natural Earth, OpenStreetMap, and government open data.
These maps are edited visual materials, not raw data files, and are provided for education, documents, presentations, and graphic reference.