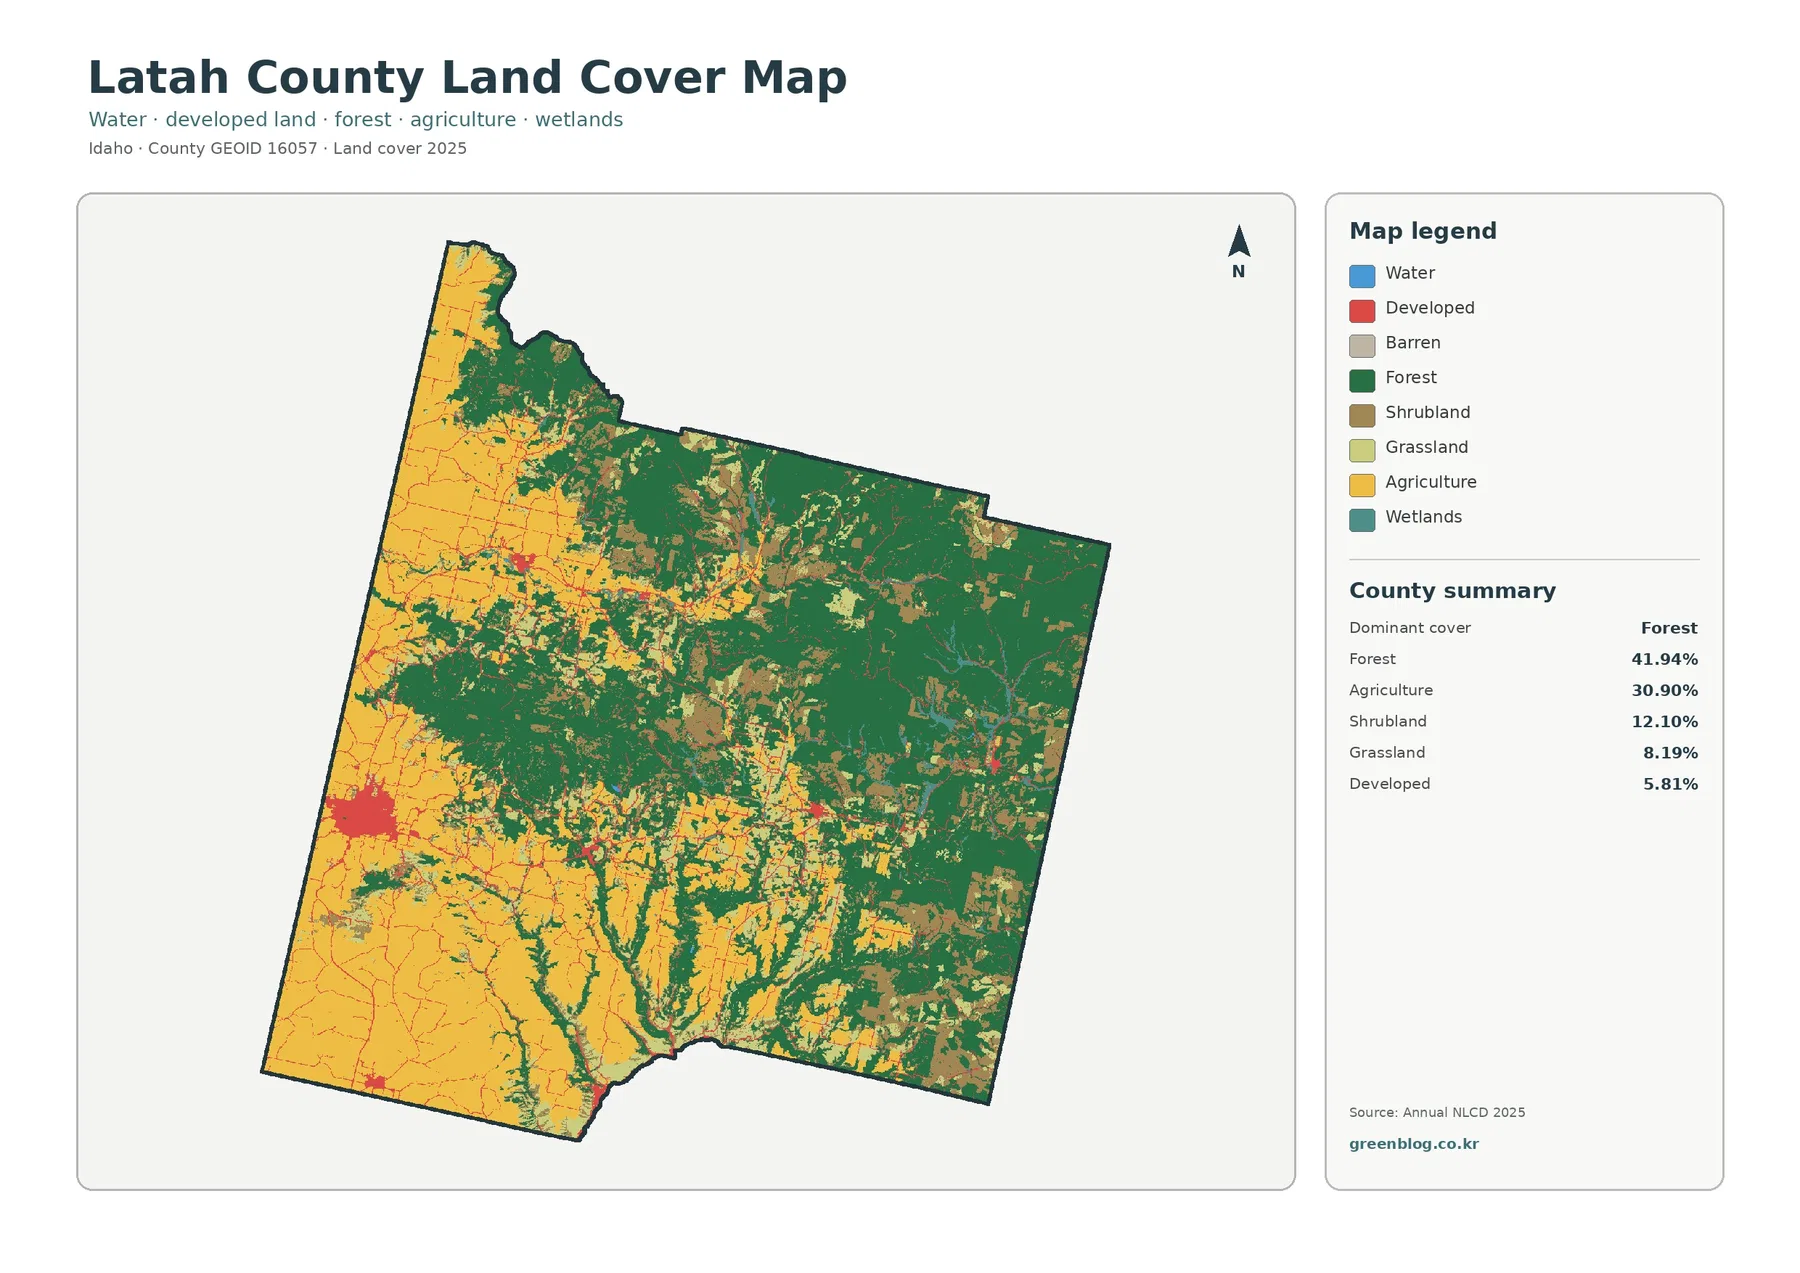
Latah County sits in northern Idaho where the cultivated Palouse meets a much more forested eastern landscape. The 2025 land-cover summary classifies 41.94% of the county as forest and 30.90% as agriculture, with shrubland at 12.10%, grassland at 8.19%, and developed land at 5.81%. Those percentages are not spread evenly. Broad cropland dominates much of the west and southwest, while forest becomes increasingly continuous toward the east and northeast. Moscow stands out as the largest developed concentration within that broader rural pattern.
Four views on this page let you examine the county from different angles: current land cover, forest and farmland, impervious/developed surfaces, and mapped class differences between 1985 and 2025. The four original JPG maps are also available together in one ZIP. They are useful for county-scale reference, teaching, presentations, and preliminary environmental review, but they do not show parcel boundaries, zoning, ownership, or development rights.
Table of Contents
Start with Moscow, then follow the surface pattern outward
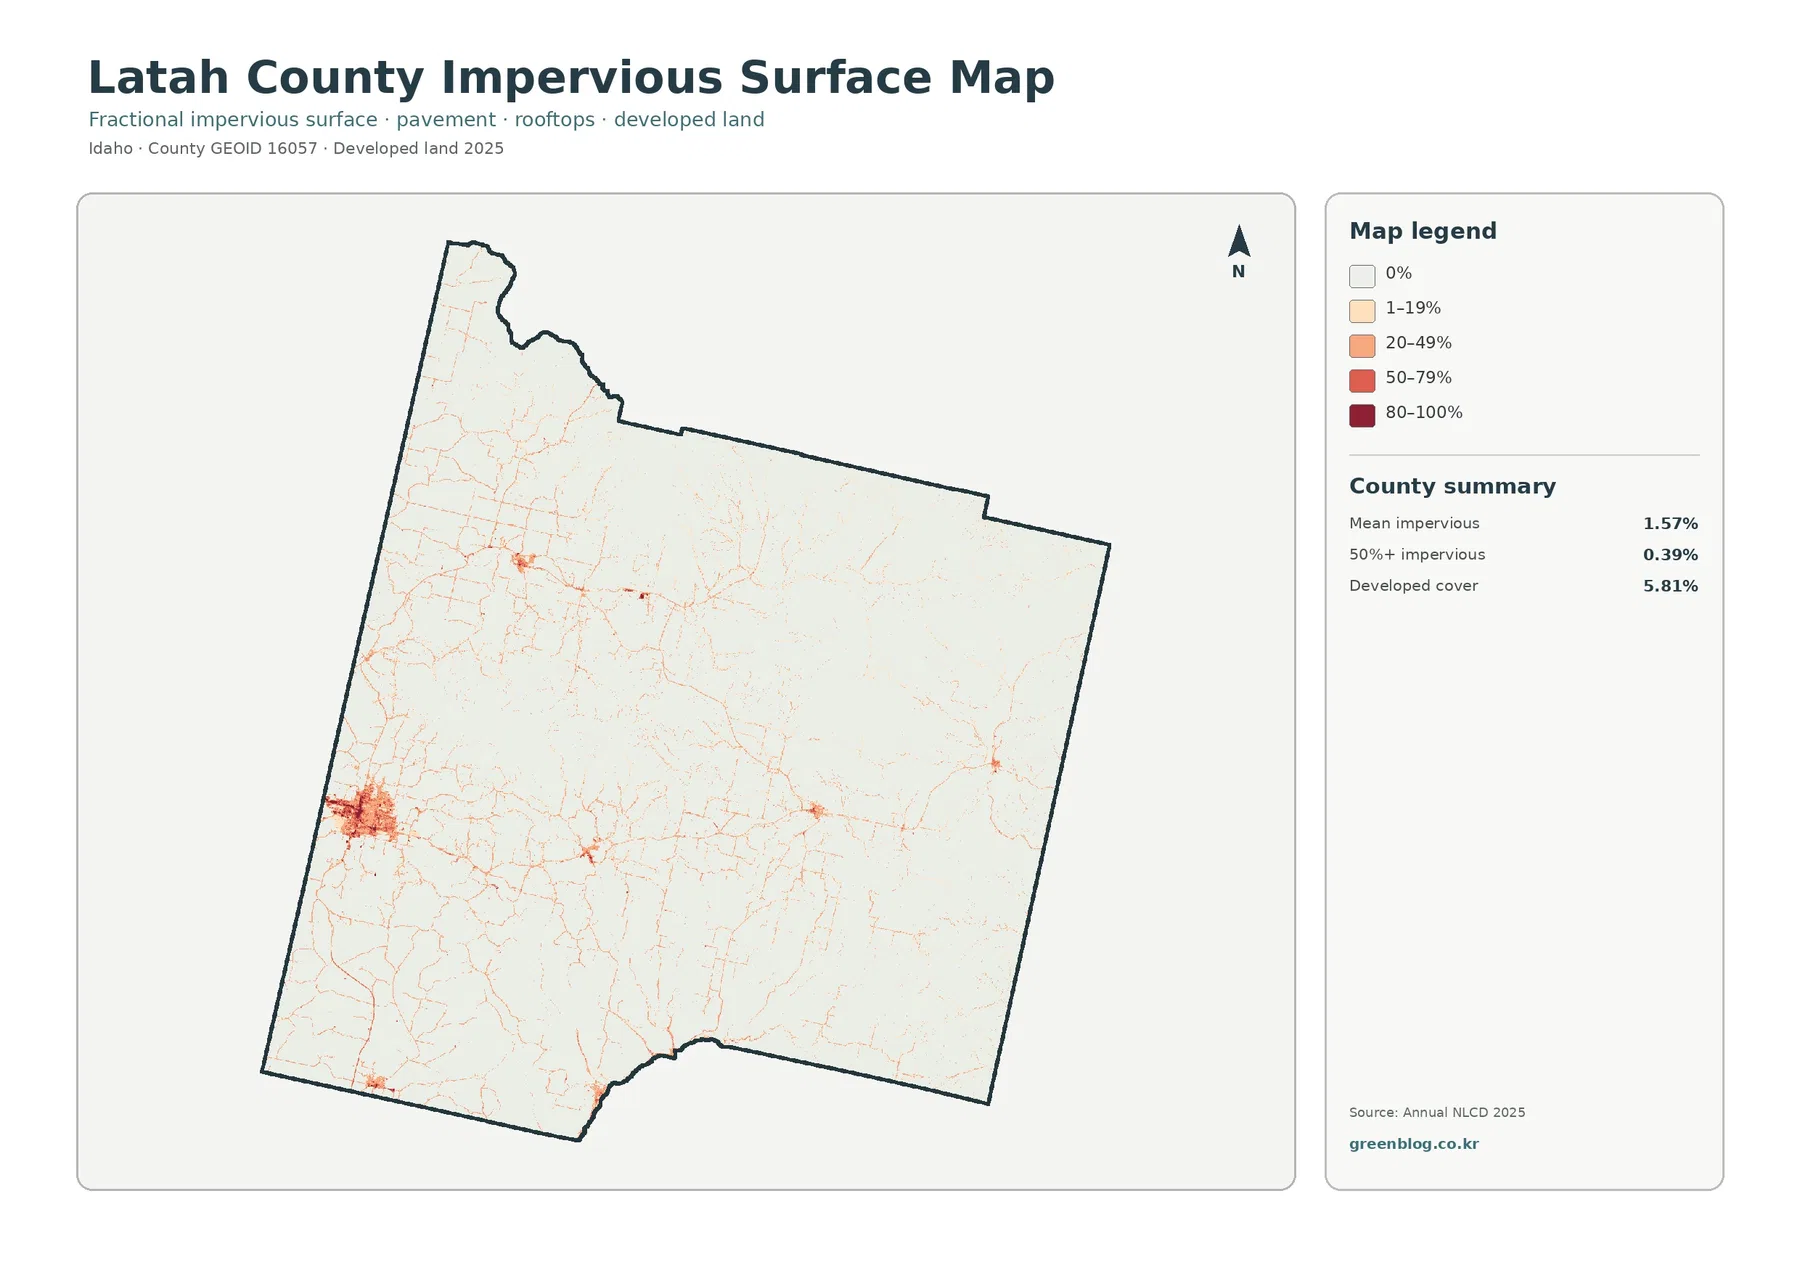
The impervious-surface view is a practical way to orient yourself because Moscow creates the strongest concentration of paved and built surfaces in the county. Mean impervious cover is only 1.57% countywide, and just 0.39% of the county exceeds 50% impervious cover. Those low averages make sense once the map is viewed at full extent: most of Latah County is agricultural, forested, or open land, while the darkest impervious values occupy a relatively compact area around Moscow and a handful of smaller communities.
Thin orange lines extend from the Moscow area along the road network, and smaller clusters appear around places such as Genesee, Potlatch, Troy, Deary, Kendrick, and Juliaetta. The official county website lists these communities among Latah County’s incorporated cities, while the Census geographic reference map provides a useful location check. The pattern should be read as a concentration of hard surfaces near settlements and roads. The map alone does not establish why development occurred in a given place or when a particular road or neighborhood was built.
Developed land and impervious surface are related but not identical measurements. The land-cover summary reports 5.81% developed cover, which can include low-intensity developed cells containing lawns, trees, and other permeable ground. The impervious product estimates the fraction of a 30-meter cell occupied by surfaces such as pavement and rooftops. A suburban or institutional area can therefore be classified as developed without being mostly impervious. Comparing the two products keeps the broad developed footprint separate from the density of hard surfaces within it.
The Palouse side of Latah County is visibly agricultural
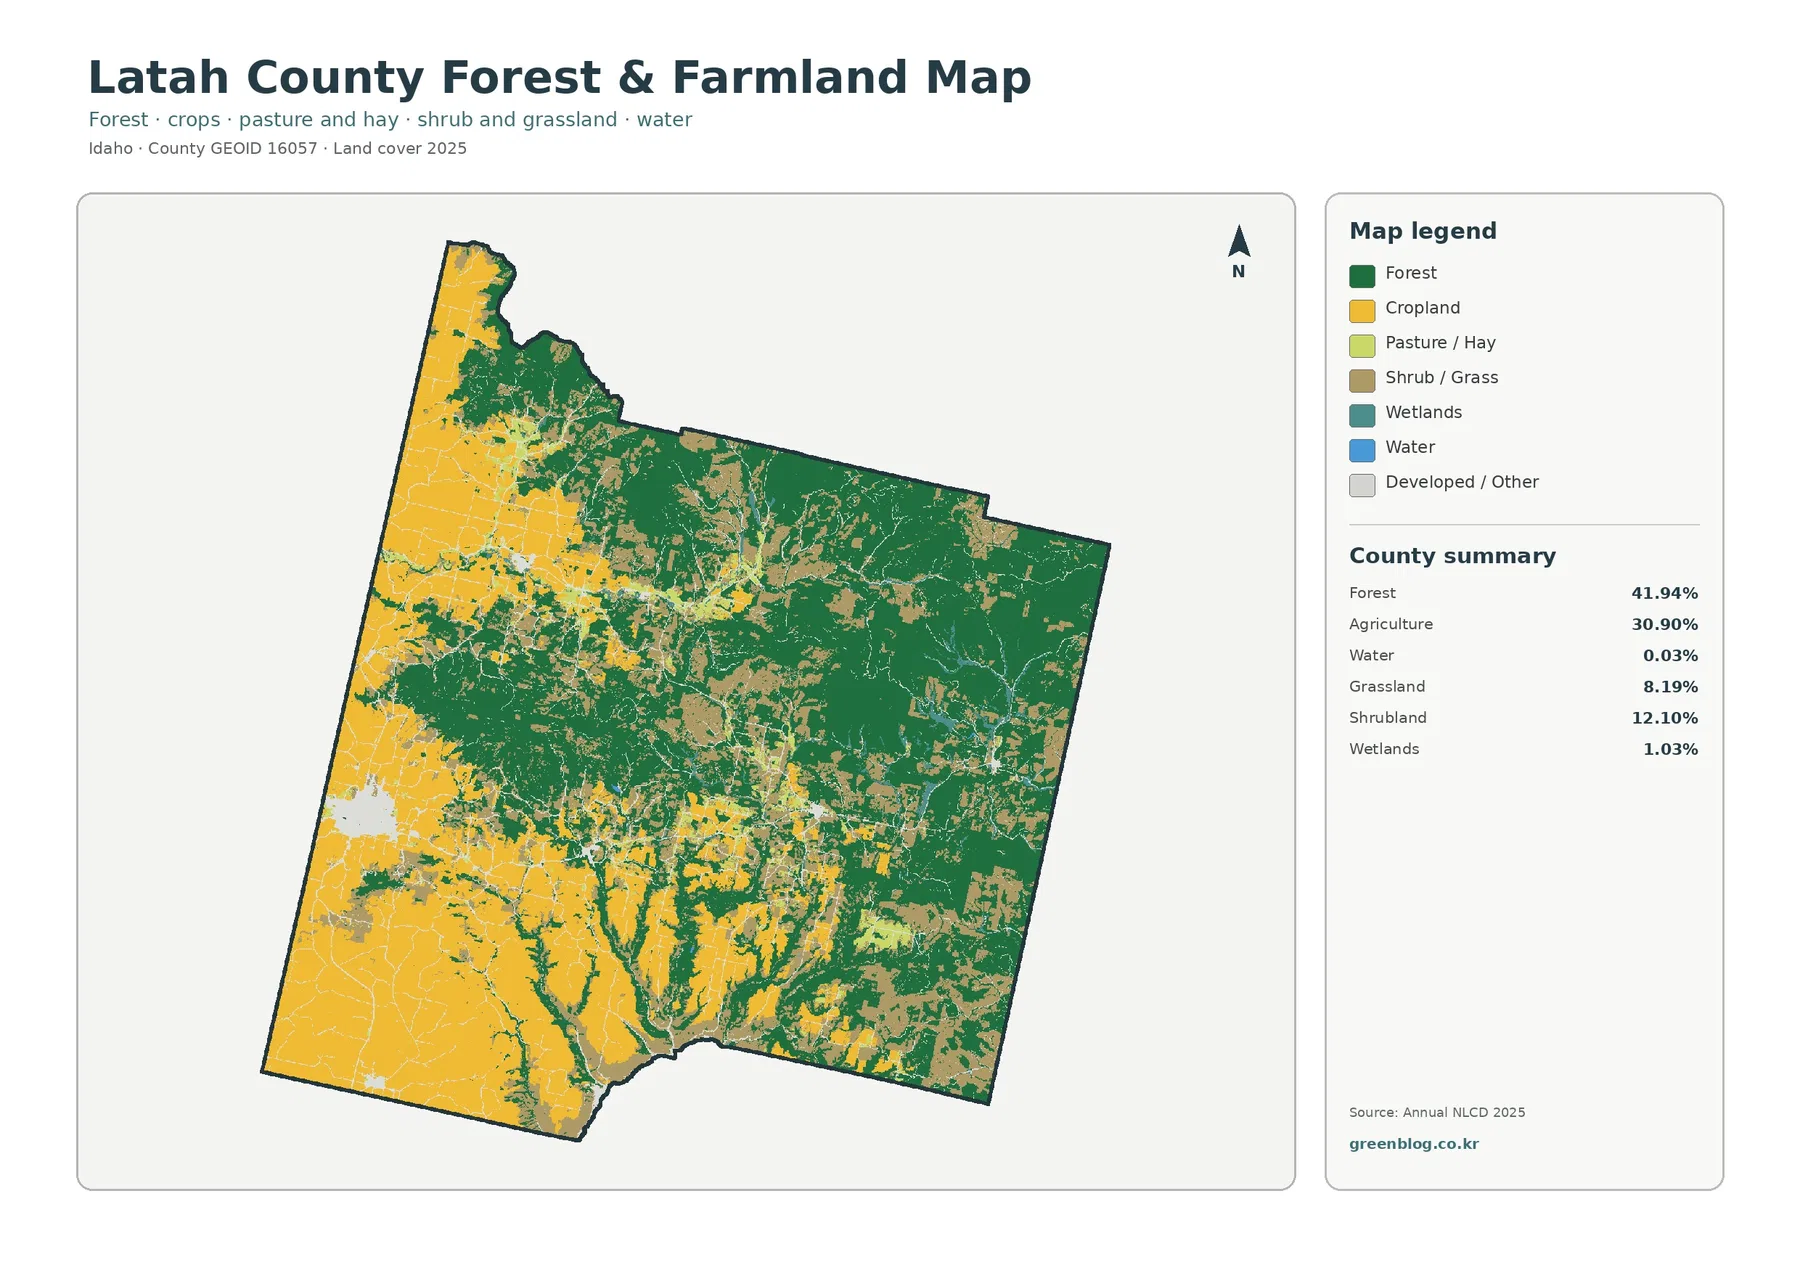
The simplified forest-and-farmland map shifts attention away from urban detail and makes the western cropland pattern unmistakable. Large yellow blocks cover much of the area along the Washington side of the county and continue south toward the Genesee area. Cropland also extends around Moscow and northward through the western part of the county. The shapes are not isolated farm patches; in many places they form broad, adjoining areas that contrast sharply with the greener eastern half.
That visual pattern matches Latah County’s own description of its western setting. The county notes that Latah and neighboring Whitman County, Washington, are part of the Palouse, a major producing area for wheat, lentils, peas, oats, and barley. The map does not identify individual crops, field ownership, or farm management, so it should not be used to assign a specific crop to a particular yellow polygon. It does, however, provide a clear countywide picture of where the 2025 classification places agricultural cover.
Agriculture accounts for 30.90% of the county, but open land is not limited to cropland. Shrubland contributes 12.10% and grassland 8.19%. Those classes appear more often through the central transition and within the eastern mosaic, where forest is broken by open patches. Keeping cropland separate from shrub and grass cover is important because all three may look “open” compared with forest, yet they represent different surface classes and should not be combined casually when reporting acreage or percentages.
Forest becomes the dominant cover east of the agricultural belt
On the general 2025 land-cover map, dark green expands markedly from the center of the county toward the east and northeast. Forest is the largest single class at 41.94%. The eastern side is not an unbroken wall of trees: shrubland, grassland, wetlands, developed pockets, and some agriculture interrupt the forest. Even so, the contrast with the cropland-heavy west is strong enough that the county can be understood as a meeting place between two very different surface patterns rather than as a uniformly forested or uniformly agricultural landscape.
The middle of the county deserves attention because it shows the transition better than either end. Forest fingers extend westward into agricultural country, while cropland and open cover reach eastward into more wooded terrain. Smaller developed clusters are embedded within that mixture. For readers comparing Moscow with places farther east such as Troy, Deary, or Bovill, this section explains why the surrounding colors change even when the settlement class itself remains developed: the broader landscape around each community is different.
Water occupies only 0.03% of the county in the supplied summary, and wetlands account for 1.03%. There is no large lake dominating the map. Instead, wetland color appears in narrow, branching features, particularly through parts of the eastern and southeastern drainage network. These small percentages should not be mistaken for environmental insignificance. They simply describe mapped area at the county scale. Identifying a legally regulated wetland, stream channel, floodplain, or water right requires separate authoritative data.
What the 1985–2025 difference layer can—and cannot—tell you
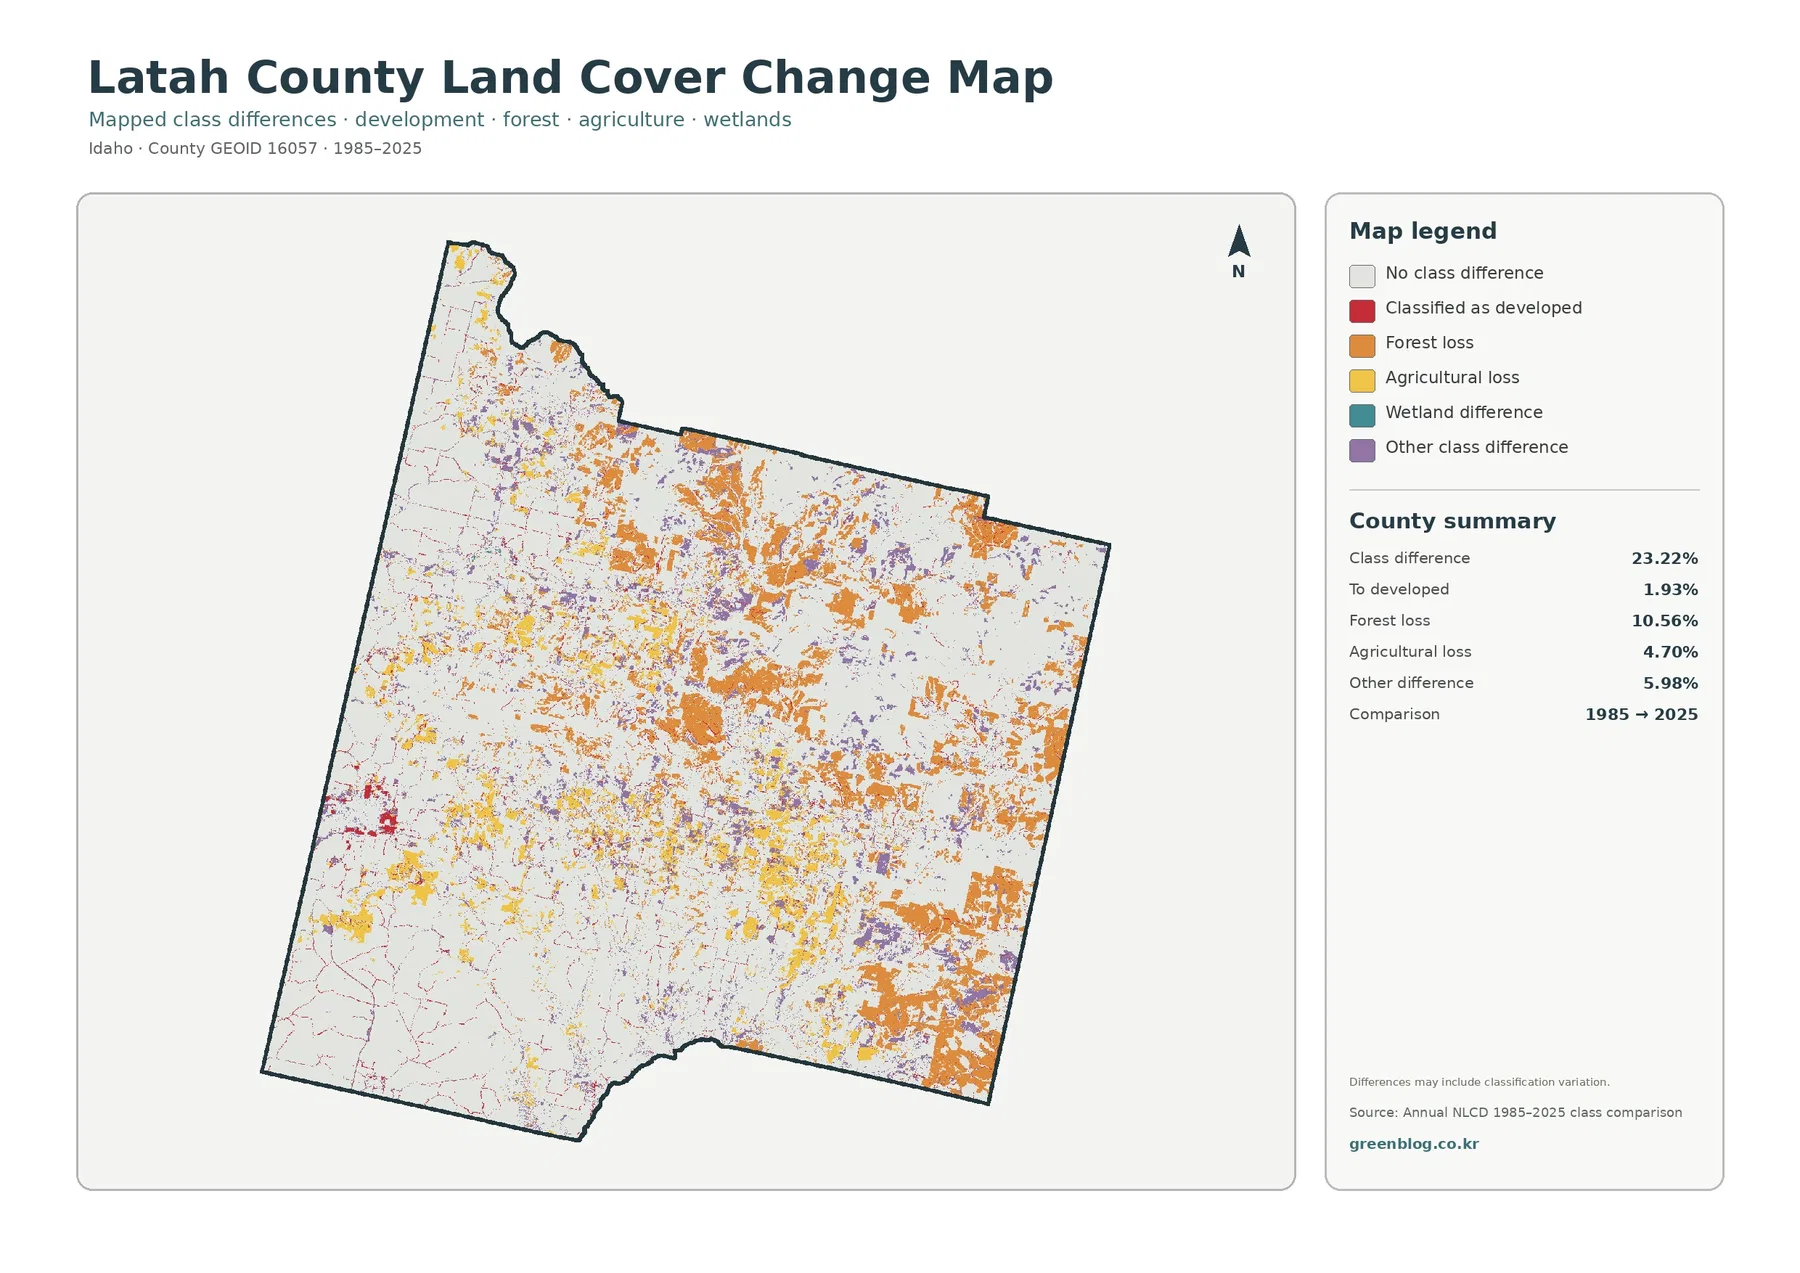
The long-period comparison marks cells whose mapped class differs between 1985 and 2025. The supplied summary reports class differences across 23.22% of Latah County. Forest loss is the largest named category at 10.56%, followed by agricultural loss at 4.70%, other class differences at 5.98%, and change to developed at 1.93%. These are comparison categories, not a second version of the 2025 area totals. A location can be forest today and still appear in a difference category because its classification at the earlier comparison point was not the same.
Orange forest-loss patches are widespread through the center, east, and southeast rather than confined to one continuous block. Yellow agricultural-loss areas appear more often around the western and central agricultural landscape. Red change-to-developed cells are much more localized, with the clearest concentrations around Moscow and other settlement corridors. Purple “other” differences occur in many settings and should not be given a single interpretation without checking which source classes are involved.
The map itself warns that mapped differences may include classification variation. That matters for a 40-year comparison created from remotely sensed data. Vegetation condition, sensor inputs, classification methods, mixed pixels, or genuine land-cover change can all affect whether a cell receives the same class in two years. If a specific orange or purple patch is important, the sensible next step is to review the annual sequence, recent and historical aerial imagery, and local records rather than assigning a cause from color alone.
Reading the county by community gives the maps more meaning
Moscow is the easiest landmark because it lies inside a broad agricultural setting and forms the county’s largest developed cluster. Genesee, farther south in the agricultural side of the county, also appears within a landscape dominated by cultivated cover. Potlatch lies farther north where cropland, forest, and open land mix more closely. Moving east toward Troy, Deary, and Bovill brings progressively more forest into the surrounding scene, while the southeastern Kendrick–Juliaetta area sits within a narrower mixture of wooded slopes, open ground, and drainage-related cover.
These community contrasts keep the article from reducing Latah County to one statewide stereotype. The county’s official site emphasizes the Palouse agricultural identity, but the maps show that this description fits the western portion much more strongly than the forested east. Conversely, calling Latah County a forest county would miss the large, visually continuous cropland blocks along the Washington side. Both statements can be true at the county scale because the two land-cover systems occupy different parts of the same jurisdiction.
For a classroom exercise, students can use the communities as checkpoints. Locate Moscow on the impervious map, compare the surrounding agricultural color on the forest-and-farmland map, then move east to a community surrounded by more forest. The same exercise works for local presentations because it connects abstract percentages to recognizable places. It also reinforces an important limitation: a county percentage summarizes the whole jurisdiction and does not describe every town or neighborhood equally.
Choose the map that matches the question
Use the general land-cover map when you need the complete 2025 surface mix. It is the best choice for seeing agriculture, forest, developed land, shrubland, grassland, wetlands, water, and minor classes in one frame. Because Latah County has a pronounced west-to-east contrast, this overview quickly communicates the county’s broad structure. It is less efficient when the question is narrowly about farms or hard urban surfaces because the full legend introduces more colors than those tasks require.
For agriculture-versus-forest comparisons, the simplified forest-and-farmland map is easier to read. It highlights the broad Palouse farm blocks, the forested eastern country, and the open transition between them. When the question concerns paved and built surfaces, use the impervious product instead. Its light-to-dark scale makes Moscow and smaller settlement corridors visible without letting the large agricultural and forest classes dominate the page.
The change map is most useful as a screening layer. It identifies places where the two comparison years differ, then invites you to return to the 2025 map or another annual layer to understand the present condition. For print or presentation use, keep the legend, year, county boundary, and summary panel intact. Cropping those elements away can make a red change category look like a simple “high value” or make green appear to mean the same thing across different maps when the legends actually describe different products.
Resolution, classification, and legal-use limits
Annual NLCD is a raster dataset derived largely from Landsat imagery at 30-meter spatial resolution. Each cell represents a square area on the ground and is assigned a mapped value. That design works well for county-scale patterns, but it cannot trace every field edge, driveway, narrow stream, tree row, or building footprint. Where several surface types share one cell, the mapped class is a generalization rather than a parcel survey. Small features may disappear, and boundaries can look more blocky than they do on aerial photography.
Land cover should also be kept separate from zoning and legal land use. A yellow agricultural cell does not identify the owner, tax classification, zoning district, water right, conservation restriction, or future development eligibility. Latah County maintains separate GIS and planning information for those purposes. The maps here are best used to understand broad surface patterns, compare parts of the county consistently, and identify locations that deserve closer review with current local records.
The mapping year creates another limit. The current maps represent the supplied 2025 classification, so construction, harvest, regrowth, crop rotation, or restoration after that observation period may not be reflected. The 1985–2025 difference layer compares endpoints and does not narrate every intermediate change. A site could change class more than once during the period and still end in a class similar to an earlier state. Decisions that require present-day conditions should therefore use the newest available imagery and official local data in addition to these maps.
Frequently Asked Questions
Why does Latah County look agricultural in the west but forested in the east?
The 2025 map places broad agricultural cover across much of the Palouse side of western and southwestern Latah County, while forest becomes far more continuous to the east and northeast. Countywide totals reflect both landscapes: forest is 41.94% and agriculture is 30.90%.
What does the 1.57% mean impervious value represent?
It is the countywide average share of 30-meter cells occupied by hard surfaces such as pavement and rooftops. The value is low because most of the county is not urban, even though Moscow contains a much denser cluster of impervious surfaces than the surrounding countryside.
Does 23.22% class difference mean that nearly one quarter of Latah County was permanently converted?
No. The change layer records differences between the 1985 and 2025 mapped classes, and the product notes that classification variation may be included. Confirming permanent land-use conversion requires the annual sequence, aerial imagery, and local records for the location being studied.
Map File Information
Download one ZIP containing all four original JPG maps prepared for Latah County, Idaho.
- Included Versions: land cover, forest and farmland, impervious/developed land, land-cover change
- File Type: ZIP containing 4 JPG files
- Intended Use: screen comparison, print reference, classroom and presentation use, regional environmental review
Related Maps
Sources and References
- U.S. Geological Survey – Annual NLCD Collection 1.2 Land Cover (2025 Annual NLCD coverage, land-cover classes, and 30-meter product information)
- U.S. Geological Survey – Annual NLCD spatial resolution (30-meter raster resolution)
- Latah County official website (Palouse agricultural context and the county’s incorporated communities)
- University of Idaho Extension – Latah County (local agriculture, small-farm, horticulture, and community programs)
- U.S. Census Bureau – Idaho Geographic Areas Reference Map (location reference for Latah County communities including Moscow, Potlatch, Troy, Deary, Bovill, Genesee, Kendrick, and Juliaetta)
Green Map creates custom-edited map images using open geographic data sources such as geoBoundaries, Natural Earth, OpenStreetMap, and government open data. These maps are edited visual materials, not raw data files, and are provided for education, documents, presentations, and graphic reference.