Cheyenne County in eastern Colorado is dominated by open land cover rather than dense development. The 2025 map summary lists grassland at 55.97% and agriculture at 41.57%, while developed cover accounts for only 2.18%. Across the map, cultivated blocks are interwoven with broad grassland areas, and the small built-up clusters stand out mainly because so little of the county is heavily developed.
Four views are included on this page: current land cover, forest and farmland, impervious/developed land, and a 1985–2025 land-cover comparison. The four original JPG maps are available together in one download. The sections below explain what each view adds, how to compare the percentages without mixing different measures, and where the classification has limits.
Table of Contents
A county of open cover rather than dense development
The current land-cover map is filled mostly by two colors. Grassland forms the broad background, especially through larger uninterrupted areas in the western and southwestern portions of the county. Agricultural cover appears as a dense patchwork of rectangular blocks across much of the north, center, and east. This is not a county where one city or one forest belt controls the visual pattern. The defining contrast is between open grass cover and cultivated land.
The supplied county summary gives 55.97% grassland, 41.57% agriculture, 2.18% developed cover, 0.23% wetlands, and 0.03% water. Forest is listed at 0.00%, and shrubland at 0.01%. Those values help determine what deserves attention in the map. Water and wetlands are present but tiny at county scale, while the grassland-agriculture boundary repeats across almost the entire image.
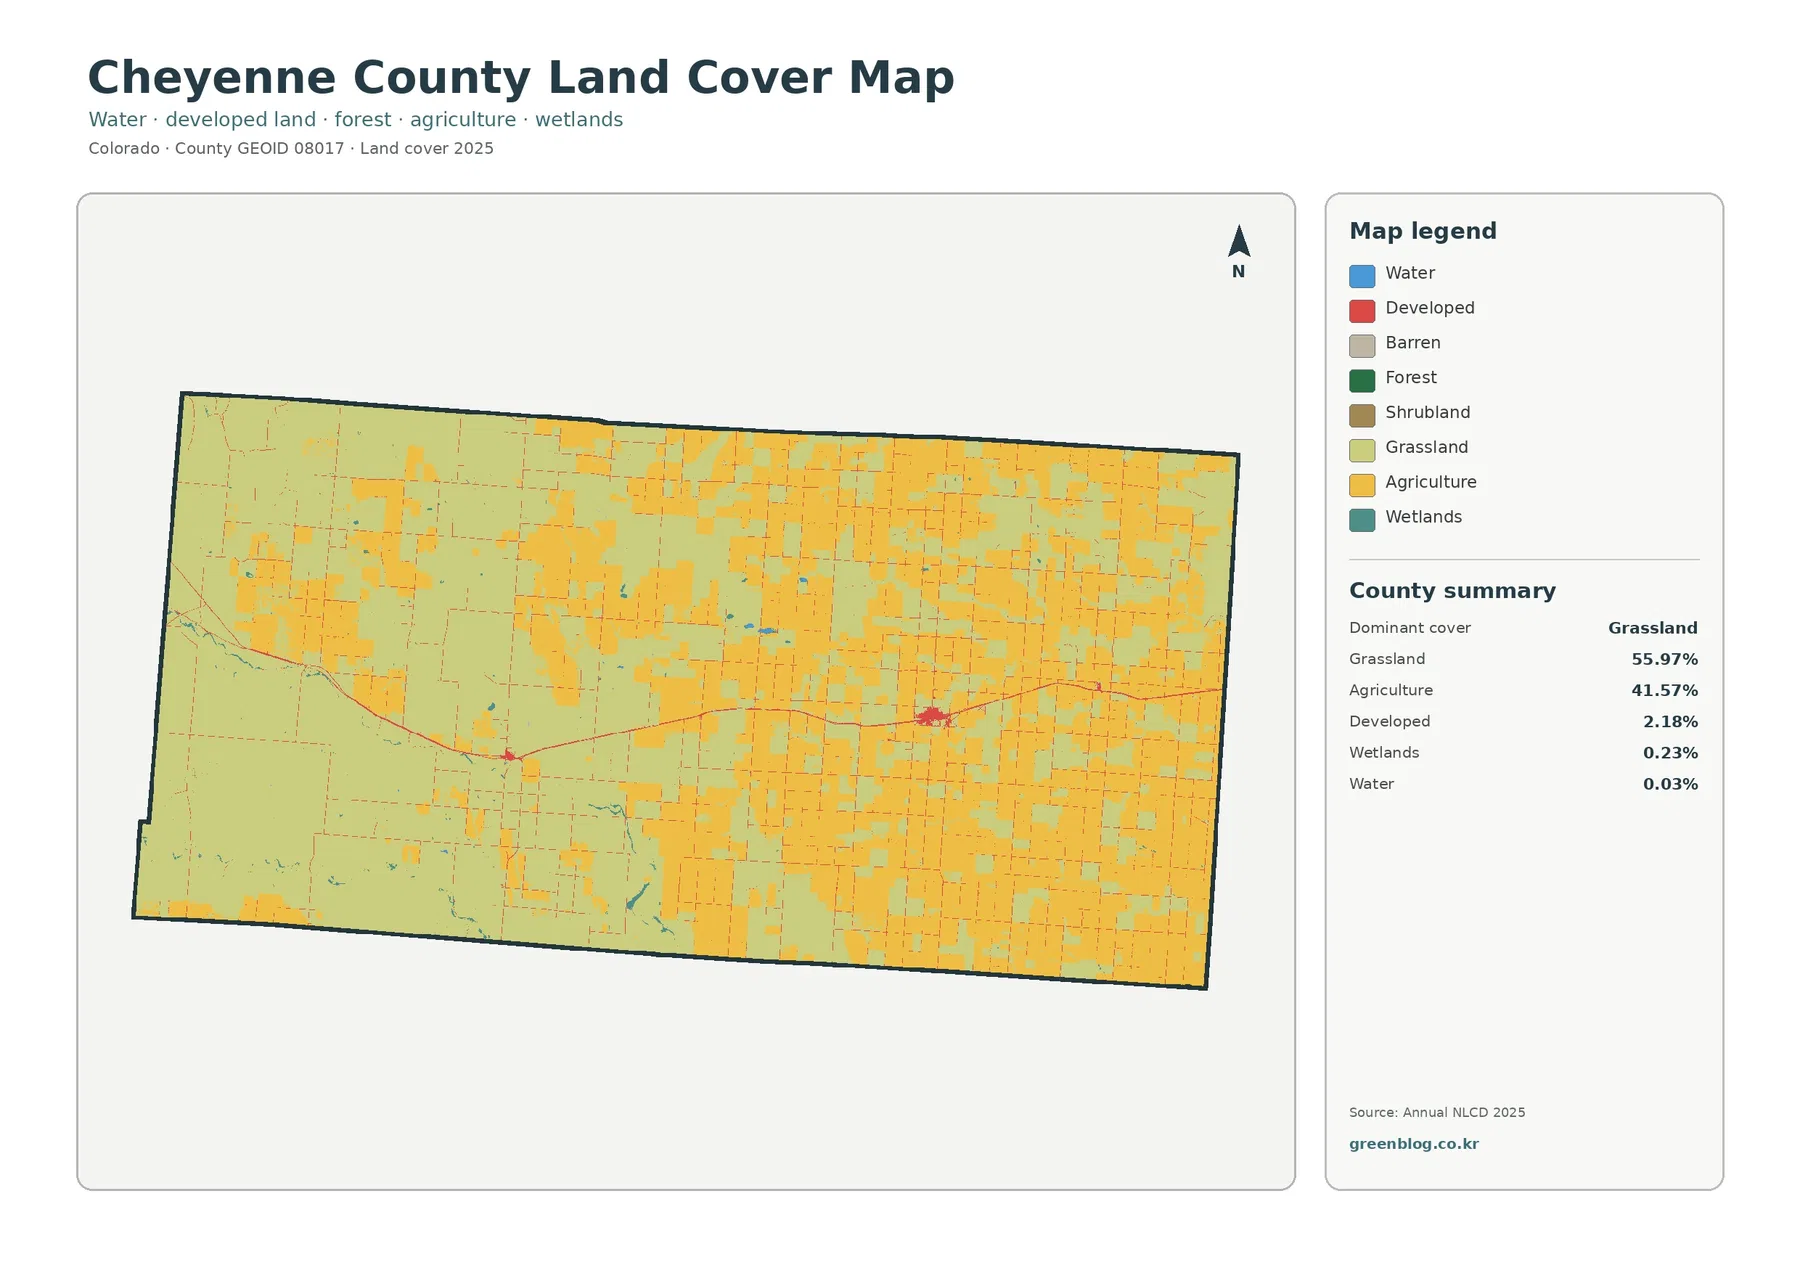
The land-cover legend includes water, developed land, barren land, forest, shrubland, grassland, agriculture, and wetlands. A class can appear in the legend even when it occupies almost none of the county. That is why the 0.00% forest summary matters: the map is not suggesting a hidden forest belt that is merely hard to see. At the scale of this product, grassland and agriculture are the two classes that explain almost all of the visible landscape.
Land cover should not be treated as zoning. The map classifies the physical surface represented in a raster grid; it does not identify ownership, permitted development, parcel boundaries, or legal agricultural status. A field shown as agriculture may include different crops or management practices, and a developed cell may contain grass or bare soil along with pavement and buildings. Legal land use requires separate county records.
Why the crop pattern forms a patchwork
The forest-and-farmland view simplifies the legend and makes the agricultural geometry easier to follow. Cultivated areas appear as repeated blocks rather than one continuous band. They are especially frequent across the eastern half and northern part of the county, while broader grass-dominated areas remain more apparent toward the west. The alternating pattern gives the map a tiled appearance that is quite different from mountain counties where forest cover forms large continuous masses.
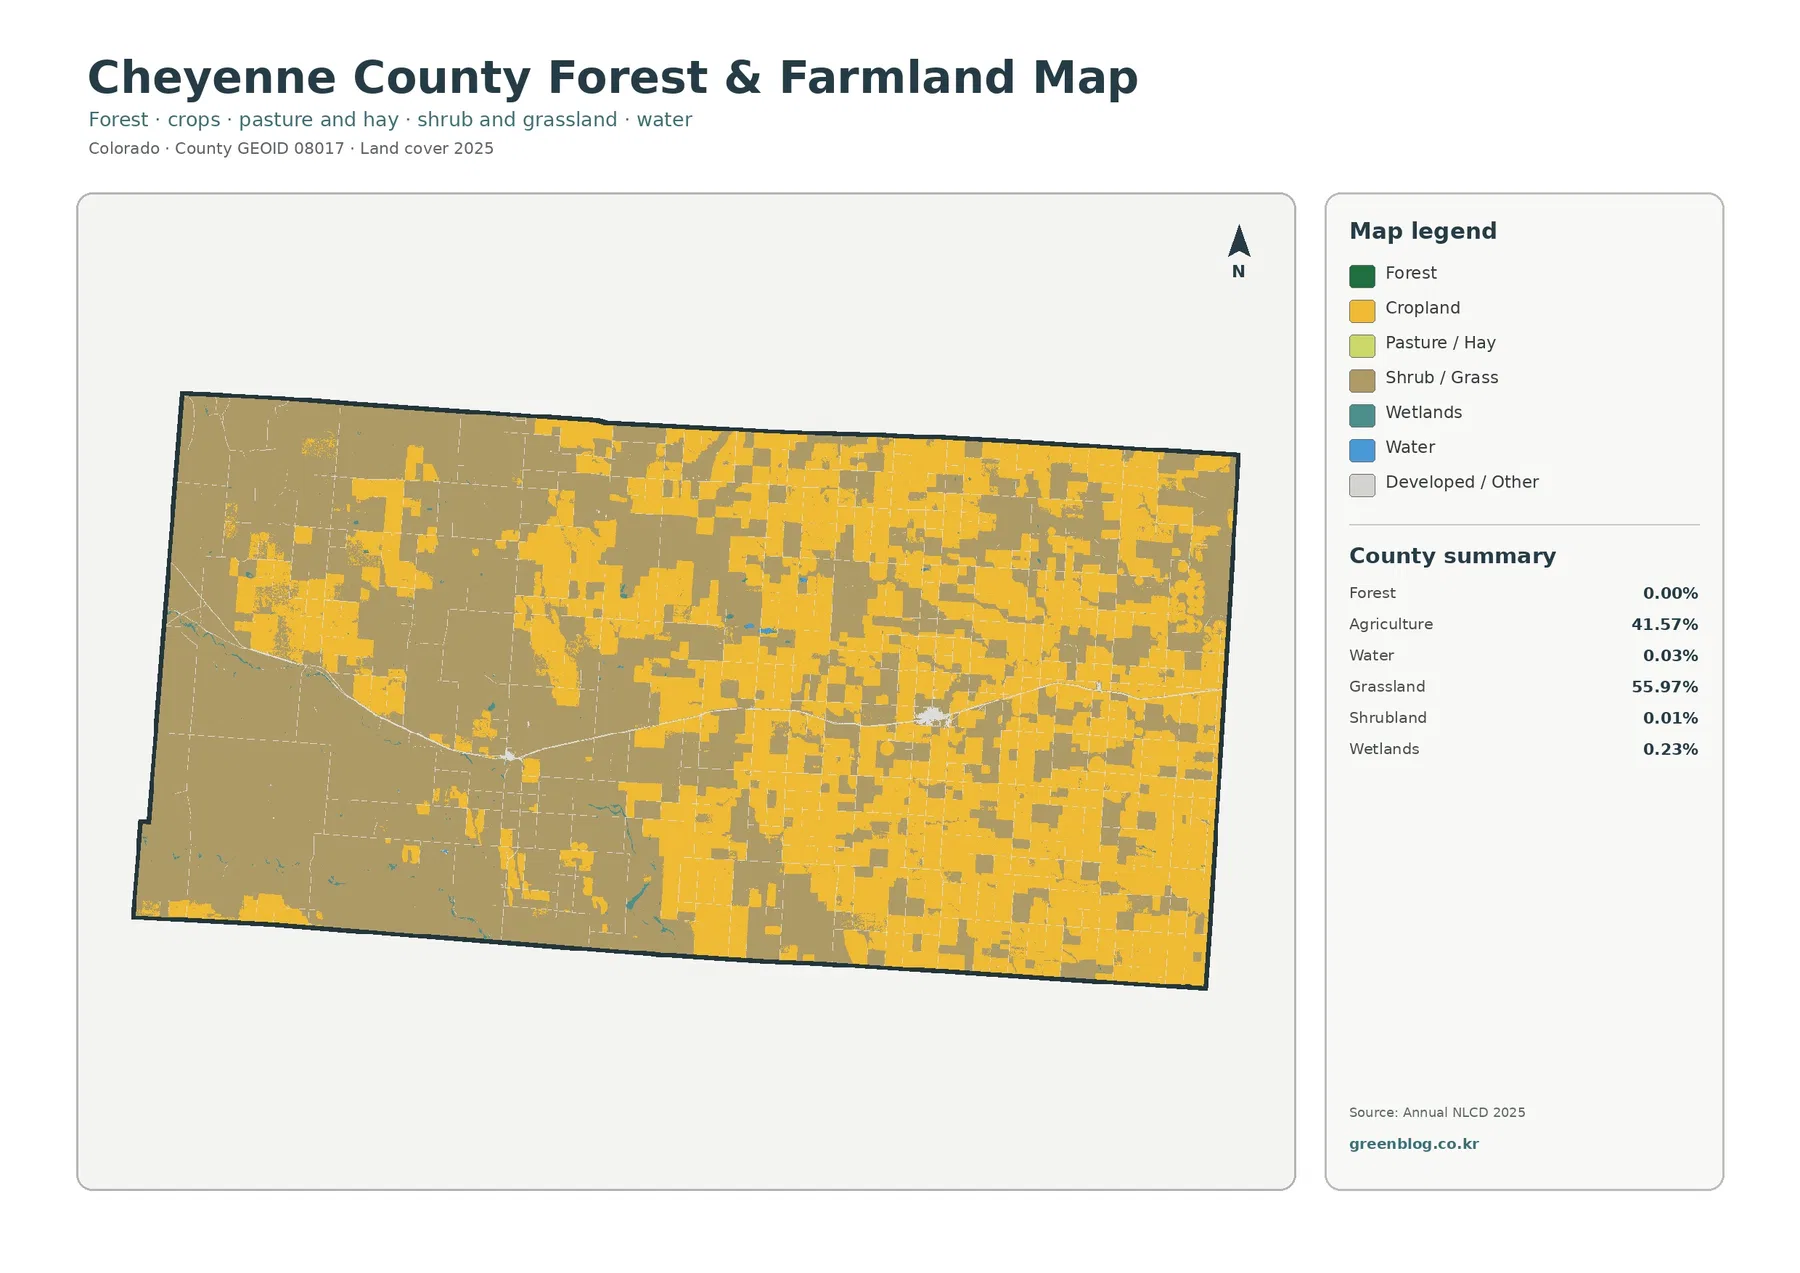
The same summary figures appear here in a more useful context: agriculture is 41.57%, grassland 55.97%, wetlands 0.23%, water 0.03%, shrubland 0.01%, and forest 0.00%. Because forest is effectively absent at this scale, the value of this layer is not in locating woodland. It is in separating cultivated areas from the surrounding grass-dominated cover and making small wetland or water features easier to notice.
Cheyenne County’s official comprehensive plan describes agriculture as a backbone of the county’s economy and lifestyle, and it sets policies intended to maintain agricultural land in unincorporated areas until more intensive uses are appropriate. That planning statement is not the same thing as an NLCD classification. It does, however, provide useful local context for why agriculture is a major topic when interpreting a map where more than two-fifths of the 2025 surface is classified as agricultural cover.
The agricultural class does not reveal crop type, farm ownership, irrigation status, productivity, or whether a particular field was planted every year. The blocks are best used for county-scale pattern recognition. A project about specific crops, soil suitability, grazing, or water supply needs agricultural statistics, soil data, field records, or other specialized sources in addition to this map.
Built surfaces are concentrated around a small number of communities
The impervious-surface map looks almost empty compared with the first two maps. Impervious surface means roofs, pavement, parking areas, and similar materials that do not readily absorb water. The countywide mean is only 0.31%, and just 0.03% of the county is mapped at 50% impervious or higher. Most cells therefore remain at or near the lowest class.
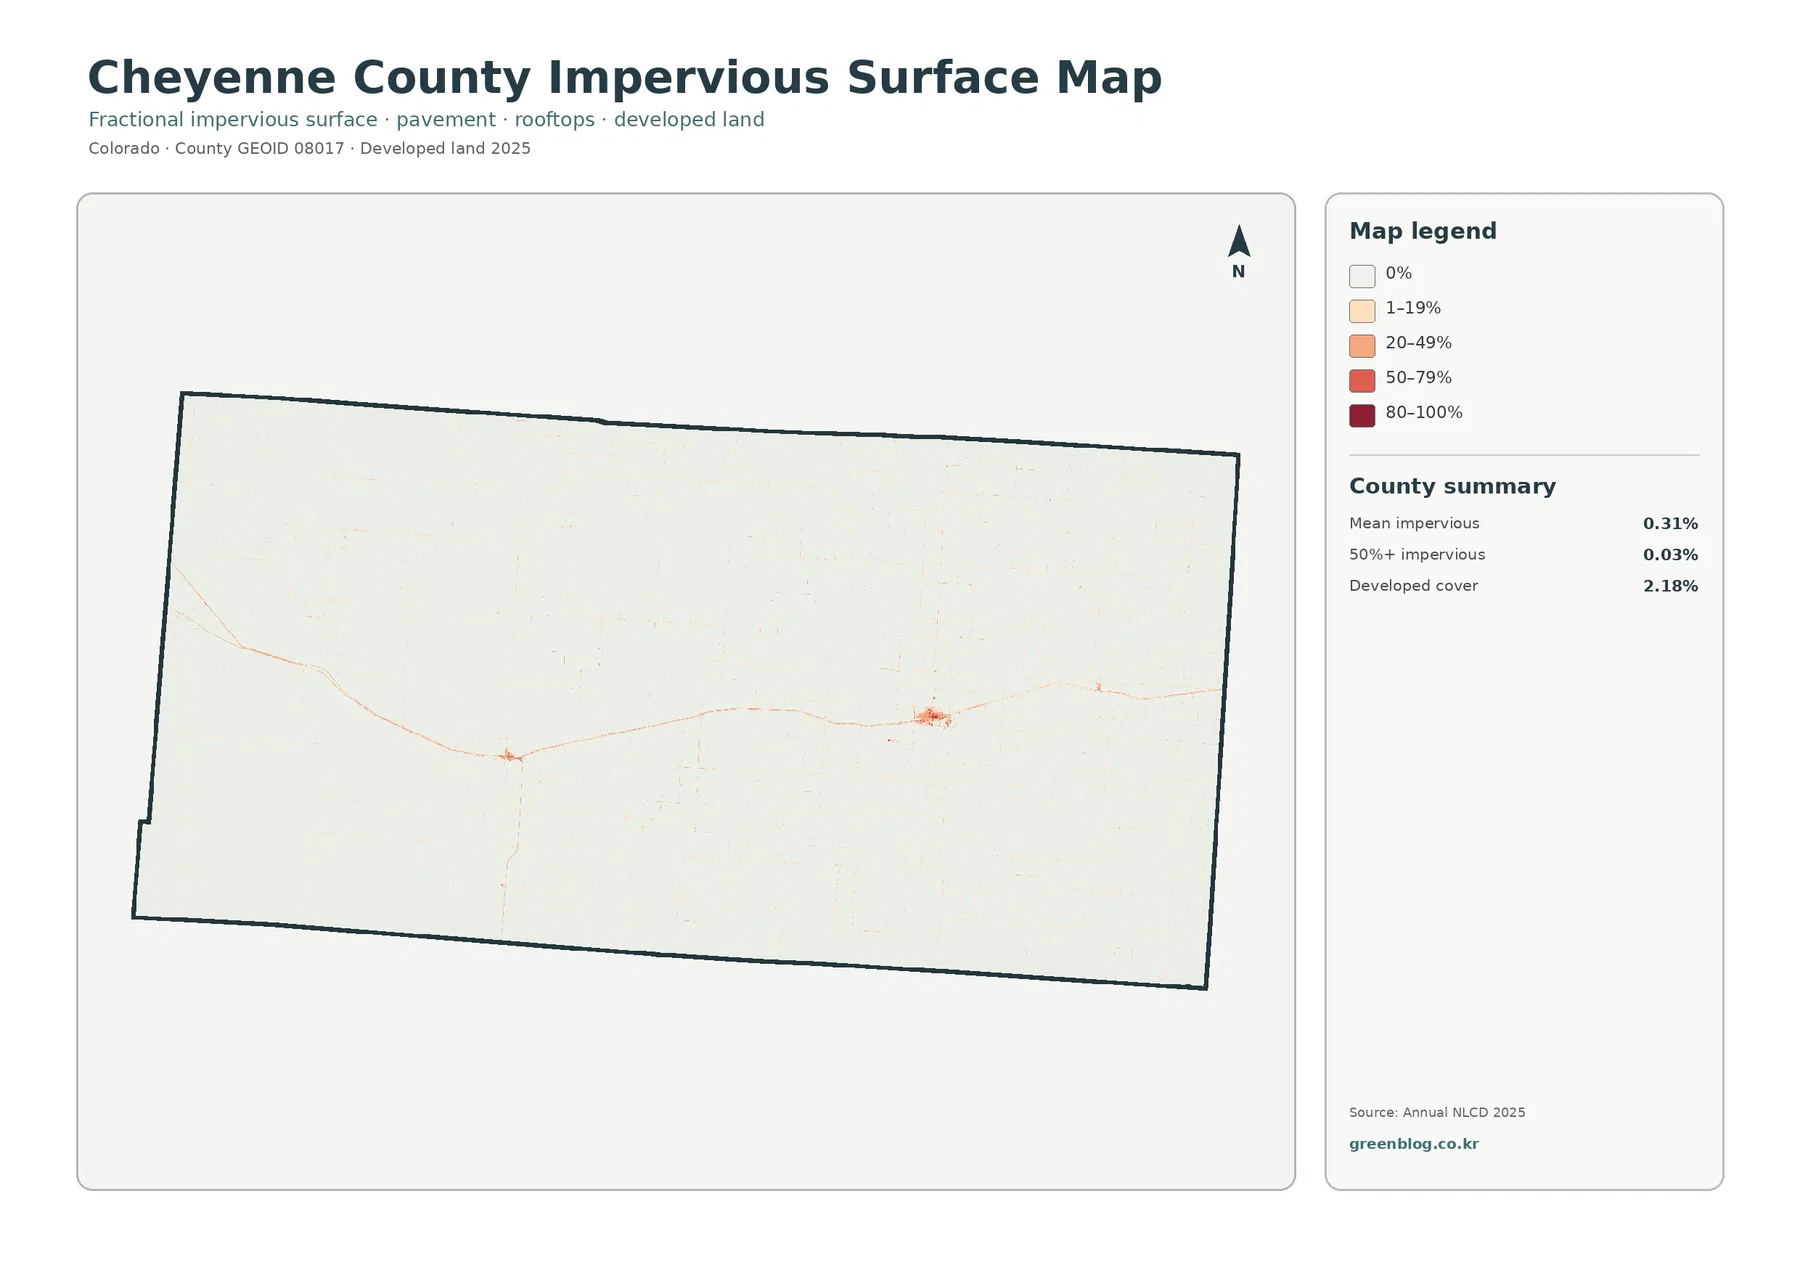
The official county website identifies Cheyenne Wells as the county seat and lists Cheyenne Wells and Kit Carson as the incorporated towns. It also names Arapahoe and Wild Horse as unincorporated communities. The impervious layer does not label those places, but its small clusters fit the overall pattern of a county with a few settlement centers separated by large areas of grassland and agriculture. A larger eastern cluster and smaller western cluster are much more prominent than the thin traces elsewhere.
Developed cover at 2.18% should not be expected to equal the 0.31% mean impervious value. A developed land-cover class can include lawns, soil, trees, and other permeable surfaces mixed with buildings and roads. The impervious product measures the fraction of hard surface within cells instead. The two metrics are related, but they answer different questions and should be reported separately.
This map works well for identifying where built surfaces are concentrated relative to the county’s open land. It is not detailed enough to measure a road width, outline a building, or calculate a parcel-specific runoff value. Narrow roads and small structures may be generalized by the raster grid, and a mixed cell can contain both hard and permeable surfaces.
The 1985–2025 change layer needs cautious interpretation
The long-term comparison reports a class difference across 16.42% of Cheyenne County. The largest labeled component is agricultural loss at 10.87%. Other class differences account for 5.00%, change to developed covers 0.51%, and forest loss is 0.00%. On the map, agricultural-loss cells form many yellow blocks scattered across the county rather than one continuous zone.
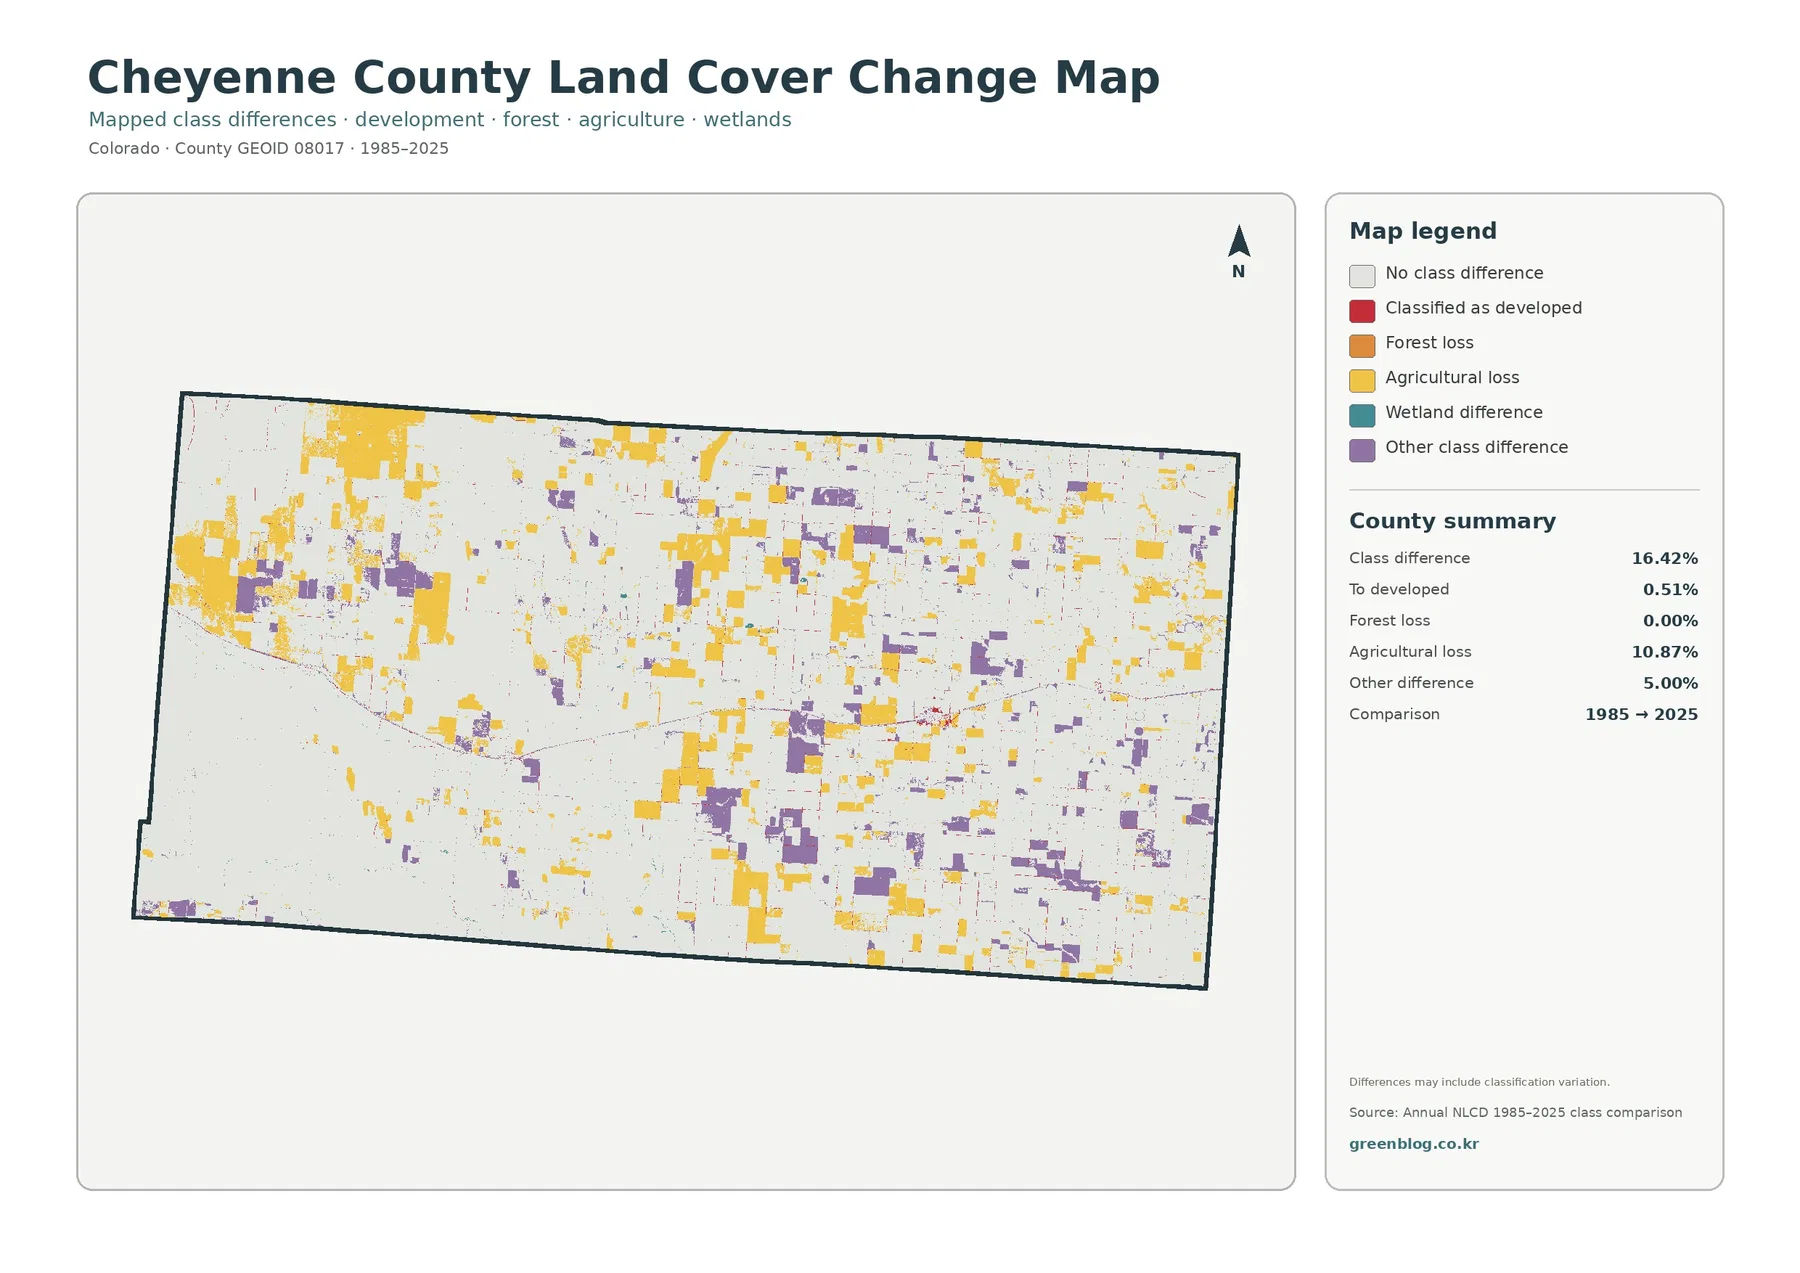
The label “agricultural loss” is a classification statement, not a count of farms that disappeared. It identifies cells that no longer match the agricultural class in the comparison. That difference may reflect real land-cover change, but the map itself notes that classification variation can also contribute. It does not establish whether a field was permanently abandoned, converted by policy, changed ownership, or simply appeared differently in the classification.
The spatial distribution reinforces the need for that caution. Yellow agricultural-loss blocks appear in the west, north, center, and east, while purple “other difference” areas are interspersed through several central and eastern locations. Red change-to-developed areas are limited. The map therefore does not support a simple story of a single expanding urban front. Its strongest message is that a noticeable share of the county changed class between the two endpoint years, with agricultural-class differences making up the largest named share.
Current agriculture at 41.57% and agricultural loss at 10.87% describe different things. The first is the 2025 condition; the second belongs to the 1985–2025 comparison. They cannot be added or subtracted to reconstruct a 1985 agricultural percentage because the supplied change summary does not provide a complete transition matrix for every class. Keeping current-state statistics separate from change statistics prevents a common interpretation error.
Use each map for a different question
For a general county description, begin with the 2025 land-cover map because it puts grassland, agriculture, development, water, wetlands, and minor classes in one view. If the project is focused on farming and open land, the forest-and-farmland map removes some visual complexity and makes the crop blocks easier to trace. For settlement intensity, switch to the impervious map. Use the change layer only when the question specifically involves the difference between 1985 and 2025 classifications.
The same location can look very different in each layer. A large agricultural block may be bright and obvious in the farmland view, almost blank in the impervious layer, and partly marked as changed in the 1985–2025 comparison. That does not mean the maps disagree. They are highlighting different characteristics of the same ground. Comparing one place across all four layers is more informative than expecting every layer to tell the same story.
These maps can support classroom exercises, county profiles, environmental background sections, and presentation graphics. For example, a report can state that grassland and agriculture together dominate the 2025 classification, then use the impervious map to show how little hard surface exists countywide. A separate paragraph can discuss the 16.42% class-difference figure without presenting it as a current land-cover share.
What the maps cannot tell you
Annual NLCD is a raster dataset. In simple terms, the landscape is divided into small grid cells, and each cell is assigned a class or an impervious fraction. Real features do not always fit neatly inside those cells. A road, grass shoulder, field edge, and building can all fall within the same grid cell, creating what is often called a mixed pixel. Small wetlands, narrow roads, and isolated structures are especially sensitive to that generalization.
The maps are also tied to observation years. The 2025 layer is not a live map, so construction, vegetation changes, or agricultural conditions that occurred later may not appear. The 1985–2025 layer compares two endpoints; it does not tell the exact year a change happened. A year-by-year history would require additional time-series data or historical imagery.
County planning and zoning documents answer another set of questions. Cheyenne County’s comprehensive plan discusses agricultural areas, growth around communities, commercial and residential uses, and other regulatory topics. Those legal categories should not be inferred from NLCD colors. Anyone making a parcel, permit, ownership, or development decision should consult official county records and the appropriate local office rather than relying on a land-cover classification map.
The smallest mapped classes deserve extra care. Water is only 0.03% and wetlands 0.23%, so they can be difficult to see at the full-county scale. Forest is reported at 0.00%, but that does not mean every individual tree is absent from the landscape. It means the mapped forest class does not occupy a measurable county share in the supplied summary at this scale and precision.
Download the four Cheyenne County JPG maps
The ZIP package contains the four original JPG maps used for this county: current land cover, forest and farmland, impervious/developed land, and the 1985–2025 land-cover comparison. Each JPG is 2480×1754 pixels. The package manifest does not mark these files as meeting its A3 high-resolution reference, so they are provided at the original size without claiming a larger print specification.
Frequently Asked Questions
Why does agricultural cover look so patchy in Cheyenne County?
Agriculture covers 41.57% of the county, but it is distributed as many separate blocks within a larger grassland setting rather than one uninterrupted area. The forest-and-farmland map makes those rectangular field patterns especially visible. The map does not identify crop type or individual farm ownership, so the blocks should be interpreted as land-cover classifications rather than parcel boundaries.
Does 0.00% forest mean there are no trees anywhere in the county?
No. The supplied summary reports the forest land-cover class at 0.00% at its displayed precision and the county map does not show a continuous forest area. Individual trees, shelterbelts, or very small wooded patches can still exist without occupying a measurable share of the county in this generalized classification.
What does the 10.87% agricultural-loss value mean?
It means 10.87% of the county is mapped in the agricultural-loss category in the 1985–2025 class comparison. It is not a farm-count statistic, a legal farmland-conversion figure, or a direct measure of agricultural production. The change map should be paired with current land cover and other records before drawing conclusions about why a particular area changed.
Map File Information
The ZIP contains the four original Cheyenne County JPG maps for current land cover, farmland/open land, impervious surface, and 1985–2025 change.
- File Type: Four JPG files in one ZIP archive
Related Maps
- Adams County Colorado Land Cover Map
- Alamosa County Colorado Land Cover Map
- Arapahoe County Colorado Land Cover Map
Sources and References
- MRLC Annual NLCD Data — access point for Annual NLCD land-cover products.
- USGS Annual NLCD Land Cover Classification — definitions for developed, grassland, agriculture, wetlands, and other classes.
- U.S. Census Bureau TIGER/Line Shapefiles — official reference for county boundaries.
- Cheyenne County, Colorado — official county information on Cheyenne Wells, Kit Carson, and other communities.
- Cheyenne County Comprehensive Plan and Zoning Ordinance — official planning context for agriculture, community growth, and land-use regulation.
Green Map creates custom-edited map images using open geographic data sources such as geoBoundaries, Natural Earth, OpenStreetMap, and government open data.
These maps are edited visual materials, not raw data files, and are provided for education, documents, presentations, and graphic reference.