The Marengo County Alabama Land Cover Map shows a 2025 landscape shaped mainly by forest, broad wetland corridors, and a sizable agricultural area. Reading it alongside the other three views adds useful detail: the impervious map makes the relatively small developed footprint stand out, while the long-term map separates several kinds of class difference from 1985 to 2025.
This page includes a general land-cover map, a forest-and-farmland view, a fractional impervious-surface map, and a 1985–2025 class-change map. The WebP images below are for on-page reference, and the four original 2480 × 1754 JPG maps are available together in the download box later on the page.
Table of Contents
A county where forest, wetlands, and farmland all matter
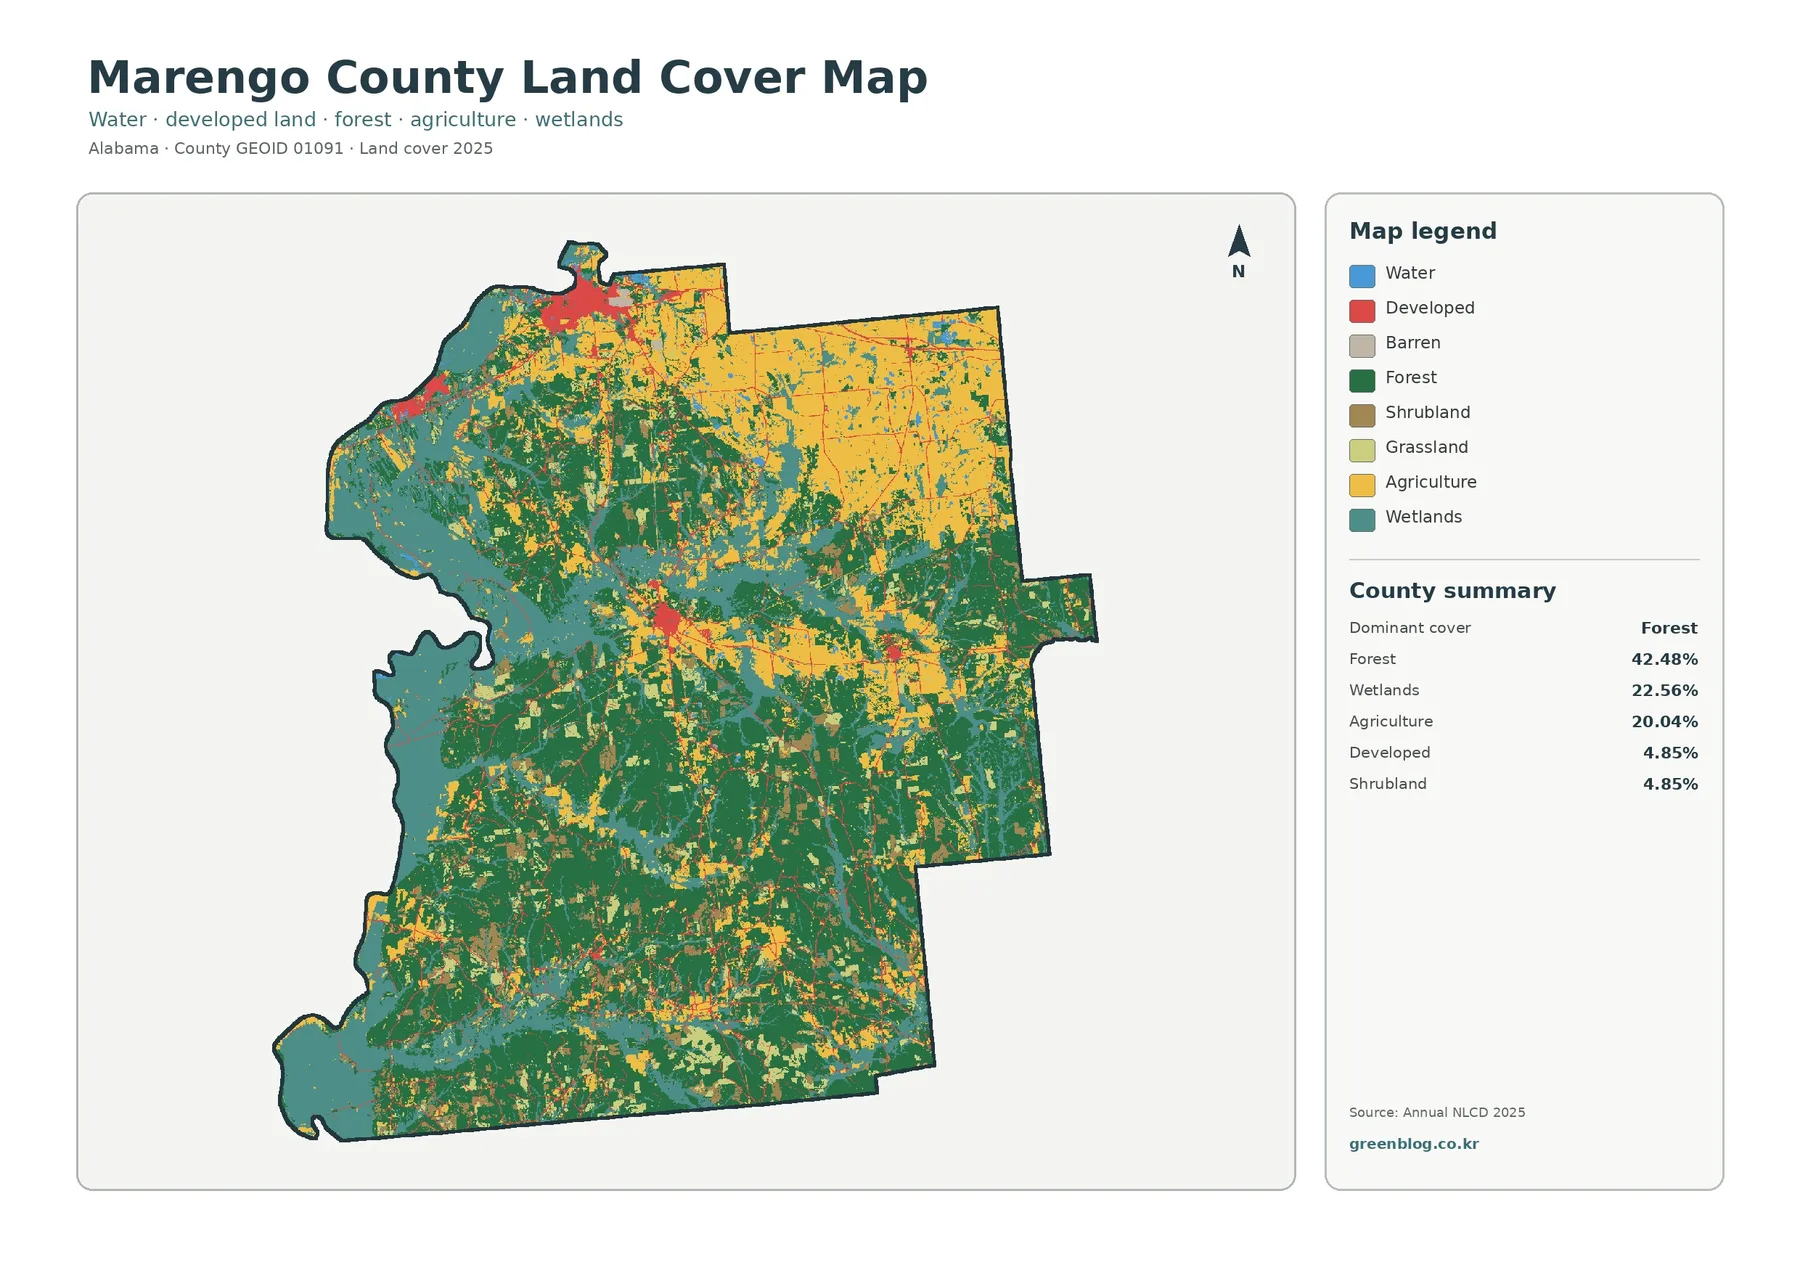
The 2025 summary gives forest the largest share at 42.48 percent. Wetlands account for 22.56 percent and agriculture for 20.04 percent, followed by developed cover at 4.85 percent and shrubland at 4.85 percent. Those figures describe a county with three large landscape components rather than a place controlled by a single land-cover class.
The map adds an important spatial story to the percentages. Forest covers much of the interior and becomes especially continuous through the central and southern parts of the county. Agricultural colors become more extensive toward the north and northeast. Wetland colors spread along the western side and reach inward through branching lowland corridors, creating a strong contrast with the more compact developed patches.
Land cover should not be read as zoning or legal land use. A cell classified as agriculture does not identify a farm parcel or establish how the property may be used, and a forest cell says nothing about ownership. Annual NLCD classifies the surface seen in satellite-based data into broad categories, so this page treats the maps as county-scale environmental reference images rather than parcel records.
The river edge explains why wetlands are hard to miss
Marengo County sits in west-central Alabama, with the Tombigbee River forming much of its western boundary. Near Demopolis, the Black Warrior River joins the Tombigbee. That geographic setting is useful when reading the broad teal wetland areas on the map, especially in the western and northwestern portions of the county and along the branching corridors that extend inland.
Wetlands make up 22.56 percent of the mapped 2025 cover, a far larger share than open water. The forest-and-farmland summary lists water at 1.08 percent. The distinction matters: open-water pixels represent the river, lakes, or other water surfaces, while wetland classes identify vegetated or saturated lowlands that can occupy much broader areas around a drainage network.
Forest continuity breaks into a broader farm pattern in the north
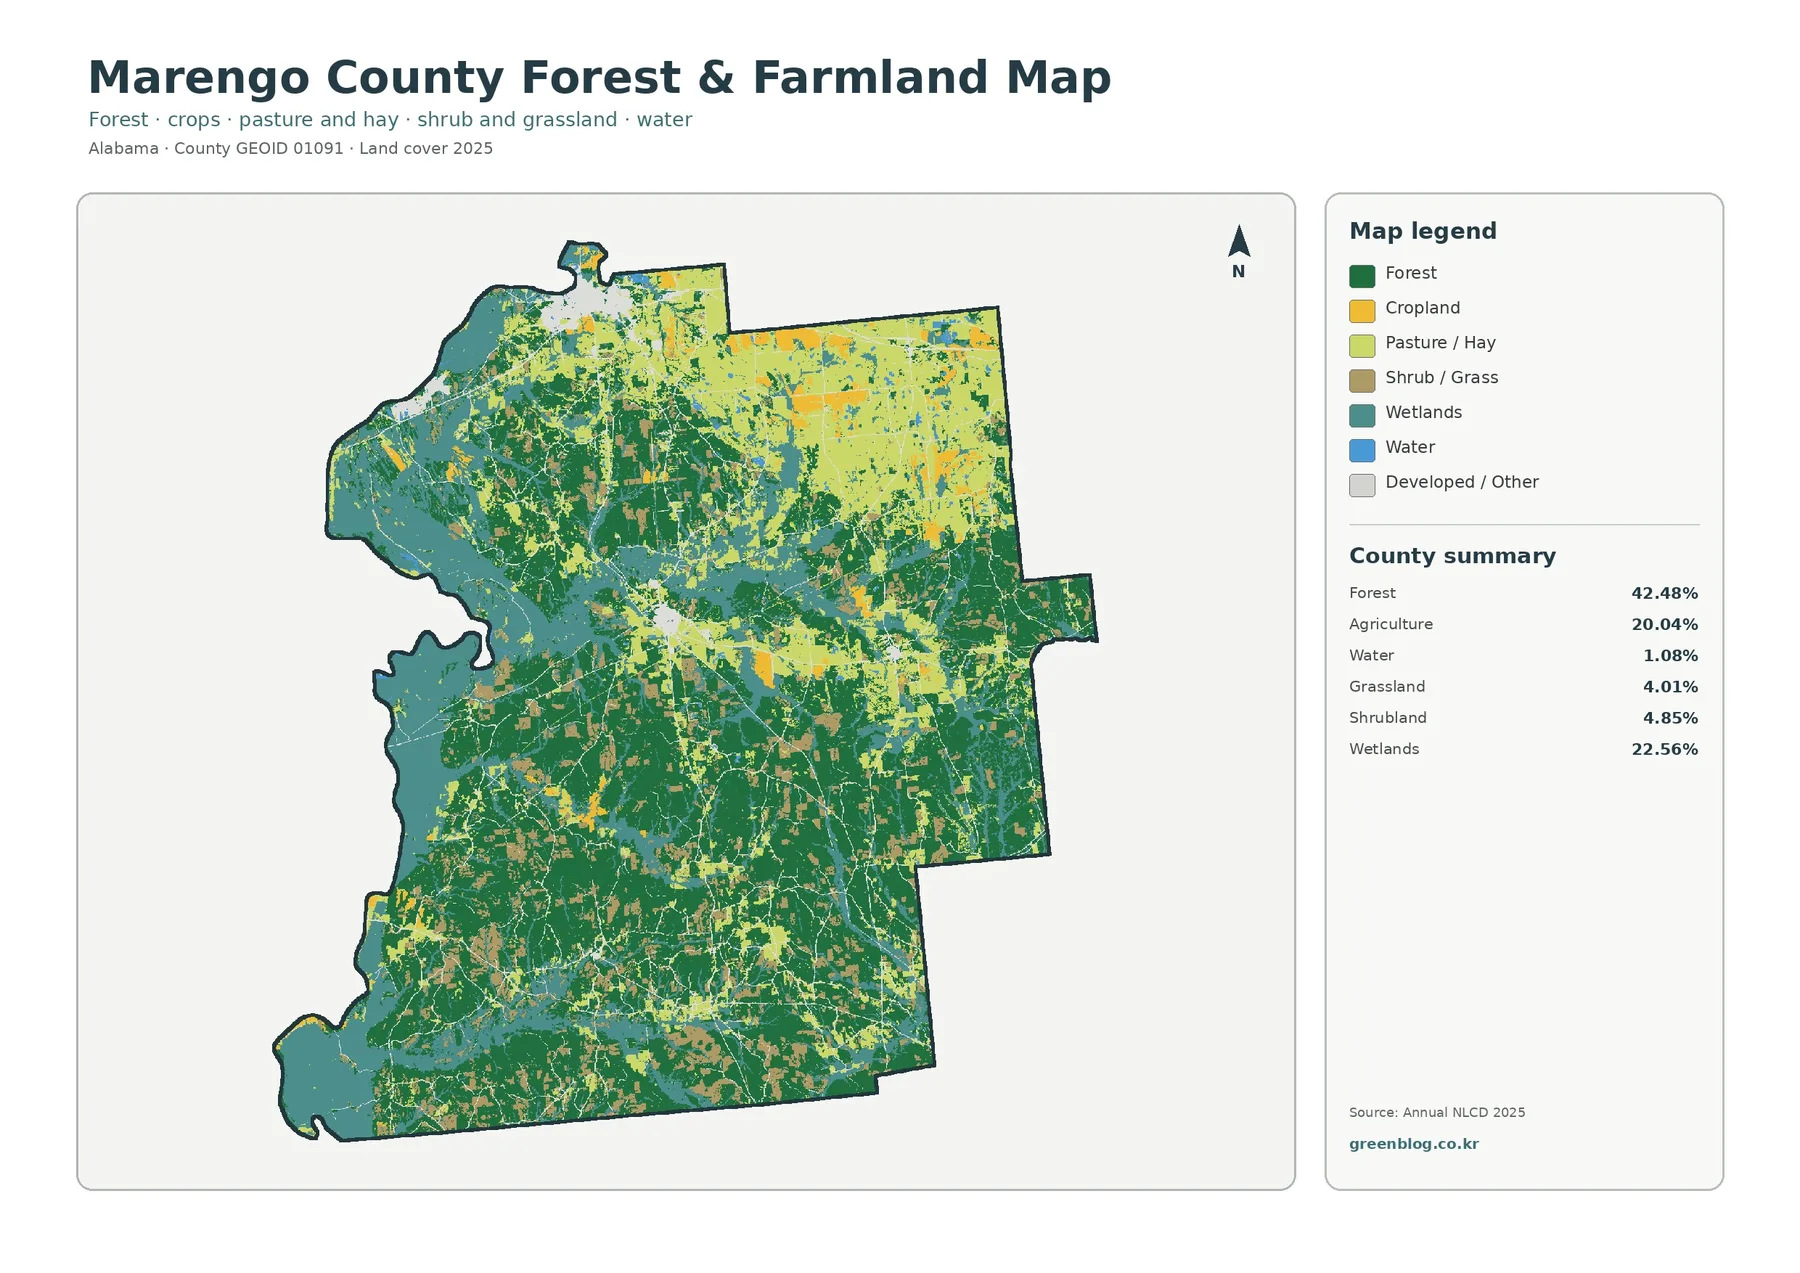
The forest-and-farmland map removes some of the visual competition of the full legend and makes the county’s north-to-south contrast easier to see. Forest remains the largest category at 42.48 percent, filling large parts of the central and southern interior. Cropland and other agricultural cover becomes more prominent in the northern and northeastern part of the county, with smaller fields and open areas scattered farther south.
Marengo County is part of Alabama’s Black Belt. The Encyclopedia of Alabama describes a band of dark prairie soil across the northern part of the county and sandier or clay-rich soils farther south. That local description provides useful background for the mapped contrast between the more open agricultural north and the more heavily forested interior and south, although soil alone should not be treated as proof of why every individual field or forest patch occurs where it does.
A small developed share can still form very visible local clusters
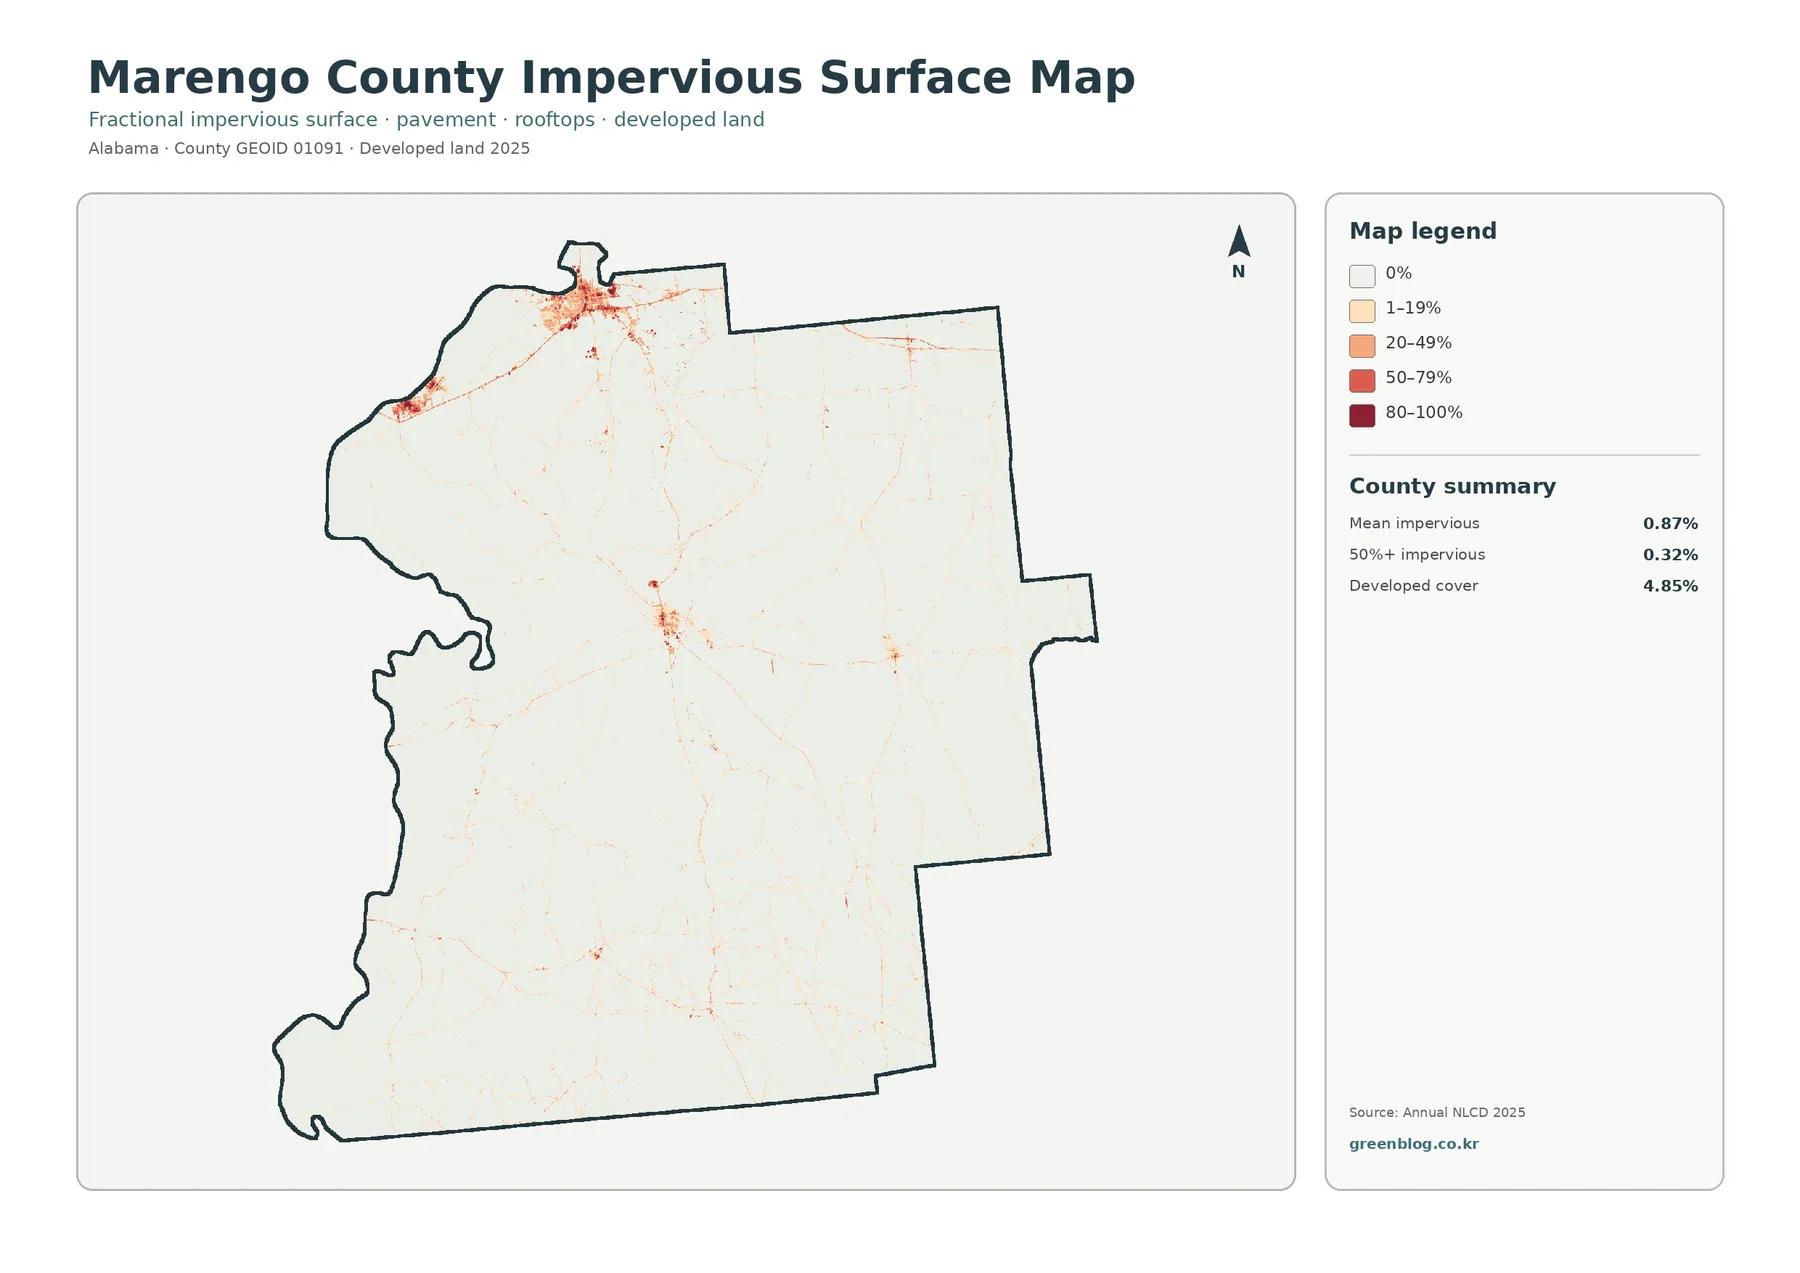
Impervious surface is the portion of the ground covered by materials such as pavement and rooftops that do not readily absorb water. The Marengo County summary reports a mean impervious value of 0.87 percent, with only 0.32 percent of the county in the 50-percent-or-higher impervious category. Developed cover in the broader land-cover classification is 4.85 percent.
Those numbers match the visual impression: most of the county remains pale on the impervious map, while stronger orange and red values appear in compact clusters and thin linear traces. The most pronounced concentration is in the northern part of the county around the Demopolis area. Smaller clusters occur in the interior, where Linden and other communities provide much more modest developed footprints.
What changed between 1985 and 2025—and what the colors do not prove
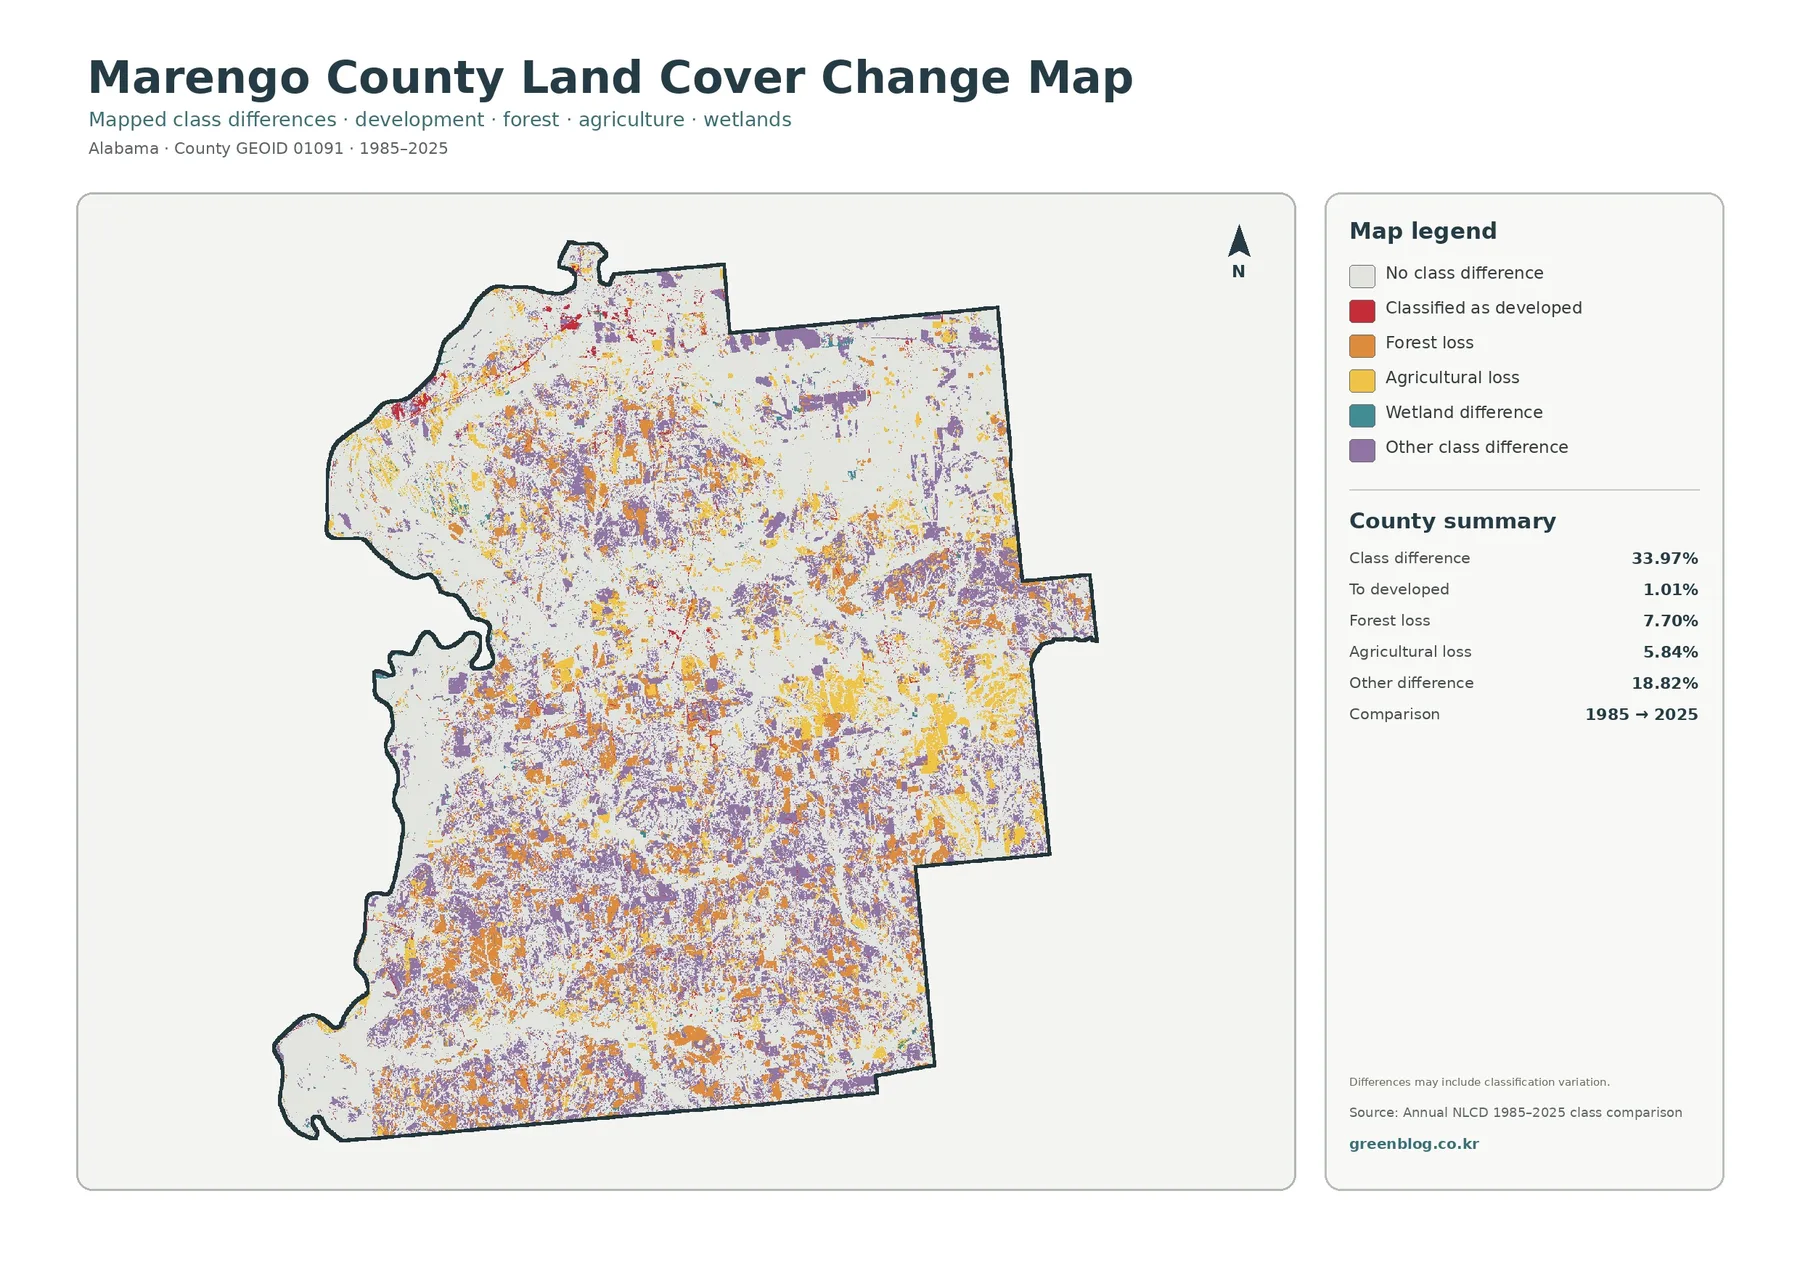
The long-term map compares land-cover classes in 1985 and 2025. Its summary reports class differences across 33.97 percent of the county. Within the listed change categories, 1.01 percent is classified as change to developed land, 7.70 percent as forest loss, 5.84 percent as agricultural loss, and 18.82 percent as other class difference.
The map itself notes that differences may include classification variation. Annual NLCD is designed for consistent long-term comparison, yet satellite conditions, mixed pixels, and classification uncertainty can still affect individual cells. For a project that depends on a particular site or year of change, the appropriate next step is to compare the underlying Annual NLCD data with aerial imagery or another independent source.
Reading the legend at 30-meter scale
Annual NLCD is raster based and uses 30-meter pixels derived from satellite imagery. At that scale, a pixel can contain more than one real-world surface. A roadside tree line, a small building, grass, and pavement may occupy the same 30-meter area, yet the land-cover product must assign a class and the impervious product must summarize the hard-surface fraction.
That is why small boundaries should be read as generalized. The edge between forest and farmland may look blocky, a narrow stream may be incomplete at page scale, and a small developed feature may merge with surrounding cover. These effects are normal for a countywide thematic map and do not mean the map is intended to replace a survey or parcel database.
Choosing the right map for a class, report, or comparison
For a general county profile, use the main land-cover map first. It keeps forest, agriculture, wetlands, water, development, shrubland, grassland, and barren cover in one view, so readers can quickly understand how varied Marengo County is. It works well as the opening figure in an environmental profile or regional presentation.
For runoff or built-surface context, the impervious image is more informative than the general developed class. It shows where pavement and rooftops are concentrated and separates 0 percent, low, moderate, high, and very high impervious values. It should not be used as a drainage model or flood-risk map, but it can help a reader identify where hard surfaces are most concentrated before moving to engineering or watershed data.
What to verify before using the map for a property or project
These maps are designed for county-scale reference. They do not show ownership, parcel lines, zoning districts, conservation easements, building permits, or legally delineated wetlands. A forest-colored cell can cross several properties, and an agricultural-colored area may include surfaces that are not being actively cropped in the way a local farm record would define them.
The 2025 maps are also a snapshot. Logging, construction, planting, flooding, or other changes that happened after the observation year may not appear. The 1985–2025 map compares two endpoints and does not describe every intermediate step, so a location that changed more than once can have a more complicated history than the final color suggests.
For regulatory or engineering decisions, use the relevant agency and site-specific datasets. For broad environmental education, regional comparison, presentation graphics, or a first look at where forest, farms, wetlands, and developed surfaces are concentrated, the four maps provide a practical and consistent countywide reference.
Download the four Marengo County land-cover JPG maps
The download contains the same four map themes shown on this page as original JPG files. Each image is 2480 × 1754 pixels, so the set can be kept together for side-by-side comparison, inserted into a report, or printed at a size appropriate for the available resolution. The archive does not include GIS layers or parcel data.
Frequently Asked Questions
What is the largest land-cover class in Marengo County?
Forest is the largest 2025 class at 42.48 percent. Wetlands account for 22.56 percent and agriculture for 20.04 percent. The map shows forest most continuously through the central and southern county, while agricultural cover becomes broader in the north and northeast.
Does the 22.56 percent wetland share define regulated wetlands?
No. It is a county summary of the Annual NLCD land-cover classification. Regulatory wetland boundaries, permit requirements, and property-level determinations require current agency information and, when necessary, site-specific investigation.
Does every colored cell on the 1985–2025 map represent a confirmed physical change?
Not necessarily. The map records class differences between the two endpoints, and some differences can reflect classification variation or mixed-pixel effects. A site-specific change should be checked against the source data, aerial imagery, or another independent record.
Map File Information
The ZIP contains the four original JPG maps used for this Marengo County land-cover page.
- Included Files: general land cover, forest & farmland, impervious/developed land, and land-cover change maps
- Printable Size: 2480 × 1754 pixels each
Related Maps
- Autauga County Alabama Land Cover Map
- Baldwin County Alabama Land Cover Map
- Barbour County Alabama Land Cover Map
Sources and reference material
Map percentages and change categories come from the supplied 2025 Annual NLCD-based maps and the 1985–2025 comparison. River, community, and Black Belt context was checked against the following public references.
- MRLC Annual NLCD — current Annual NLCD products and data access
- USGS Annual NLCD Collection 1.2 Land Cover — 30-meter raster land-cover documentation and 1985–2025 coverage
- U.S. Census Bureau TIGER/Line Shapefiles — county boundary data documentation
- Encyclopedia of Alabama: Marengo County — Demopolis, Linden, Black Belt soils, waterways, and county geography
- Alabama Department of Environmental Management: Tombigbee River Basin — Tombigbee River basin context and the Black Warrior confluence near Demopolis
Green Map creates custom-edited map images using open geographic data sources such as geoBoundaries, Natural Earth, OpenStreetMap, and government open data.
These maps are edited visual materials, not raw data files, and are provided for education, documents, presentations, and graphic reference.