Briscoe County sits where the high, relatively open plains of the Texas Panhandle break toward a much more dissected eastern landscape. Silverton is the main civic reference on the western side of the county, while Quitaque lies farther southeast near the lower terrain and dense network of draws and streams. This Briscoe County Map page brings those contrasts together through boundary and road, city, water, and elevation views. The same four map types shown in the article are also available as high-resolution JPG files in one ZIP download.
The county is easiest to understand by comparing its two halves rather than treating it as a uniform rectangle. Roads across the west and southwest form a noticeably straighter grid around Silverton and the surrounding open land. Moving east, the road pattern becomes less regular as branching waterways and deeply cut terrain take over. The water map makes that drainage network explicit, and the elevation map shows a sharp drop from the higher western surface into lower country to the east and northeast. The city view strips away most detail so the positions of Silverton and Quitaque can be compared without distraction.
Table of Contents
Roads and settlements from Silverton to the eastern county
The general county map combines the boundary, local places, roads, and waterways in a single view. Silverton appears in the southwestern part of the mapped county, while Quitaque is farther southeast. Around Silverton and across the western half, numbered routes such as 1, 145, 284, 207, 378, 6, 149, and 17 sit within a broad grid of mostly straight roads. Routes 12 and 256 are also visible around Silverton. This pattern gives the western side a very different appearance from the eastern half, where road lines are farther apart and are mixed with curving drainage features.
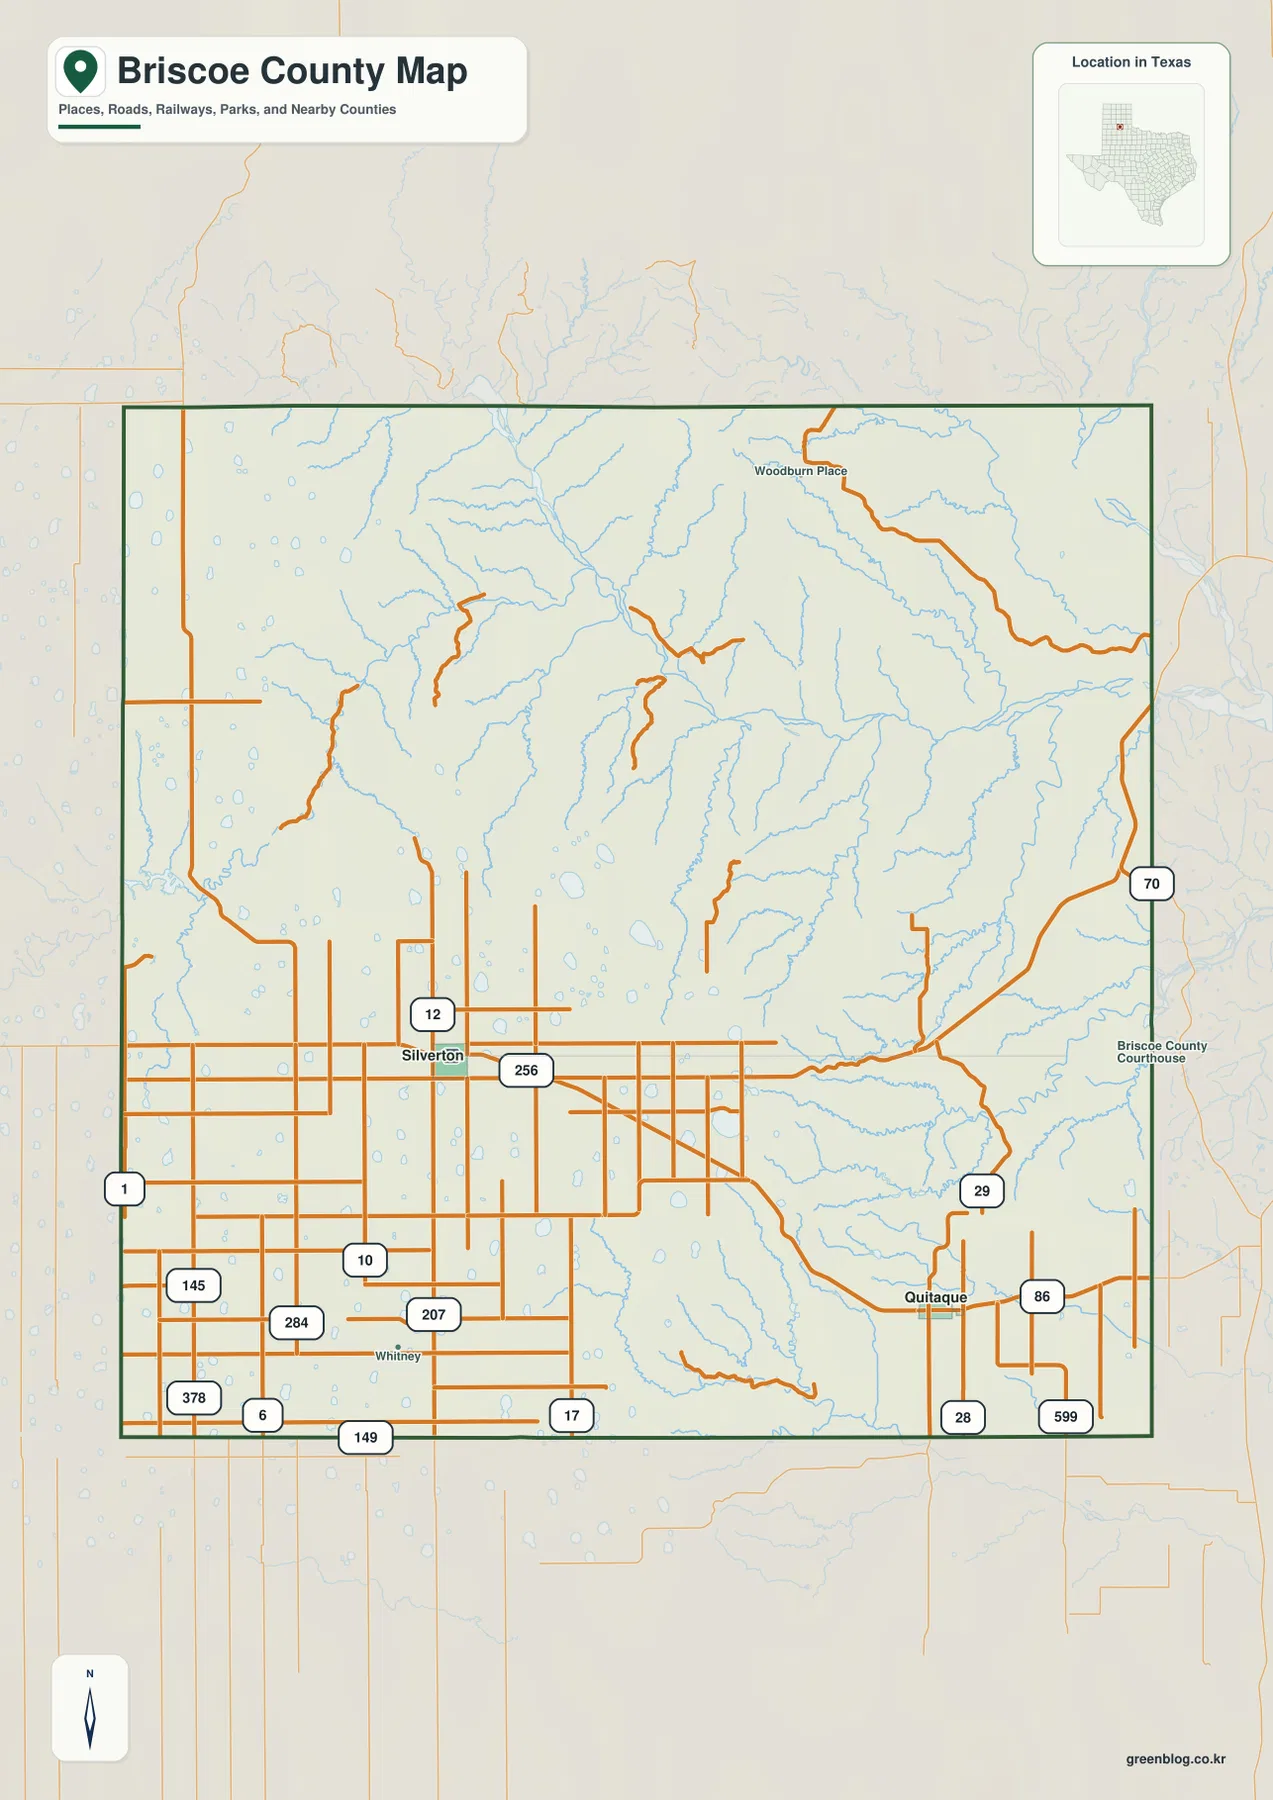
Near the eastern edge, routes 70 and 29 are labeled, while 86, 28, and 599 appear around and south of Quitaque. The map also labels Woodburn Place in the north and Briscoe County Courthouse near the eastern side. Those smaller labels are useful, but the simplest way to orient yourself is to locate Silverton and Quitaque first. From there, compare the rectilinear road grid to the west with the winding blue stream lines to the east. The difference is immediately visible and provides a practical introduction to the county’s transition from high plains to rougher canyon country.
Silverton and Quitaque as the two city reference points
The city map removes most of the road detail and emphasizes the locations of the county’s two ranked places. Silverton is marked first with a value of 498 in the city index, and Quitaque is marked second with 347. The useful part of this view is not simply the ranking. It shows that Silverton sits well west of Quitaque and that the two places occupy different parts of the county’s terrain. Silverton lies on the flatter western surface, while Quitaque is positioned closer to the southeastern zone where branching waterways and lower relief become much more prominent.
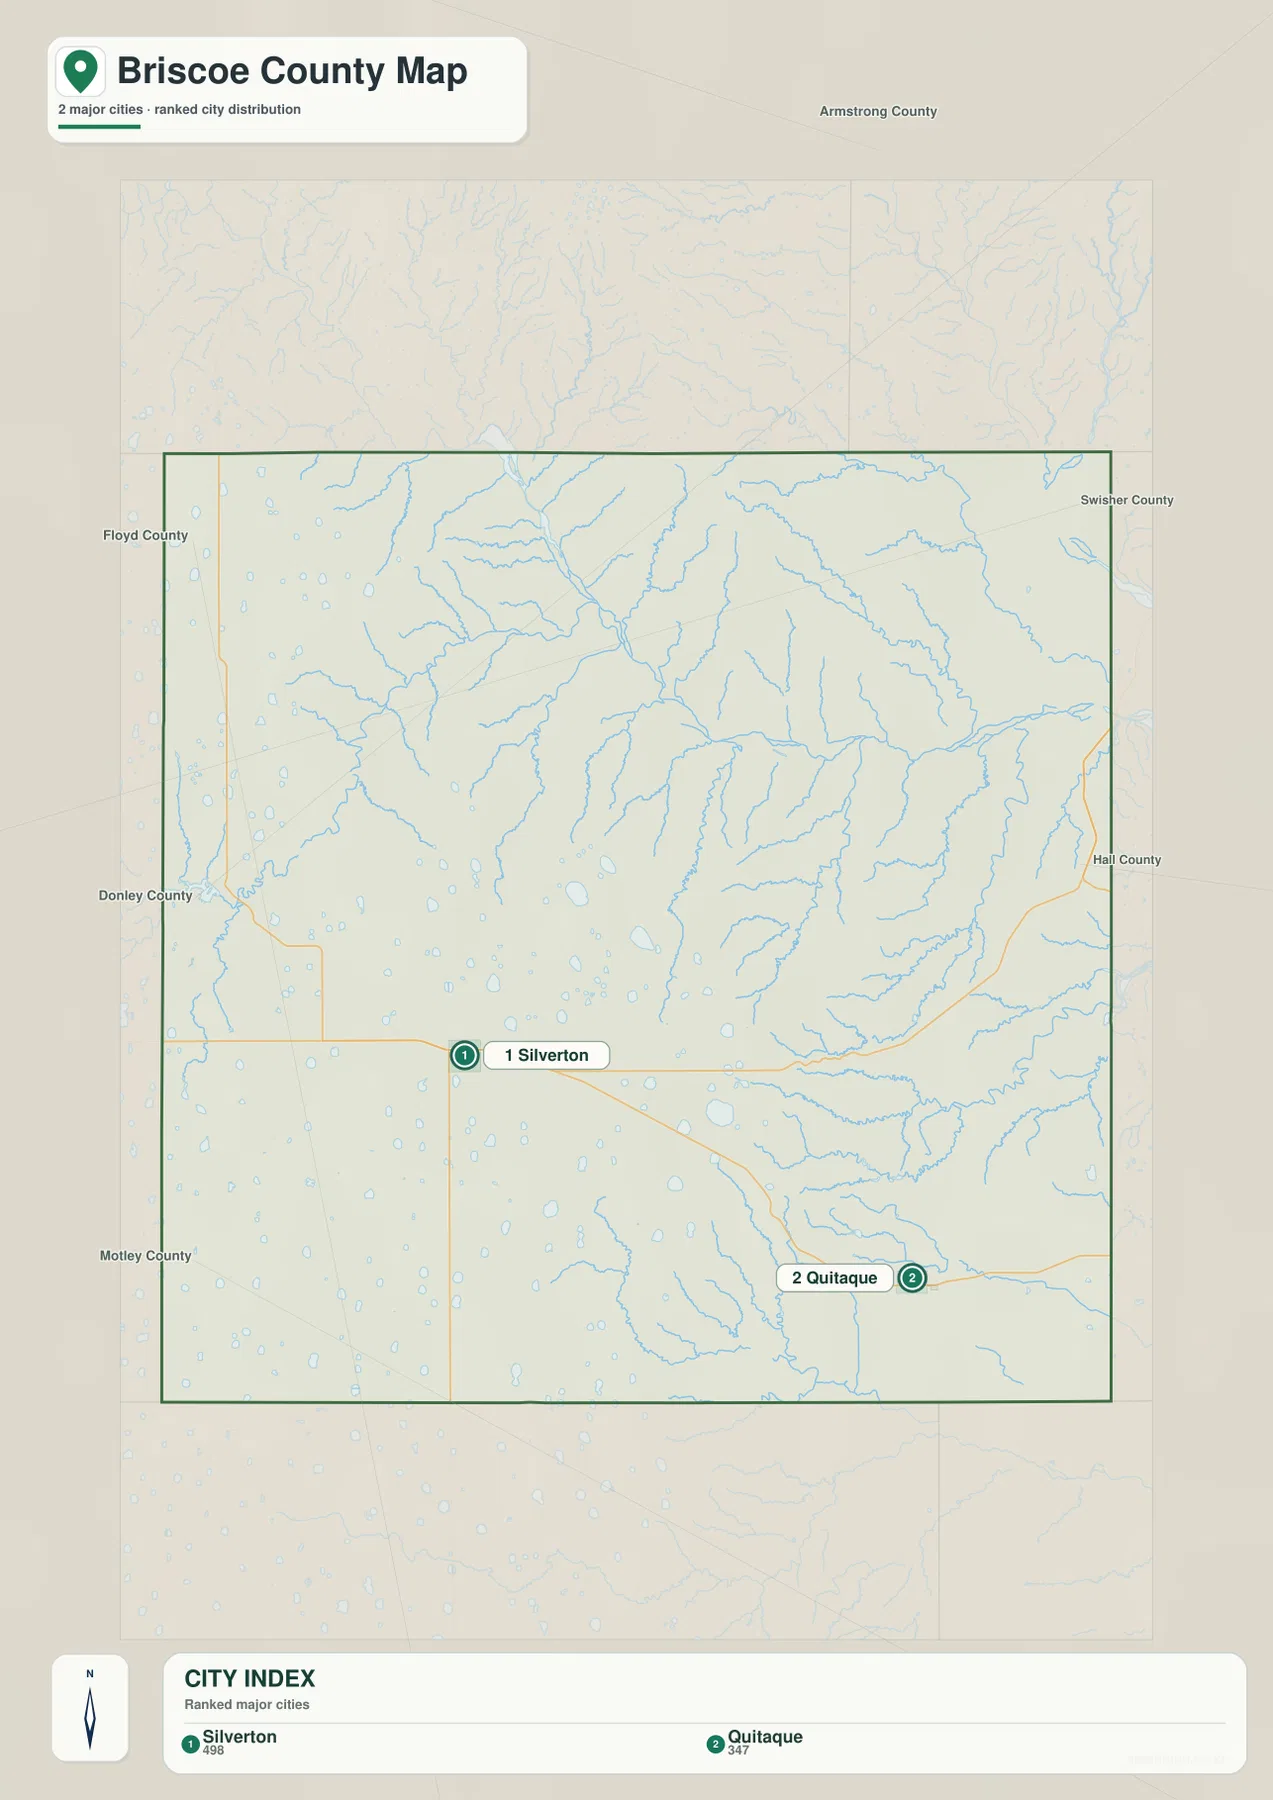
Neighboring county labels help establish direction. Armstrong County is shown to the north, Swisher and Hall to the east, Floyd and Donley to the west, and Motley to the southwest. That surrounding frame makes it easier to see which side of Briscoe County a trip or map comparison is approaching. This city map is not a driving-distance calculator, and it does not show a road route between the two places. Its strength is clarity: when a reader only needs the relative positions of Silverton and Quitaque before moving to a more detailed map, this version provides the quickest orientation.
Prairie Dog Town Fork and the branching eastern drainage
The terrain-and-water map shows why the eastern part of Briscoe County looks so different from the western plains. Prairie Dog Town Fork Red River is the strongest labeled water feature across the northeastern part of the county. Tule Creek curves in from the northwest and joins the larger drainage, while Hackberry Creek and Bitter Creek are labeled farther east. Instead of a few isolated blue lines, the map shows many tributaries feeding into a broader network. Their shape follows valleys and cuts in the land, so the water pattern is closely tied to the county’s relief rather than to the straight administrative boundary.
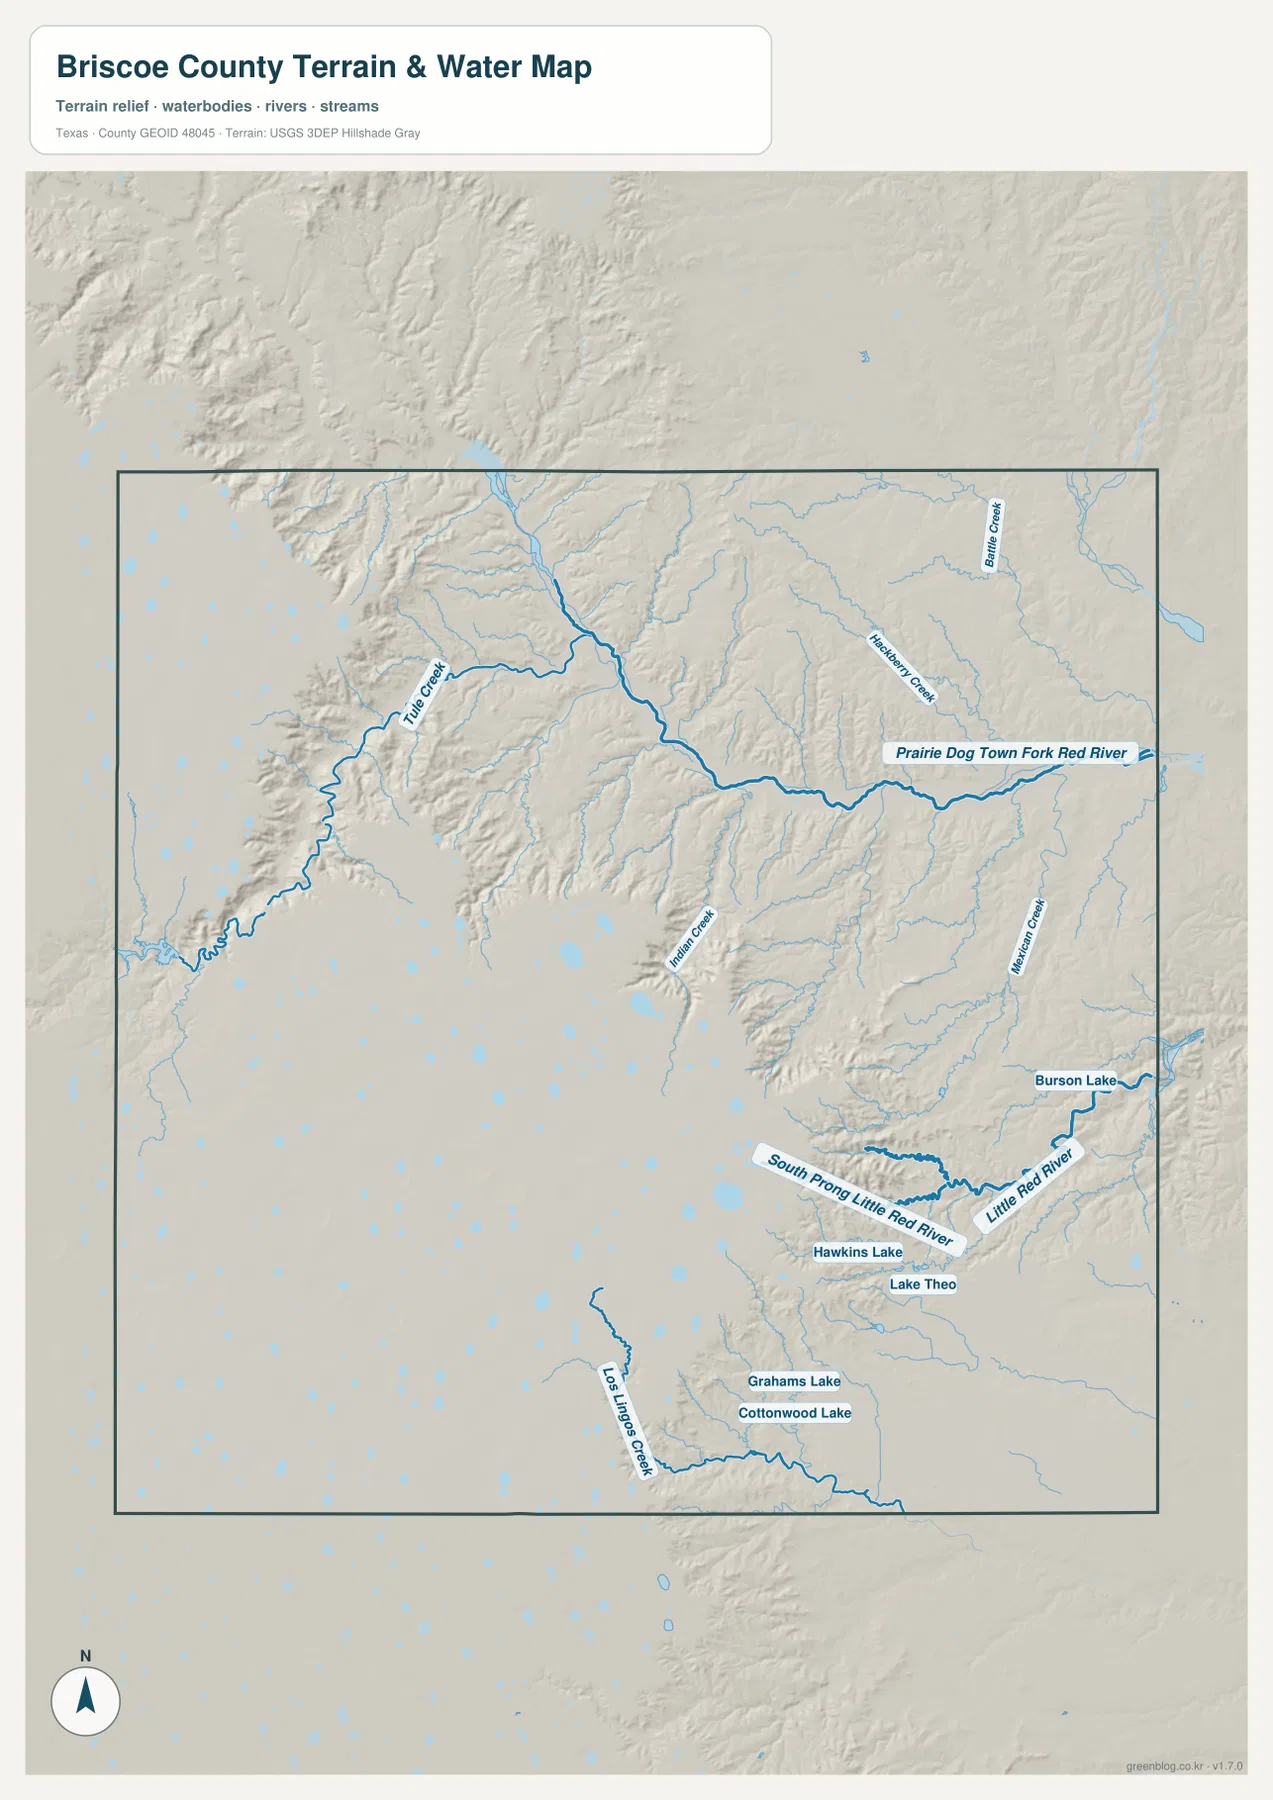
The southeastern drainage includes Little Red River and South Prong Little Red River. Burson Lake, Hawkins Lake, and Lake Theo are labeled nearby, while Grahams Lake and Cottonwood Lake appear farther south. Los Lingos Creek is visible near the southwestern boundary. Together these labels show a strong contrast: much of the east is cut by interconnected stream valleys, whereas the western surface contains more scattered water features across comparatively open terrain. This map is intended for geographic reference. It should not be treated as a flood-hazard map, parcel map, depth chart, or navigation product.
A 400-meter-plus elevation change across one county
The elevation map makes the county’s west-to-east transition unmistakable. Its legend reports an actual mapped range of about 624 to 1,027 meters, with a mean near 861 meters. Brown and tan dominate the west and southwest, representing the higher surface, while greens spread across the northeast and east at lower elevations. Along the boundary between those zones, the colors change over a short distance and the shaded relief becomes sharply incised. That edge corresponds to the dramatic terrain change associated in the supplied material with the Caprock Escarpment.
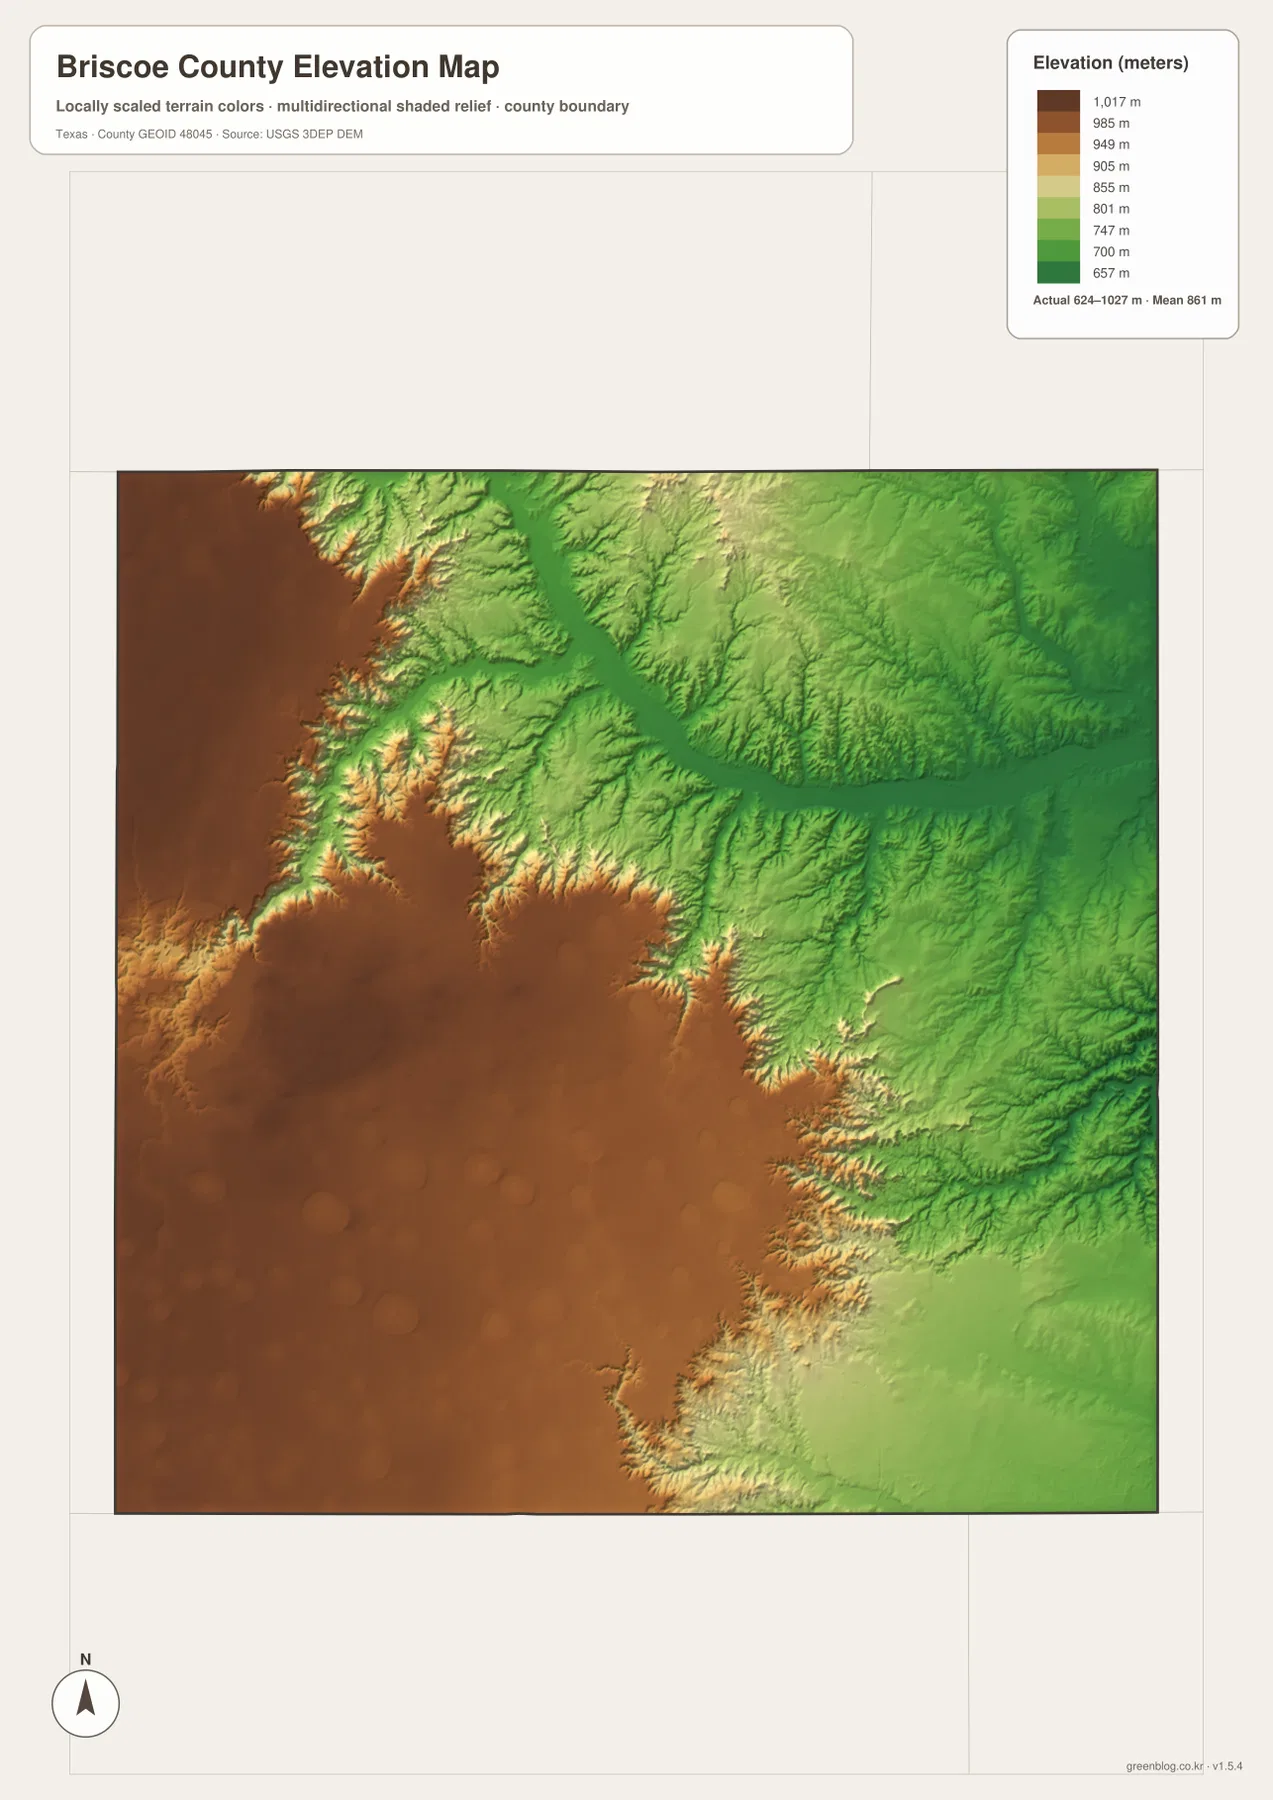
This relief also helps explain patterns visible on the other maps. Straight roads are more common across the high western surface, where broad open areas allow a regular grid. To the east, streams branch into valleys and the road network no longer follows the same simple pattern. Prairie Dog Town Fork Red River occupies the lower northeastern drainage, while Little Red River and related channels cut through the southeast. The elevation surface is generalized for regional map reading, however. It is not survey-grade elevation and should not be used for engineering design, property-level grading, or other work that depends on precise site measurements.
What each map is best at showing
If the goal is to locate roads, settlements, and the county boundary in one place, the general county map should be the first choice. It gives enough detail to see how Silverton and Quitaque connect to the broader road network while still showing rivers and streams. The city view is cleaner when the only question is where the two principal places sit within the county. For drainage names, tributary relationships, lakes, and the shape of valleys, the water map is much more informative. The elevation map is the strongest choice for explaining why the western and eastern halves have such different terrain.
Those differences matter when printing a map for a specific task. A classroom exercise about county seats and nearby places does not need every labeled creek. A geography lesson on drainage is clearer with Prairie Dog Town Fork Red River, Tule Creek, and the Little Red River system visible. A discussion of the Caprock transition benefits from the elevation colors rather than a dense road layer. Choosing the map that matches the question usually produces a cleaner page and avoids forcing too much information into a single figure.
Reading Briscoe County beyond its boundary line
The county line is an important administrative reference, but the physical landscape continues through it. The city map places Armstrong, Swisher, Hall, Floyd, Donley, and Motley counties around Briscoe County, giving a useful regional frame. Waterways on the eastern side continue toward neighboring areas, and the elevated western surface is part of a broader plains landscape. Comparing nearby county maps can therefore clarify whether a road grid, valley system, or elevation change is confined to Briscoe County or continues across a wider part of the Texas Panhandle.
A practical reading sequence is to begin with Silverton as the western reference point and Quitaque as the southeastern reference point. Next, trace Prairie Dog Town Fork Red River across the northeast and the Little Red River system in the southeast. Finally, compare those features with the elevation colors, where the high western plateau gives way to lower green terrain. This sequence connects place names, water, and relief without turning the map into a list of unrelated labels. It also makes the contrast between the county’s open western roads and its dissected eastern drainage much easier to remember.
High-resolution JPG map files
The WebP images in the article are convenient for on-page viewing, while the downloadable archive contains matching high-resolution JPG versions. The ZIP includes the county map, city map, terrain-and-water map, and elevation map, so there is no need to download each item separately. The JPG files are suitable for printing, classroom materials, presentations, or offline reference. When working on screen, the article previews are enough for quick orientation; when a larger image is needed, use the archive below.
Frequently Asked Questions
Which map shows Silverton and Quitaque most clearly?
The city map is the simplest choice because it emphasizes only the two ranked places and their positions inside the county. Silverton appears on the western side and Quitaque farther southeast. Use the general county map afterward if you also need road numbers, nearby labels, and waterways.
How much elevation change is shown across Briscoe County?
The supplied elevation map lists an actual range of about 624 to 1,027 meters and a mean near 861 meters. The highest colors are concentrated across the west and southwest, while lower green terrain spreads across the east and northeast. These values are appropriate for regional comparison, not precision surveying.
What is the main water feature to locate first?
Prairie Dog Town Fork Red River is the clearest large water feature in the northeastern part of the water map. From there, follow Tule Creek and the smaller northern tributaries, then compare them with Little Red River and South Prong Little Red River in the southeast. The map is for geographic reference and does not provide flood-risk or navigation information.
Map File Information
The ZIP contains high-resolution JPG versions of the Briscoe County boundary/road, city, water, and elevation maps shown on this page.
- File Type: JPG
Related Maps
- Armstrong County Texas map
- Swisher County Texas map
- Motley County Texas map
- Potter County Texas map
- Roberts County Texas map
Sources and references
- USGS The National Map Viewer — official map viewing for U.S. terrain, roads, hydrography, and other geographic layers.
- U.S. Census Bureau TIGER/Line Shapefiles — official geographic files for county boundaries, roads, and related features.
- USGS National Hydrography — official information about U.S. surface-water and hydrography data.
- USGS 3D Elevation Program — official information on 3DEP elevation data.
Green Map creates custom-edited map images using open geographic data sources such as geoBoundaries, Natural Earth, OpenStreetMap, and government open data.
These maps are edited visual materials, not raw data files, and are provided for education, documents, presentations, and graphic reference.