Logan County in western Arkansas has a clear split between wooded country and broad agricultural areas. Forest is the dominant 2025 cover at 56.18%, yet agriculture still accounts for 31.89% and becomes especially prominent across the northern part of the county and in several western valleys. Water, developed land, and smaller wetland or grassland patches add local detail around Blue Mountain Lake, the main settlement areas, and the edges of the larger forest blocks.
This page provides four views of that pattern: current land cover, a forest-and-farmland view, impervious surface and developed land, and mapped class differences from 1985 to 2025. The WebP images are intended for quick on-page viewing, while all four original JPG maps are available together in one ZIP download. Each map answers a different practical question, so readers can compare the same county without treating one layer as a complete description of the landscape.
Table of Contents
The county-wide pattern is forest first, agriculture second, with a strong north-to-interior contrast
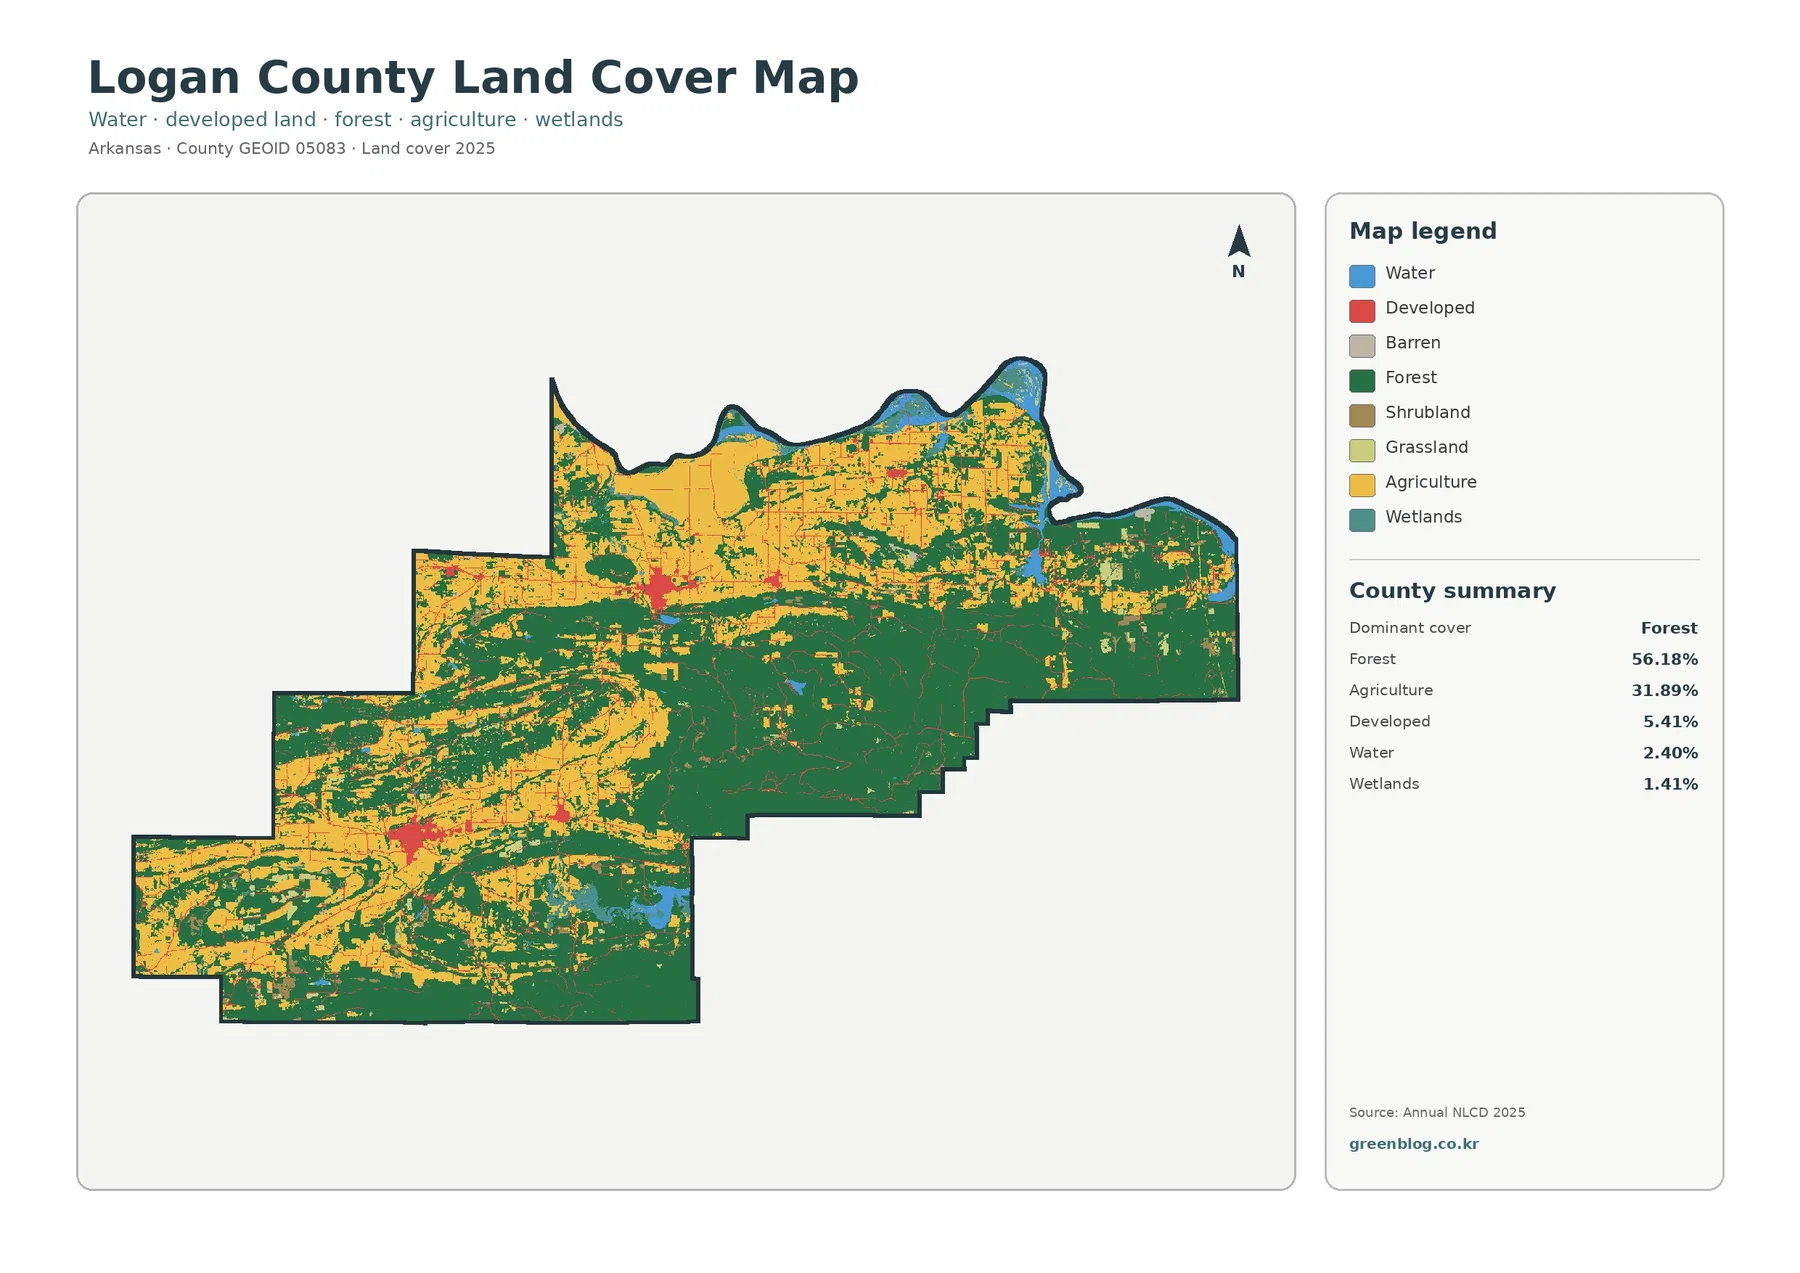
The general land-cover map gives the fastest overview of Logan County. Its summary lists forest at 56.18%, agriculture at 31.89%, developed cover at 5.41%, water at 2.40%, and wetlands at 1.41%. Those totals show why green dominates the county image, but the map itself adds an important qualification: the major cover types are not spread evenly. Large agricultural blocks occupy much of the north and several western sections, while forest becomes much more continuous through the central, eastern, and southern parts of the county.
Across the northern edge, agricultural colors form some of the largest open areas on the map. Forest remains mixed into that zone, especially toward the east, but it does not create the same broad continuous cover that appears farther south. Moving into the county interior, the pattern changes. Wooded areas become larger and more connected, while agriculture breaks into smaller fields and bands. In the southwest, the two covers alternate repeatedly, producing a more mixed appearance than either the northern farm belt or the heavily wooded interior.
Impervious cover isolates the settlement clusters and the thin road network
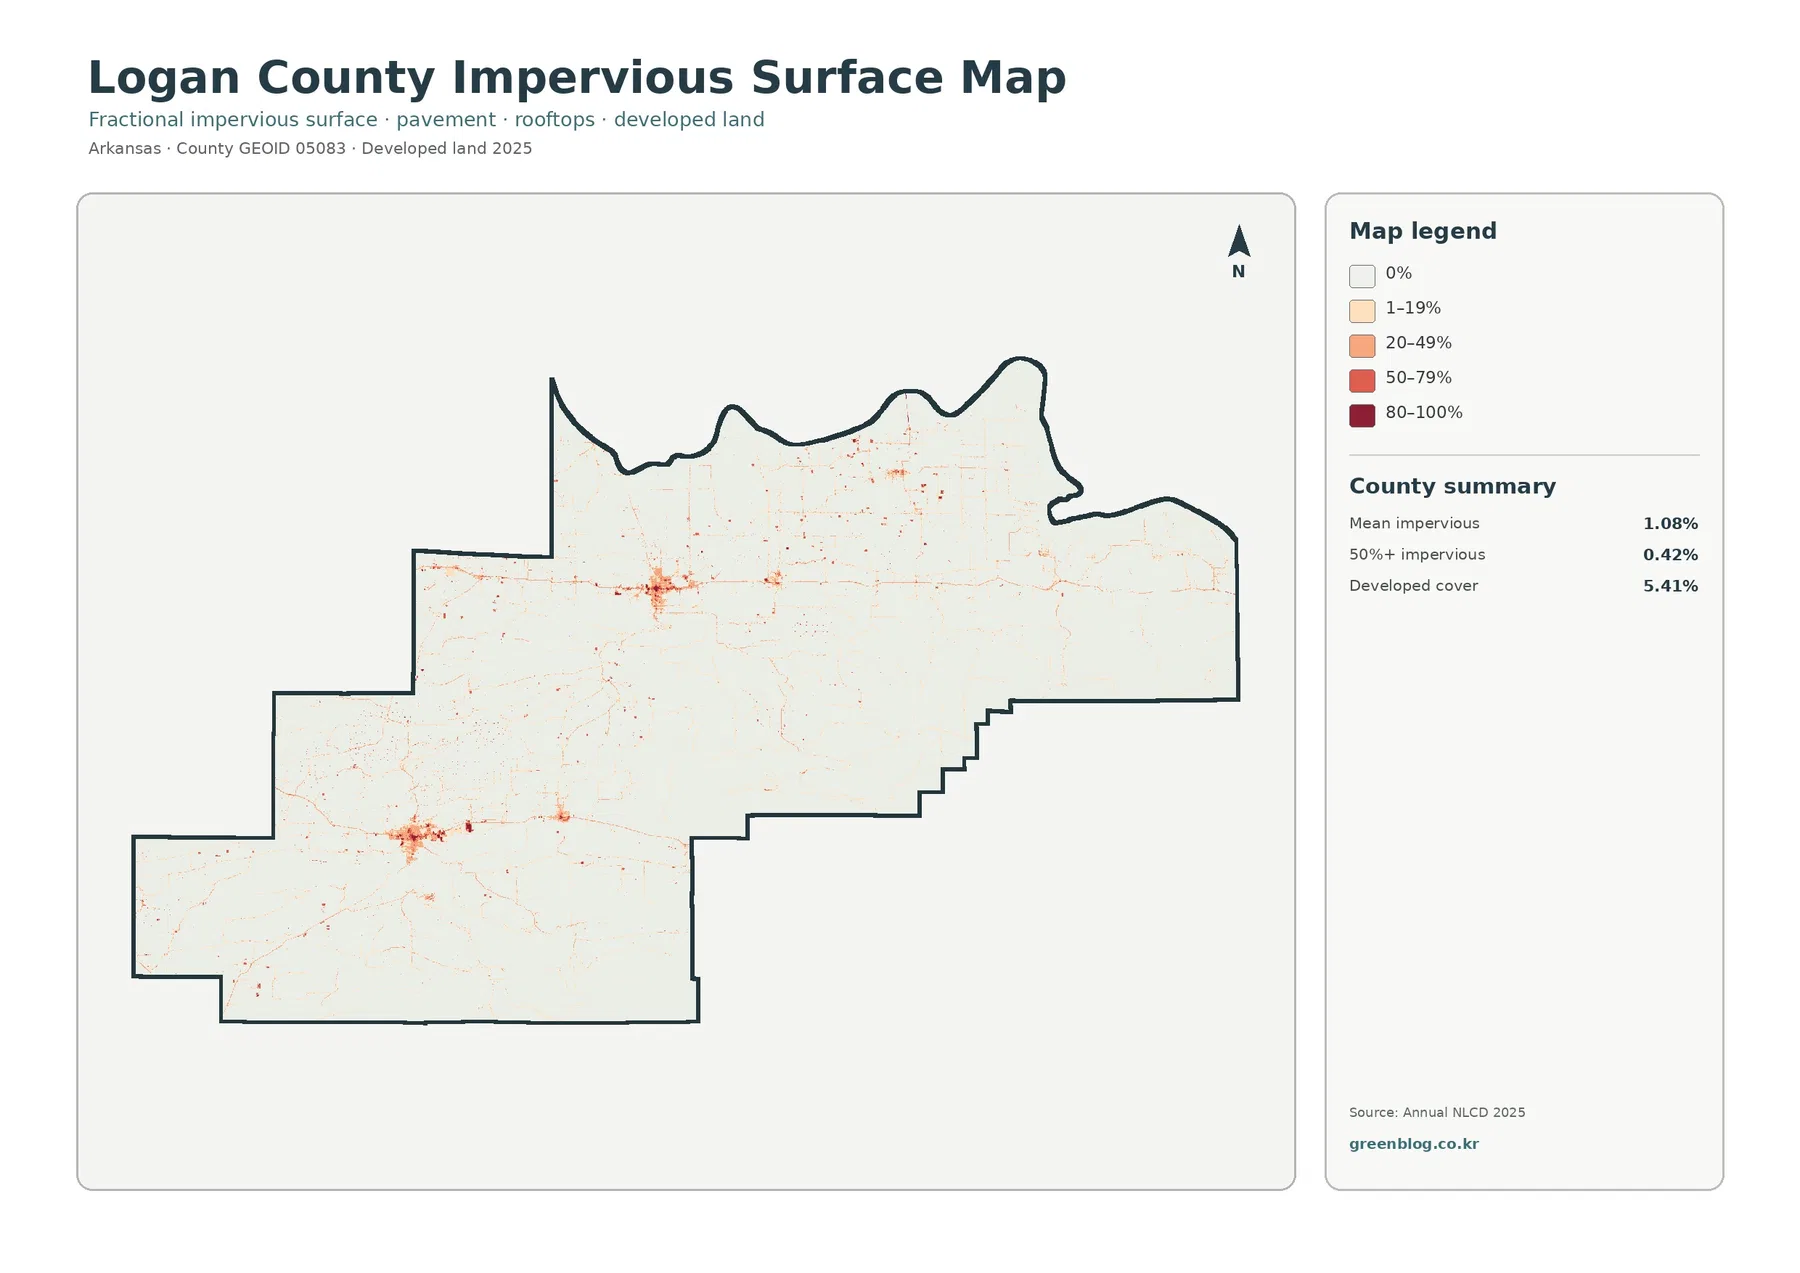
Impervious surface means pavement, rooftops, parking areas, and similar surfaces that do not readily absorb water. Logan County has a mean impervious value of 1.08%, and only 0.42% of the mapped area is shown with impervious cover of 50% or more. Those numbers are much lower than the 5.41% developed-land share because the two measurements are not interchangeable. A developed cell can still contain lawns, trees, bare soil, or other surfaces that allow some infiltration.
Once the forest and farmland colors are removed, the county’s developed pattern becomes unusually easy to see. One large concentration sits in the northern half and another in the southwest. Fine lines extend away from both clusters, tracing the general form of the road network, while a smaller concentration appears between them. Most of the remaining county is very pale, showing that heavily paved surfaces occupy only a small portion of Logan County despite the visible network of communities and roads.
Mount Magazine and Blue Mountain Lake give the forested interior a recognizable geographic setting
Mount Magazine provides important geographic context for the large forested areas in Logan County. Arkansas State Parks identifies the summit at 2,753 feet, the highest point in Arkansas, and places the park about 16 miles south of Paris on Scenic Highway 309. The supplied land-cover map does not draw a mountain boundary, but its extensive forest in the county interior fits the broader setting of wooded uplands around Mount Magazine. This is a useful orientation point without assuming that every green cell belongs to the park or to one ownership.
Blue Mountain Lake creates a different landmark farther south. The U.S. Army Corps of Engineers describes the lake as lying in the Petit Jean River valley near Mount Magazine, with a substantial part of the reservoir in Logan County. On the supplied map, the lake stands out as a larger blue feature surrounded mainly by forest and open agricultural or grassland cover. That arrangement contrasts with the broad farm areas in the north and provides a simple way to orient readers who are unfamiliar with the county shape.
Removing most developed detail makes the farm belts and wooded uplands easier to compare
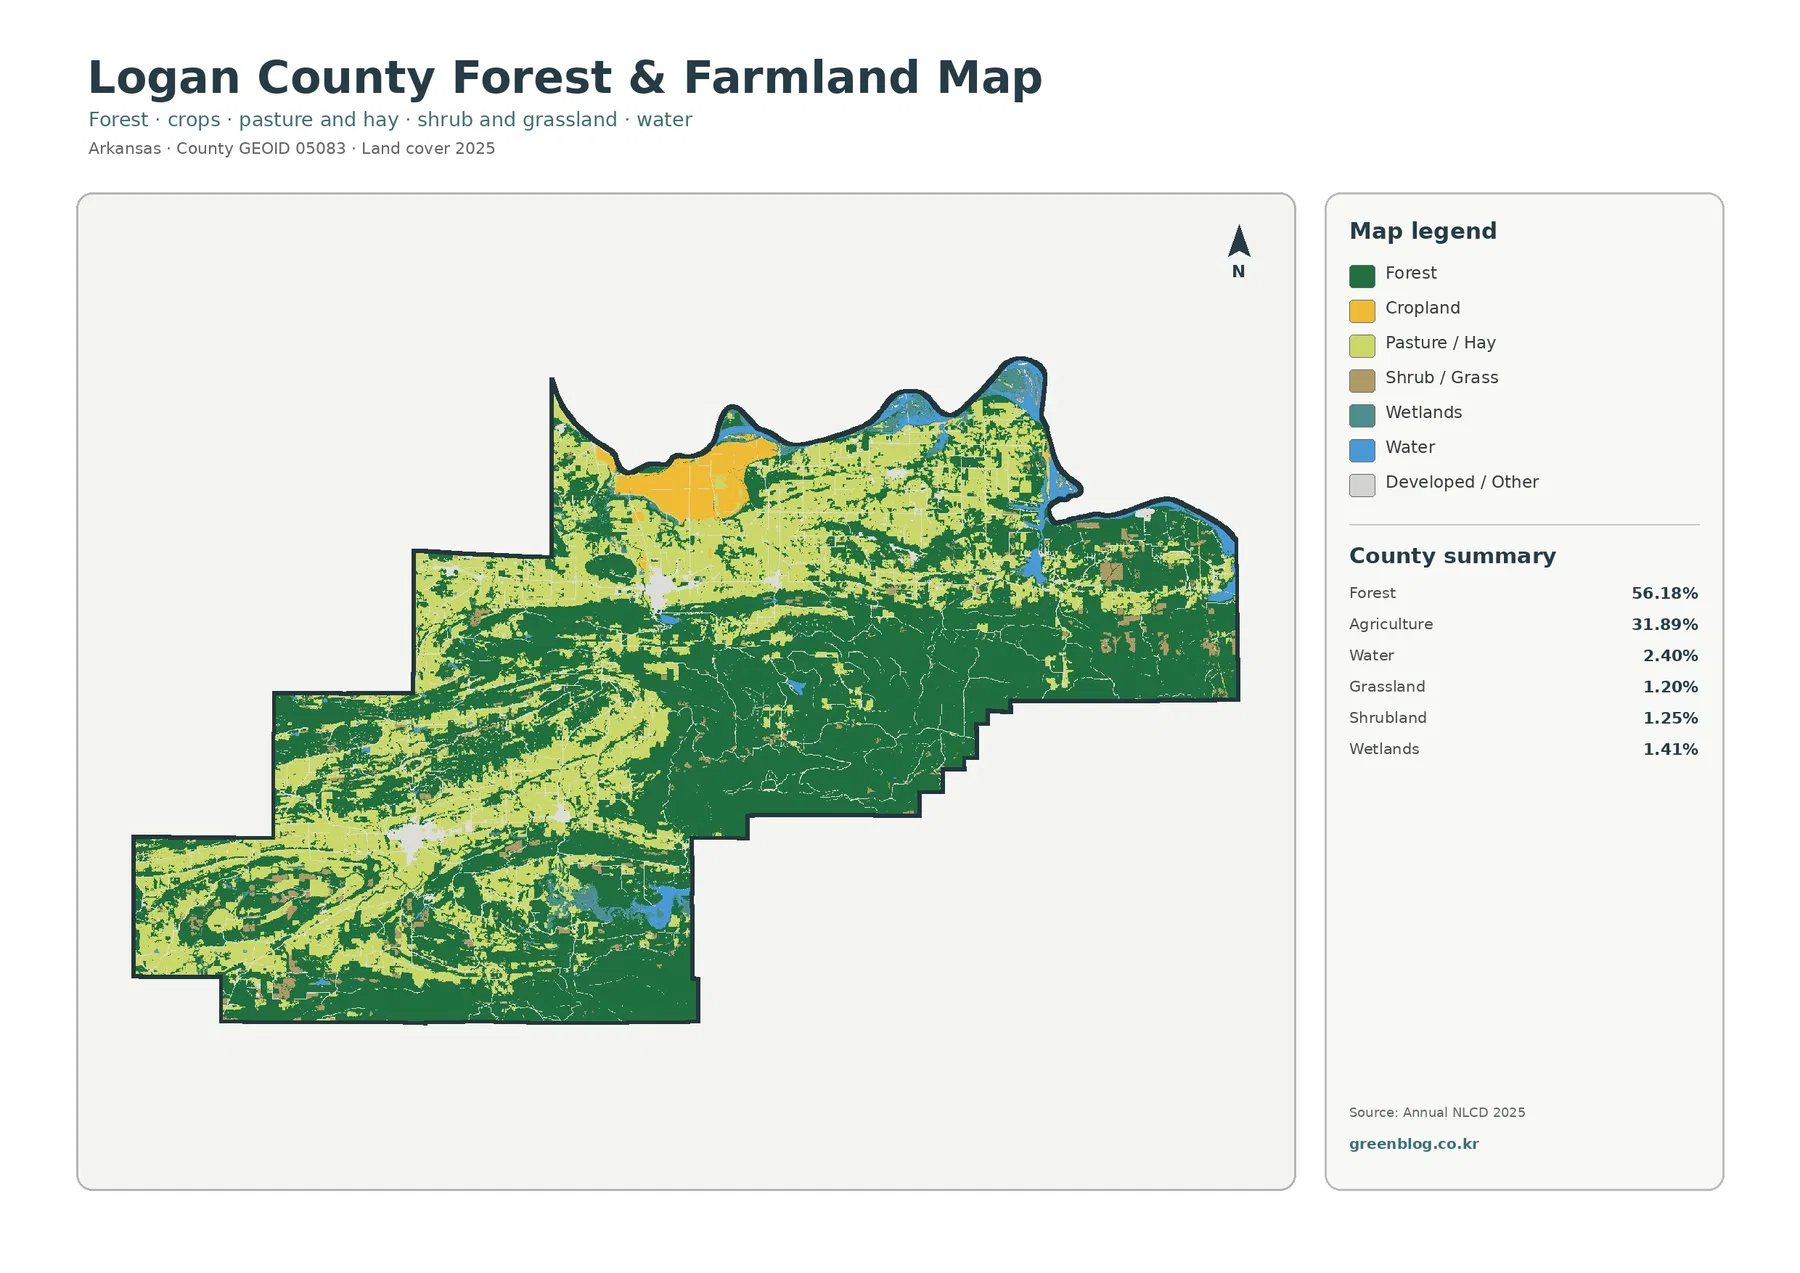
The second map keeps forest and agriculture at the center of the comparison. Forest remains 56.18% and agriculture 31.89%, while grassland is 1.20%, shrubland 1.25%, water 2.40%, and wetlands 1.41%. The simplified legend prevents smaller developed details from distracting from the main rural pattern. It also helps distinguish true agricultural colors from grass or shrub classes that might otherwise be mistaken for farmland at a quick glance.
The northern agricultural belt is especially clear in this version. Large open areas occupy much of the northwest and north-central part of the county, though strips and patches of forest remain mixed within them. Farther south, the balance shifts toward forest. Agricultural cover becomes more fragmented through the interior, and in the southwest it often appears in elongated or irregular patches separated by wooded land. The eastern half is more consistently green, reinforcing the county’s overall forest majority.
USDA’s 2022 Census of Agriculture adds useful local context without replacing the land-cover map. The county profile reports 949 farms and 212,374 acres of land in farms, including 83,784 acres of pastureland, 73,483 acres of cropland, and 44,447 acres of woodland. Those figures use an agricultural reporting framework, while Annual NLCD classifies the visible surface in raster cells. A farm can contain woodland, pasture, buildings, ponds, and roads at the same time, so the two datasets should not be expected to match acre for acre.
The 1985–2025 map marks class differences, not a 40-year development rate
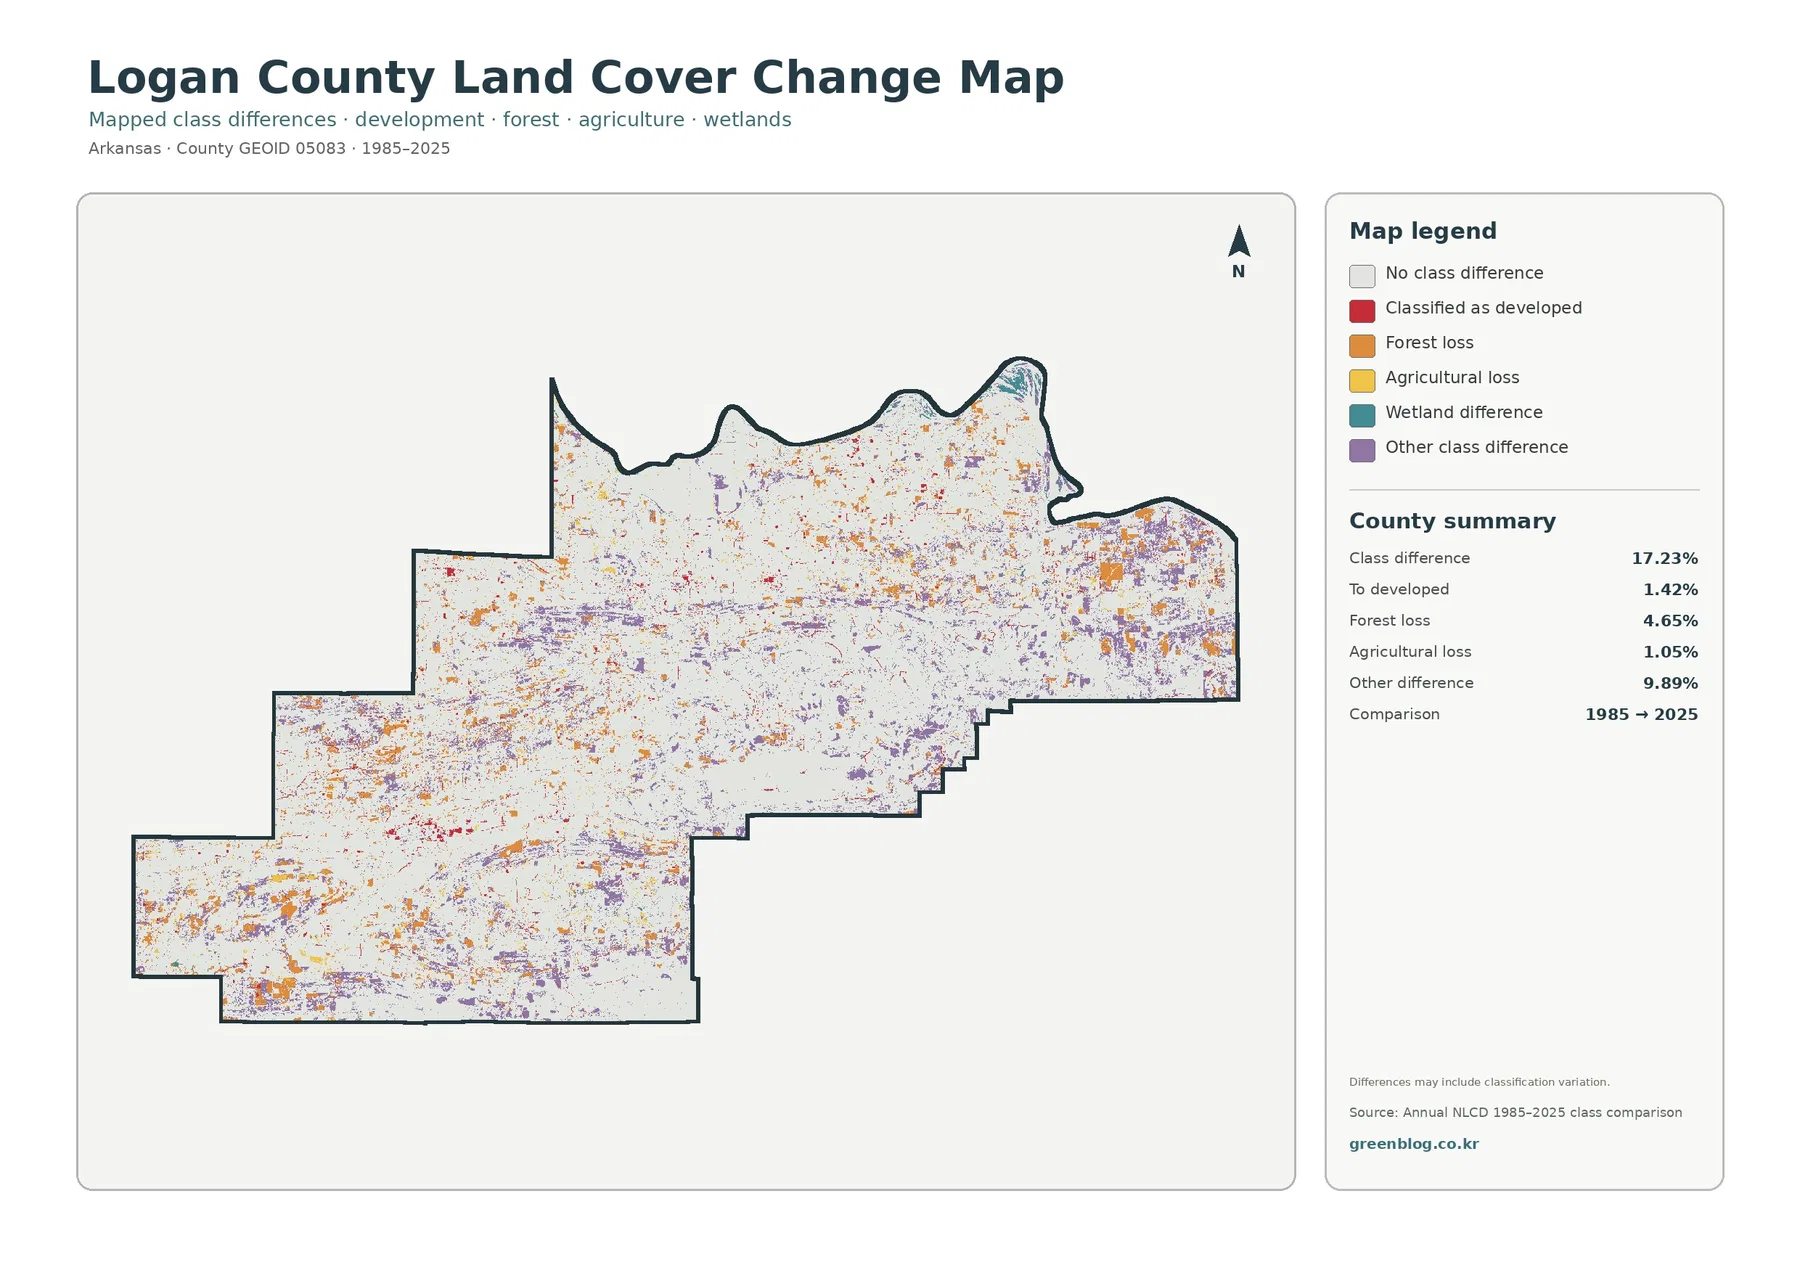
The change map reports a total class difference of 17.23% between 1985 and 2025. Within that total, 1.42% is classified as change to developed cover, 4.65% as forest loss, 1.05% as agricultural loss, and 9.89% as other class difference. The most important reading rule is that 17.23% does not mean that 17.23% of Logan County became urban or was cleared. It is the share of cells whose mapped class differs between the two comparison dates.
Change colors are scattered throughout the county rather than forming one continuous zone. The eastern part contains several noticeable concentrations of forest-loss and other-difference colors, while smaller patches occur across the north, interior, and southwest. Red cells classified as change to developed cover appear near some of the same broad settlement areas that stand out on the impervious map, but the two layers measure different things. The change layer records a class transition between dates; the impervious layer shows the intensity of hard surfaces in 2025.
The map itself notes that differences may include classification variation. Satellite conditions, revised methods, mixed pixels, and other technical factors can make a cell change class even when the real-world change is more complicated than a simple conversion. For that reason, a colored patch is best treated as a place to investigate further. Historical aerial photography, forestry records, planning files, or field observations would be needed before assigning a specific cause to a particular mapped change.
Choose the map by the question instead of using all four as interchangeable pictures
For a general county overview, start with the full land-cover map. It places forest, agriculture, development, water, and wetlands in one frame and makes the large north-to-interior contrast immediately visible. If the goal is to compare rural landscapes, move next to the forest-and-farmland map. It removes much of the urban detail and makes the boundary between large agricultural areas and wooded country easier to discuss.
For settlement form, the impervious map is the more direct choice. The major concentrations and road-like lines stand out without the visual competition of forest and farmland colors. It is particularly useful for explaining why developed cover and hard-surface percentage are different measures. For long-term comparison, use the 1985–2025 map beside the current land-cover map so that current condition and class difference remain separate concepts.
Download the four original Logan County JPG maps
The downloadable ZIP contains the 2025 land-cover map, forest-and-farmland map, impervious/developed-land map, and the 1985–2025 land-cover change map as separate JPG files. According to the supplied asset manifest, each original JPG is 2480×1754 pixels, while the on-page WebP previews are 1800×1273 pixels. The package does not claim that these source JPGs meet an A3 high-resolution reference, so the files are presented at their supplied original size rather than being artificially enlarged.
Land cover is a generalized surface classification, not zoning, ownership, or a parcel survey
Land cover describes what appears to cover the ground: forest, agricultural vegetation, water, wetlands, developed surfaces, and related classes. It does not determine what a property is legally allowed to be used for. A cell mapped as agriculture is not automatically zoned for agricultural use, and a forest cell does not identify the landowner or a protected area. Parcel boundaries, zoning decisions, building permissions, and tax records must come from the appropriate county or municipal source.
Annual NLCD is raster data, which means the landscape is represented by grid cells. Real boundaries can pass through a cell, and more than one surface type may exist inside it. A narrow road crossing a forest, a small building within a pasture, or a thin wetland edge can therefore be simplified. This mixed-pixel effect is one reason the map should be used for county-scale comparison rather than for measuring a fence line, driveway, wetland boundary, or individual lot.
The current maps are labeled 2025, and the historical comparison uses 1985 and 2025. Changes after the mapped observation period may not appear. Water bodies can also look different at another date if water levels vary, and recently cleared or newly developed ground may not yet be represented in a static image. Projects that depend on current site conditions should add recent aerial imagery, official records, or field verification.
Frequently Asked Questions
What is the dominant land cover in Logan County?
Forest is the largest 2025 class at 56.18%. Agriculture is second at 31.89% and is especially prominent across the northern part of the county and in several western areas. The county therefore has a forest majority without being uniformly forested.
Why does the impervious map show more than one strong developed cluster?
Logan County has important settlement areas in more than one part of the county, and the county government maintains courthouse locations in both Paris and Booneville. The impervious map shows two particularly clear clusters plus smaller developed concentrations. It should be used to compare broad built-surface patterns, not to draw exact city limits.
Does the 17.23% class difference mean that much of the county was developed after 1985?
No. The 17.23% figure includes several kinds of mapped class difference. Only 1.42% is specifically labeled as change to developed cover; forest loss, agricultural loss, and other differences are separate categories. The map also warns that classification variation can contribute to the differences.
What files are included in the Logan County download?
The ZIP includes four original JPG files: the 2025 land-cover map, forest-and-farmland map, impervious/developed-land map, and the 1985–2025 land-cover change map. They match the four topics previewed on this page.
Map File Information
The ZIP contains four original JPG maps for Logan County: 2025 land cover, forest and farmland, impervious/developed land, and 1985–2025 land-cover change.
- Included Files: Land cover, forest/farmland, impervious/developed land, and land-cover change maps
- File Type: One ZIP containing four JPG files
Related Maps
- A Craighead County Arkansas Land Cover Map
- Arkansas County Arkansas Land Cover Map
- Ashley County Arkansas Land Cover Map
Sources and References
- MRLC Annual NLCD Data — official access point for the Annual NLCD land-cover data used as the basis for the supplied map set.
- USGS Annual NLCD Land Cover Classification — definitions and background for forest, agriculture, developed land, wetlands, water, and related classes.
- Logan County, Arkansas — official county information, including the Paris and Booneville courthouse locations.
- Arkansas State Parks: Mount Magazine Maps — official location information for Mount Magazine State Park south of Paris.
- U.S. Army Corps of Engineers: Blue Mountain Lake — official information on Blue Mountain Lake, the Petit Jean River setting, and surrounding natural resources.
- USDA 2022 Census of Agriculture: Logan County — county-level farm, cropland, pastureland, and woodland statistics used for local agricultural context.
Green Map creates custom-edited map images using open geographic data sources such as geoBoundaries, Natural Earth, OpenStreetMap, and government open data.
These maps are edited visual materials, not raw data files, and are provided for education, documents, presentations, and graphic reference.