Forest covers 47.38% of Gordon County in the supplied 2025 summary, but the map is far from uniformly wooded. Agriculture occupies another 32.34%, while a strong developed concentration around Calhoun breaks through the middle of the county and extends along a north-south corridor. This Gordon County Georgia Land Cover Map set makes it possible to compare that broad landscape with forest and farmland, impervious surfaces, and mapped class differences between 1985 and 2025.
The four map views shown on the page are also available as original JPG files in one ZIP. Each downloadable image measures 2480 × 1754 pixels, which is useful for enlarging the legend, building a county profile, preparing a class handout, or comparing the same place across two map types. The discussion below starts with the countywide pattern and then moves to the details that each specialized view reveals.
Table of Contents
Nearly half the county is forest, yet farms and development divide the middle
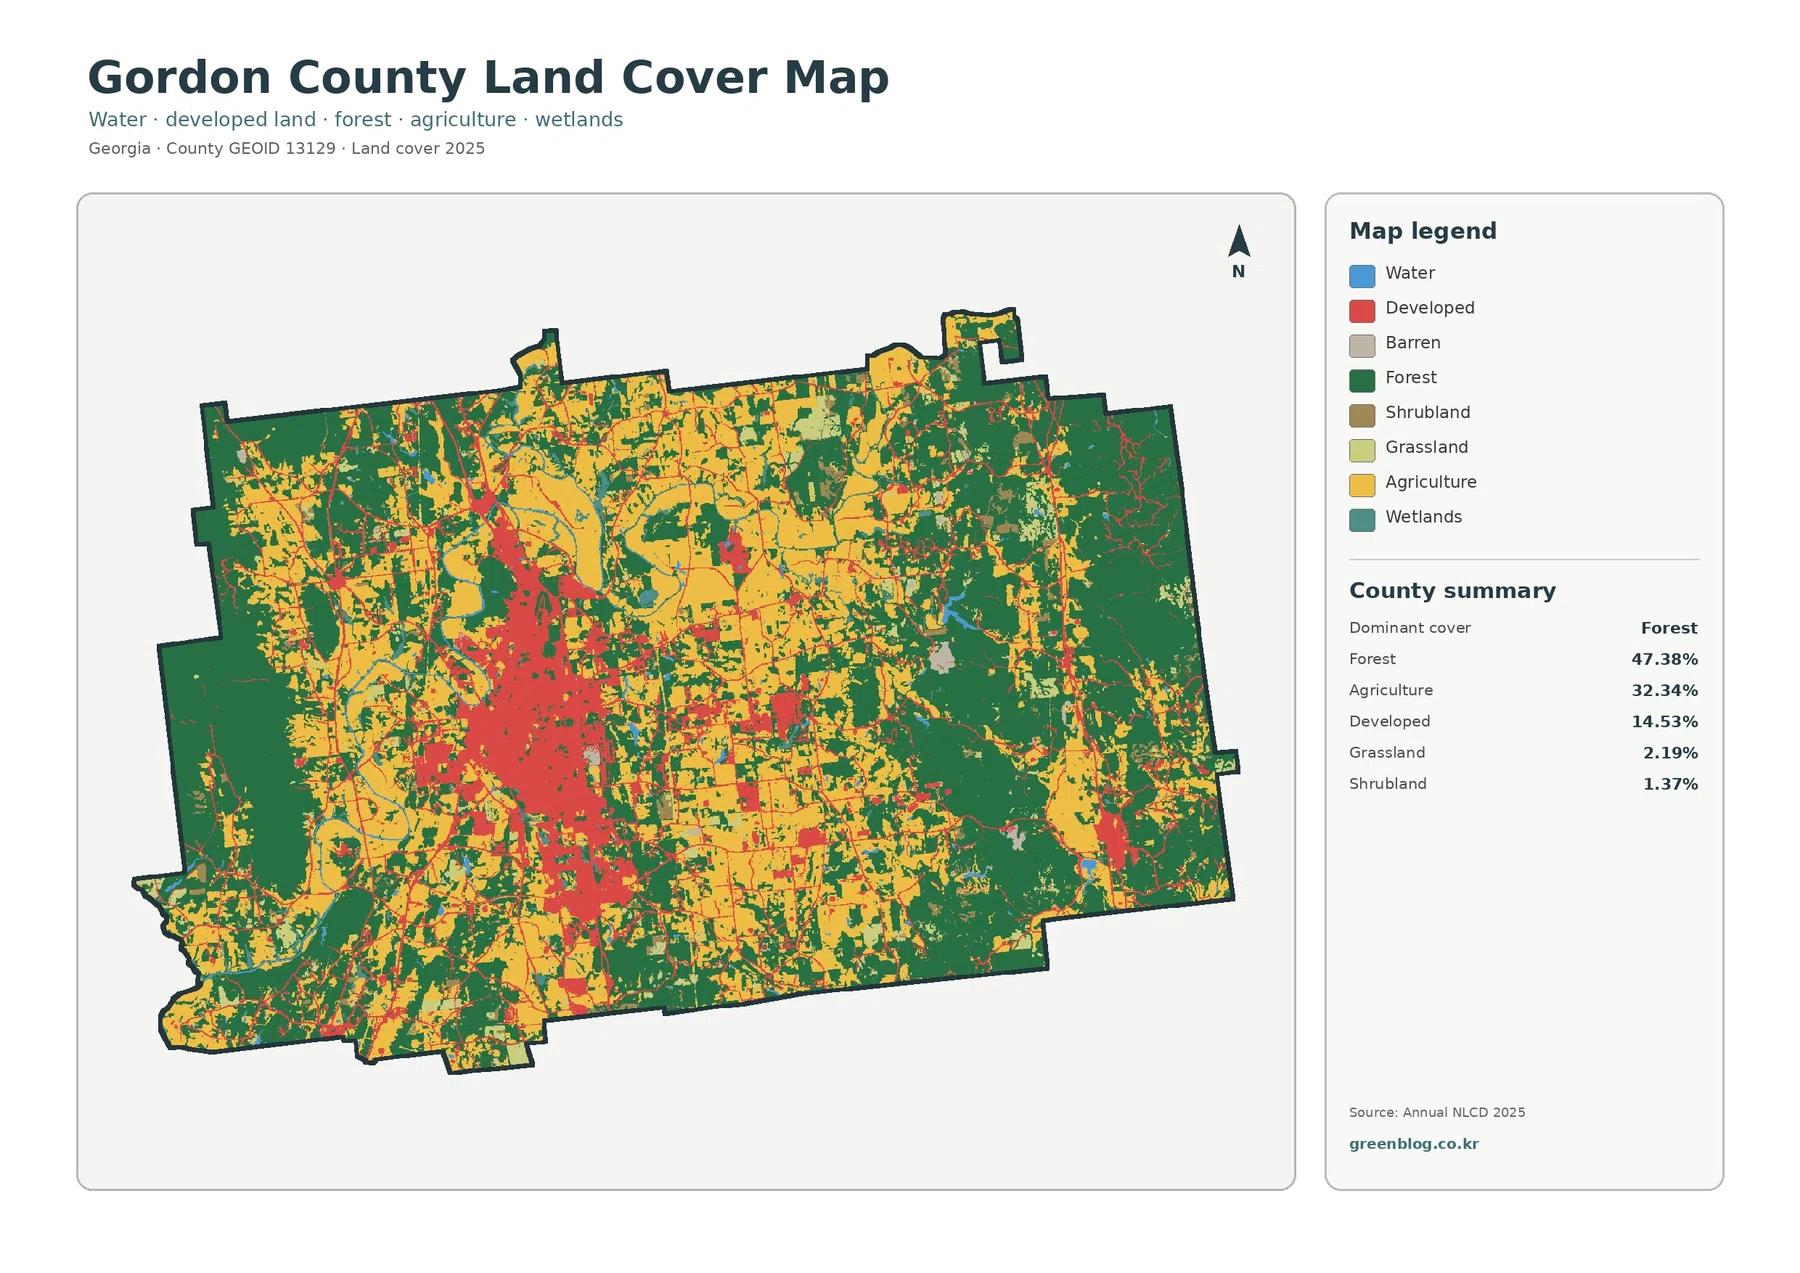
The 2025 county summary is led by forest at 47.38%, followed by agriculture at 32.34% and developed land at 14.53%. Grassland accounts for 2.19% and shrubland for 1.37%. The companion vegetation map also reports 0.87% water and 1.01% wetlands. Those numbers explain why green and yellow dominate the image, but the arrangement matters as much as the totals: forest forms broad blocks around the county while agriculture and development create a more fragmented central landscape.
Large dark-green areas are especially noticeable along the western side and across much of the east and southeast. The western pattern has a useful local reference. Gordon County’s official hazard-mitigation material notes that the Chattahoochee National Forest occupies a large part of the western county. The land-cover image is consistent with a heavily wooded west, but it does not draw federal ownership boundaries, so the green pixels should not be treated as a property map of the national forest.
Agricultural cover is more frequent through the interior, north, and northwest, often appearing as wide blocks surrounded by forest. South of the middle, the yellow pattern becomes more interrupted where the Calhoun-area developed cluster expands. This creates a county with three strong elements rather than one simple landscape type: extensive woodland, a large working-land component, and a concentrated built center.
Land cover describes what the ground surface is classified as from remotely sensed data. It is not a zoning map, ownership map, parcel survey, or statement about whether land may be developed. A red developed cell can include lawns, trees, and other permeable surfaces, while a yellow agricultural cell does not identify a crop, farm operator, or legal field boundary. Those questions require current local records and more detailed mapping.
Removing the built colors exposes a broad farm-and-forest transition zone
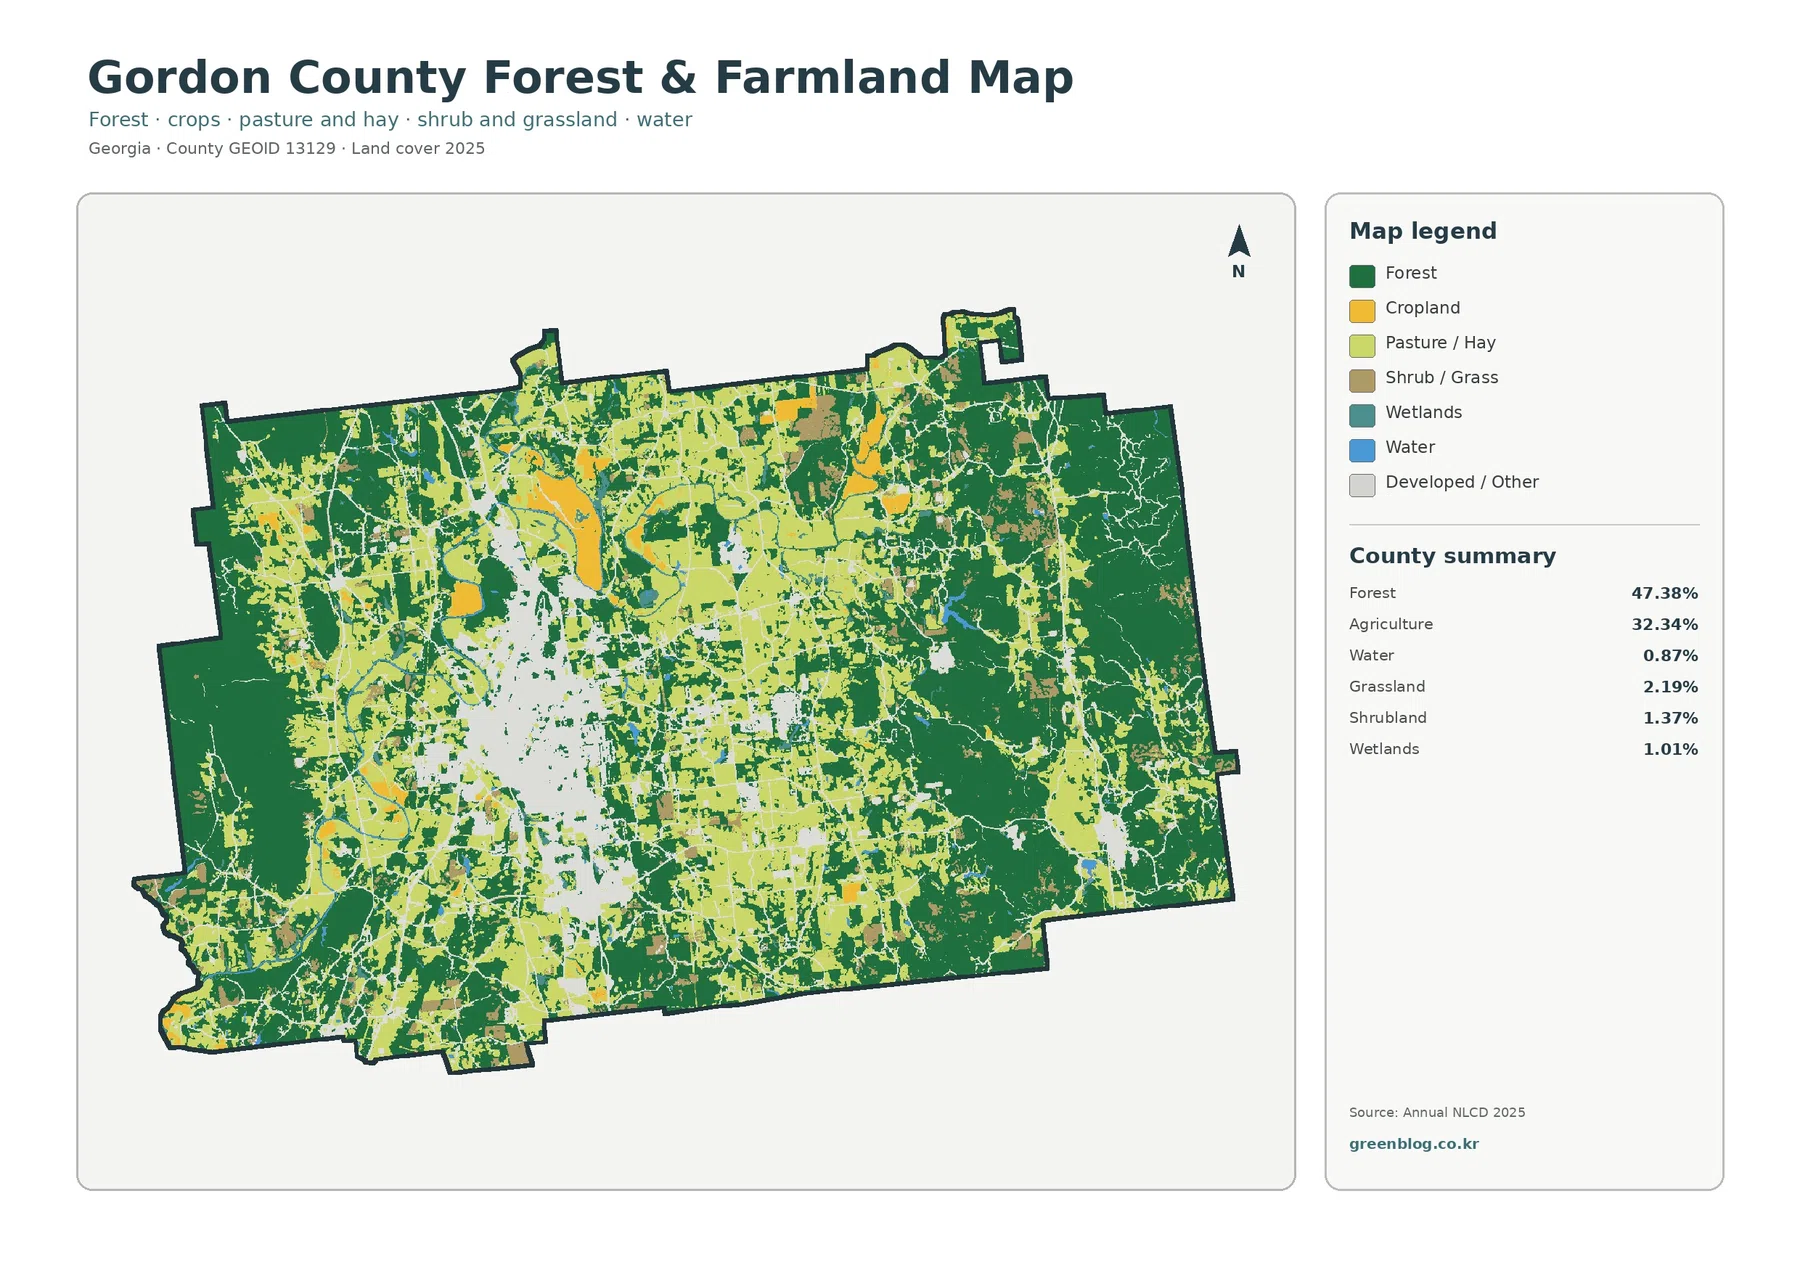
With developed and miscellaneous surfaces faded, the central part of Gordon County becomes much easier to interpret. Forest remains continuous in large western and eastern areas, while agricultural cover occupies many of the openings between them. Around Calhoun, the pale developed gap is wide enough to separate some of the working-land patches, and thinner pale traces continue away from the main cluster.
The county’s official website describes Gordon County as strategically located on I-75 between the Atlanta and Chattanooga regions. That transportation setting helps explain why a north-south developed corridor is useful context for reading the maps. The images themselves do not label I-75, however, so every narrow developed or impervious line should not be assigned to that highway without a road layer. The map supports a broad Calhoun-and-corridor interpretation, not route-by-route identification.
Open water is only 0.87% and wetlands 1.01% in the supplied summary, yet water remains important to the county’s physical setting. Gordon County’s official hazard plan notes that the Coosawattee and Conasauga rivers join to form the Oostanaula River and also identifies the lake at Salacoa Creek Park. Those names provide geographic context, but the land-cover preview does not label individual rivers or lake boundaries. A hydrography map is needed before assigning a particular blue or teal strip to a named feature.
Calhoun stands out much more clearly when only hard surfaces are emphasized
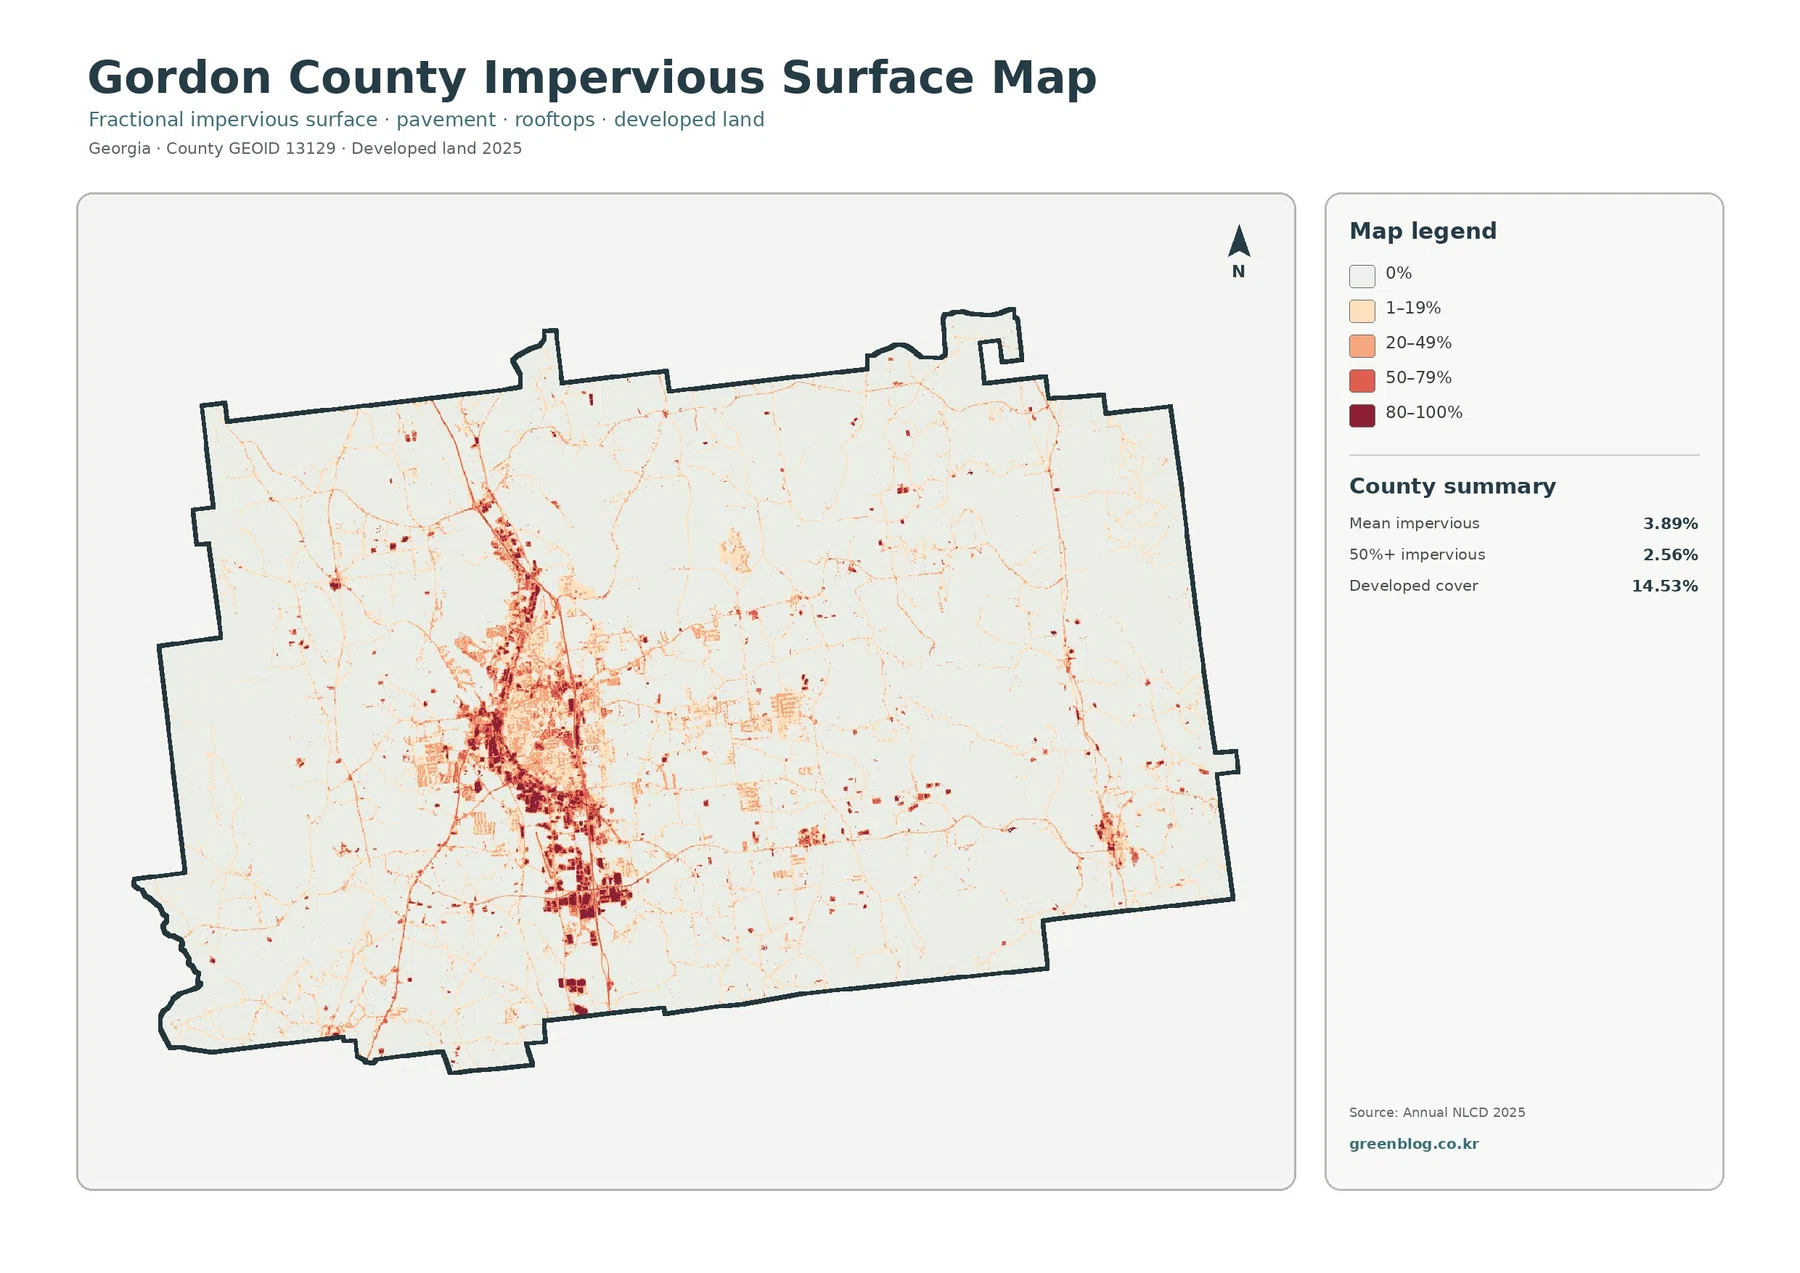
Mean impervious cover is 3.89%, and 2.56% of the county is mapped at 50% impervious or greater. Both figures are well below the 14.53% developed-land share because the measurements answer different questions. Developed classes can contain lawns, trees, bare ground, and other surfaces that still absorb water. The impervious layer isolates the harder parts of the built landscape, such as roofs, streets, and parking areas.
The darkest tones form a dense cluster near the center and continue southward, matching the general location of Calhoun’s built area. Smaller linear traces continue north and south, while scattered hard-surface marks appear farther east and around the outer county. The contrast is strong: much of the forested and agricultural countryside is nearly blank in this view, so the local concentration of pavement and rooftops becomes more visible than it is on the general map.
The 33.54% endpoint difference needs careful reading before it is called “change”
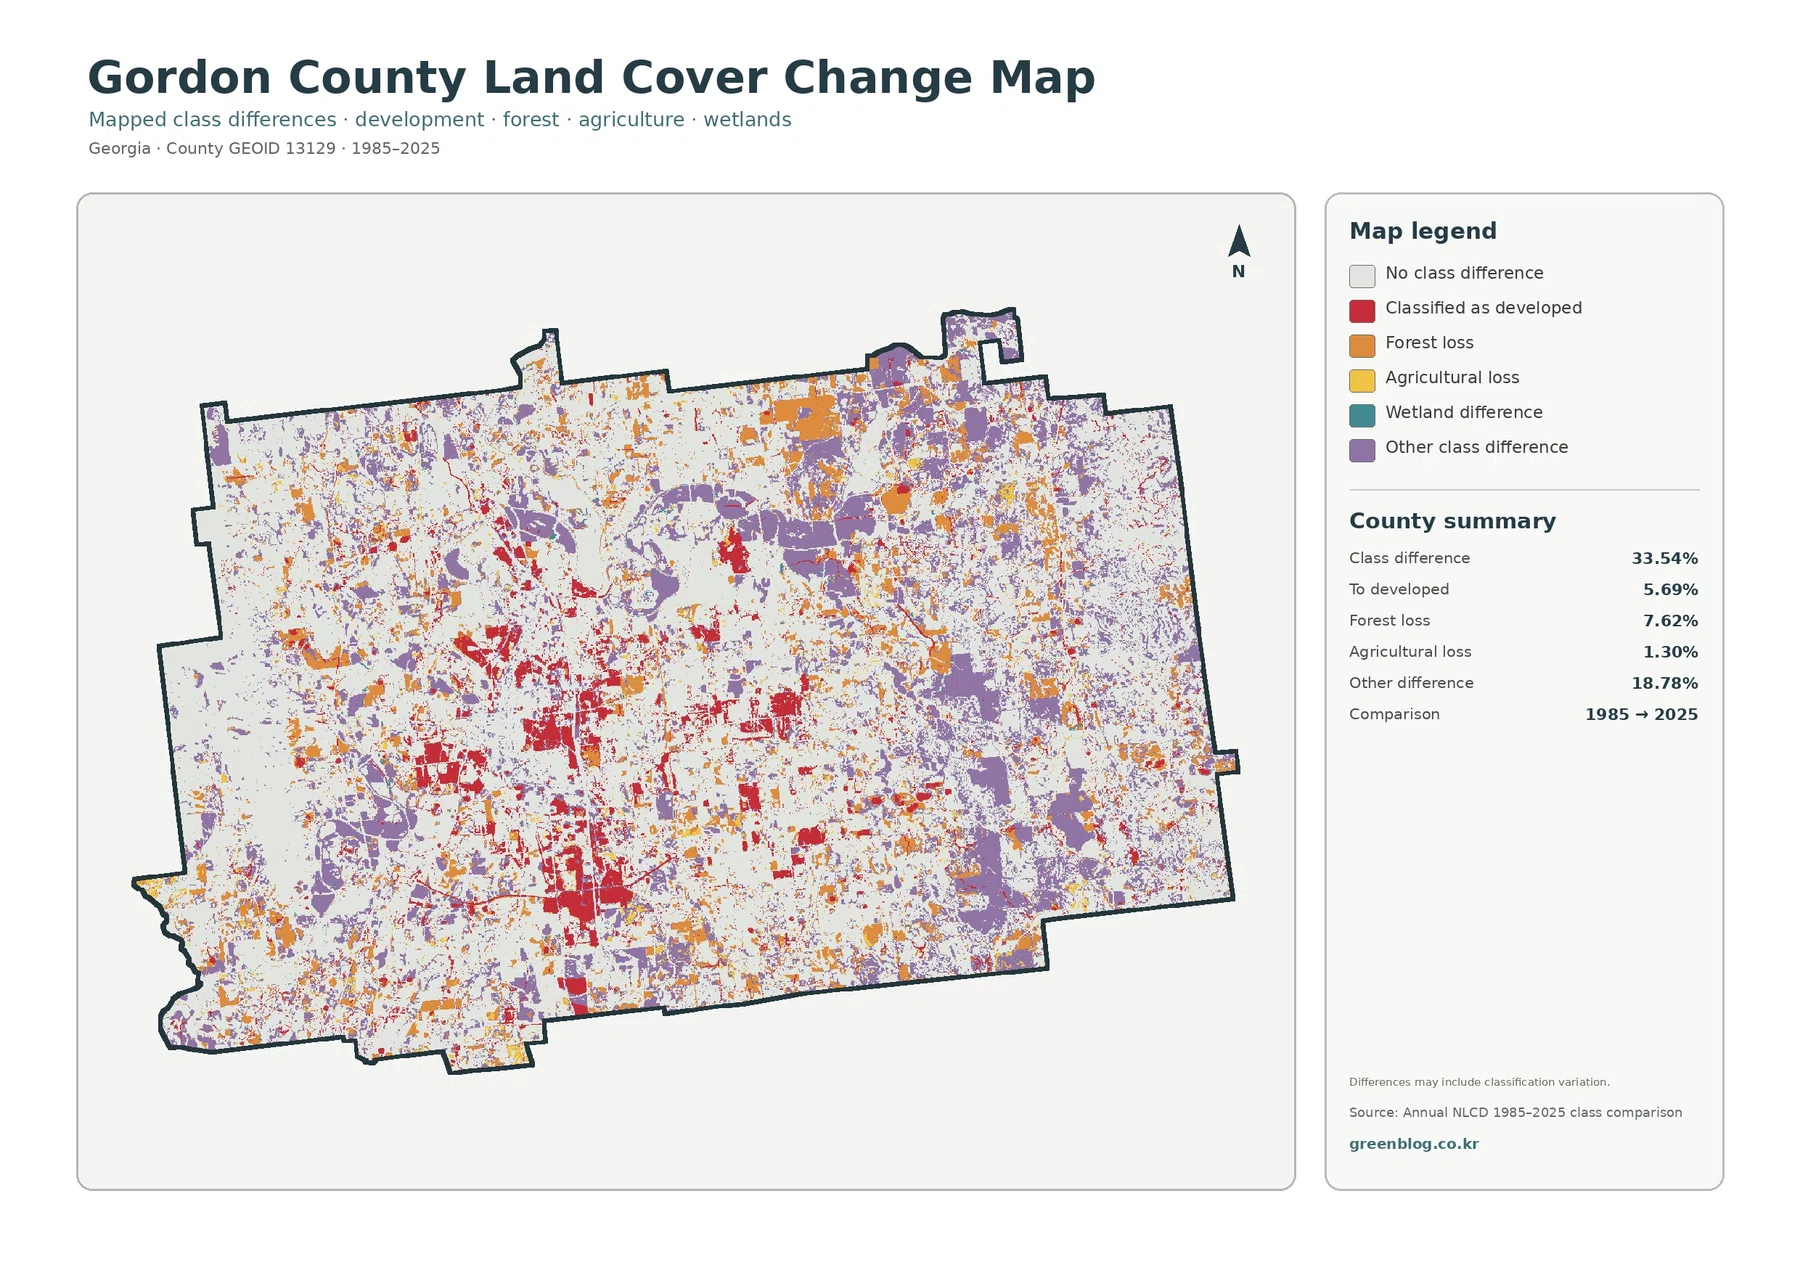
The comparison reports a 33.54% total class difference between the 1985 and 2025 endpoints. The listed components include 5.69% classified as developed, 7.62% forest loss, 1.30% agricultural loss, and 18.78% other difference. Wetland difference appears in the legend but does not have its own percentage in the summary, so it would be incorrect to invent a value by visual estimation or by treating a residual as an official statistic.
Red developed-conversion cells are most obvious in and around the Calhoun-centered corridor, with additional patches extending north through the middle of the county. Orange forest-loss cells are more dispersed across the east, north, and west. Purple other-difference areas are widespread and include several larger patches in the northern and eastern parts of the county. The comparison therefore shows a broad mix of endpoint differences rather than a single wave of development spreading uniformly outward.
“Forest loss” in this graphic means a cell classified as forest in 1985 received a different class in 2025. It does not identify logging, construction, farming, storm damage, vegetation succession, or classification variation as the cause. The map itself warns that differences may include classification variation. Establishing when and why a location changed requires intermediate-year imagery, local records, permits, or field evidence.
Thirty-meter cells simplify field edges, narrow roads, and mixed rural properties
Annual NLCD uses roughly 30-meter raster cells. Each cell receives one predominant class even when trees, crops, grass, a driveway, a drainage ditch, and a building share the same space on the ground. This is why straight agricultural edges can resemble parcel lines and why narrow forest strips or small roads may look broken, wider, or narrower than they actually are.
Pick the first map by the question, then add one comparison view
For a general county profile, start with the 2025 land-cover image. It immediately shows the dominance of forest, the large agricultural share, and the way the Calhoun-area built cluster interrupts the central landscape. If the topic is working land and natural cover, the forest-and-farmland view removes much of the built-color distraction and makes the transitions between woods, cropland, pasture, and open land easier to describe.
Files included in the Gordon County JPG download
Frequently Asked Questions
Is Gordon County mainly forest or mainly agricultural land?
Forest is the largest 2025 class at 47.38%, while agriculture accounts for 32.34%. It is reasonable to describe the county as forest-led, but agriculture is too extensive to treat as a minor secondary cover. The maps show large wooded blocks on the west and east, broad working-land areas through the interior, and a separate developed concentration around Calhoun.
Why is developed cover 14.53% when mean impervious cover is only 3.89%?
Developed classes can include grass, trees, open soil, and other permeable surfaces around homes, businesses, roads, and industrial sites. Impervious cover isolates harder surfaces such as rooftops, pavement, and parking areas. Because those measures describe different parts of the built landscape, the countywide impervious average is much lower than the developed-land share.
Does the 33.54% class difference mean one-third of Gordon County was physically damaged?
No. It is the share of cells with different classifications at the 1985 and 2025 endpoints. The total includes developed conversion, forest loss, agricultural loss, other differences, and possible classification variation. A cause or date cannot be assigned from this map alone; intermediate imagery, local records, permits, and field evidence are needed for a specific site.
Sources and Reference Data
- MRLC Annual NLCD Data – official access point for the 2025 land-cover and annual comparison products
- USGS Annual NLCD Land Cover Classification – class definitions and guidance for forest, agriculture, developed land, wetlands, and related categories
- U.S. Census Bureau TIGER/Line Shapefiles – official county-boundary reference for Gordon County
- Gordon County – About Us – official county background describing the I-75 location and regional setting
- Georgia DCA – Gordon County Comprehensive Plan – county and city planning material for Calhoun, Fairmount, Ranger, Resaca, and Plainville
- UGA Cooperative Extension – Gordon County Agriculture & Natural Resources – local agriculture and natural-resources education and reference information
Map File Information
The ZIP contains four original JPG maps for comparing Gordon County’s forest and agricultural cover, Calhoun-area development and impervious surfaces, and 1985–2025 class differences.
- Included Files: Four JPG maps shown on this page
- File Type: JPG files bundled in a ZIP archive
- Intended Use: Printing, education, presentations, and map-based projects
Related Maps
- Appling County Georgia Land Cover Map
- Atkinson County Georgia Land Cover Map
- Bacon County Georgia Land Cover Map
Green Map creates custom-edited map images using open geographic data sources such as geoBoundaries, Natural Earth, OpenStreetMap, and government open data. These maps are edited visual materials, not raw data files, and are provided for education, documents, presentations, and graphic reference.