Franklin County has a clear split between the farmed floor of Cache Valley and the forested mountains to the east, with broad shrubland covering much of the ground between them. The 2025 summary lists shrubland at 44.92%, forest at 24.17%, and agriculture at 22.98%, so the county is not dominated by a single land-cover type.
This page compares the general land cover map, forest and farmland, impervious and developed surfaces, and the 1985-to-2025 class-difference map. The four original JPG maps are available together in one ZIP after the map explanations for printing, teaching, presentations, and county comparisons.
Table of Contents
A farmed valley floor meets forested mountain country across Franklin County
The first thing to notice is where the large land-cover blocks sit. Agriculture fills much of the west and south in broad, often rectangular fields. Forest becomes much more extensive toward the east and southeast, while shrubland covers large central and northern areas between the two. This arrangement makes Franklin County look very different from a county where farmland, forest, or open rangeland is spread evenly from one boundary to another.
Franklin County’s 2025 Comprehensive Plan places the county in the northern end of Cache Valley. It describes the Bear River Range along the east and the Wellsville and Malad ranges to the west, with high mountain terrain rising above a lower valley floor. That geography provides useful context for the map: extensive cropland lies on the valley floor, while forest is strongest on the mountain side of the county.
The same county plan describes Cache Valley as the county’s largest agricultural area, supporting both irrigated and dry-farm production along with dairy and beef operations. It names alfalfa, wheat, and barley among the important feed crops. Those facts help explain the importance of the yellow farm blocks on the map, but the land-cover product does not identify which crop grows in any individual field.
Shrubland leads at 44.92%, but forest and agriculture each cover about one quarter
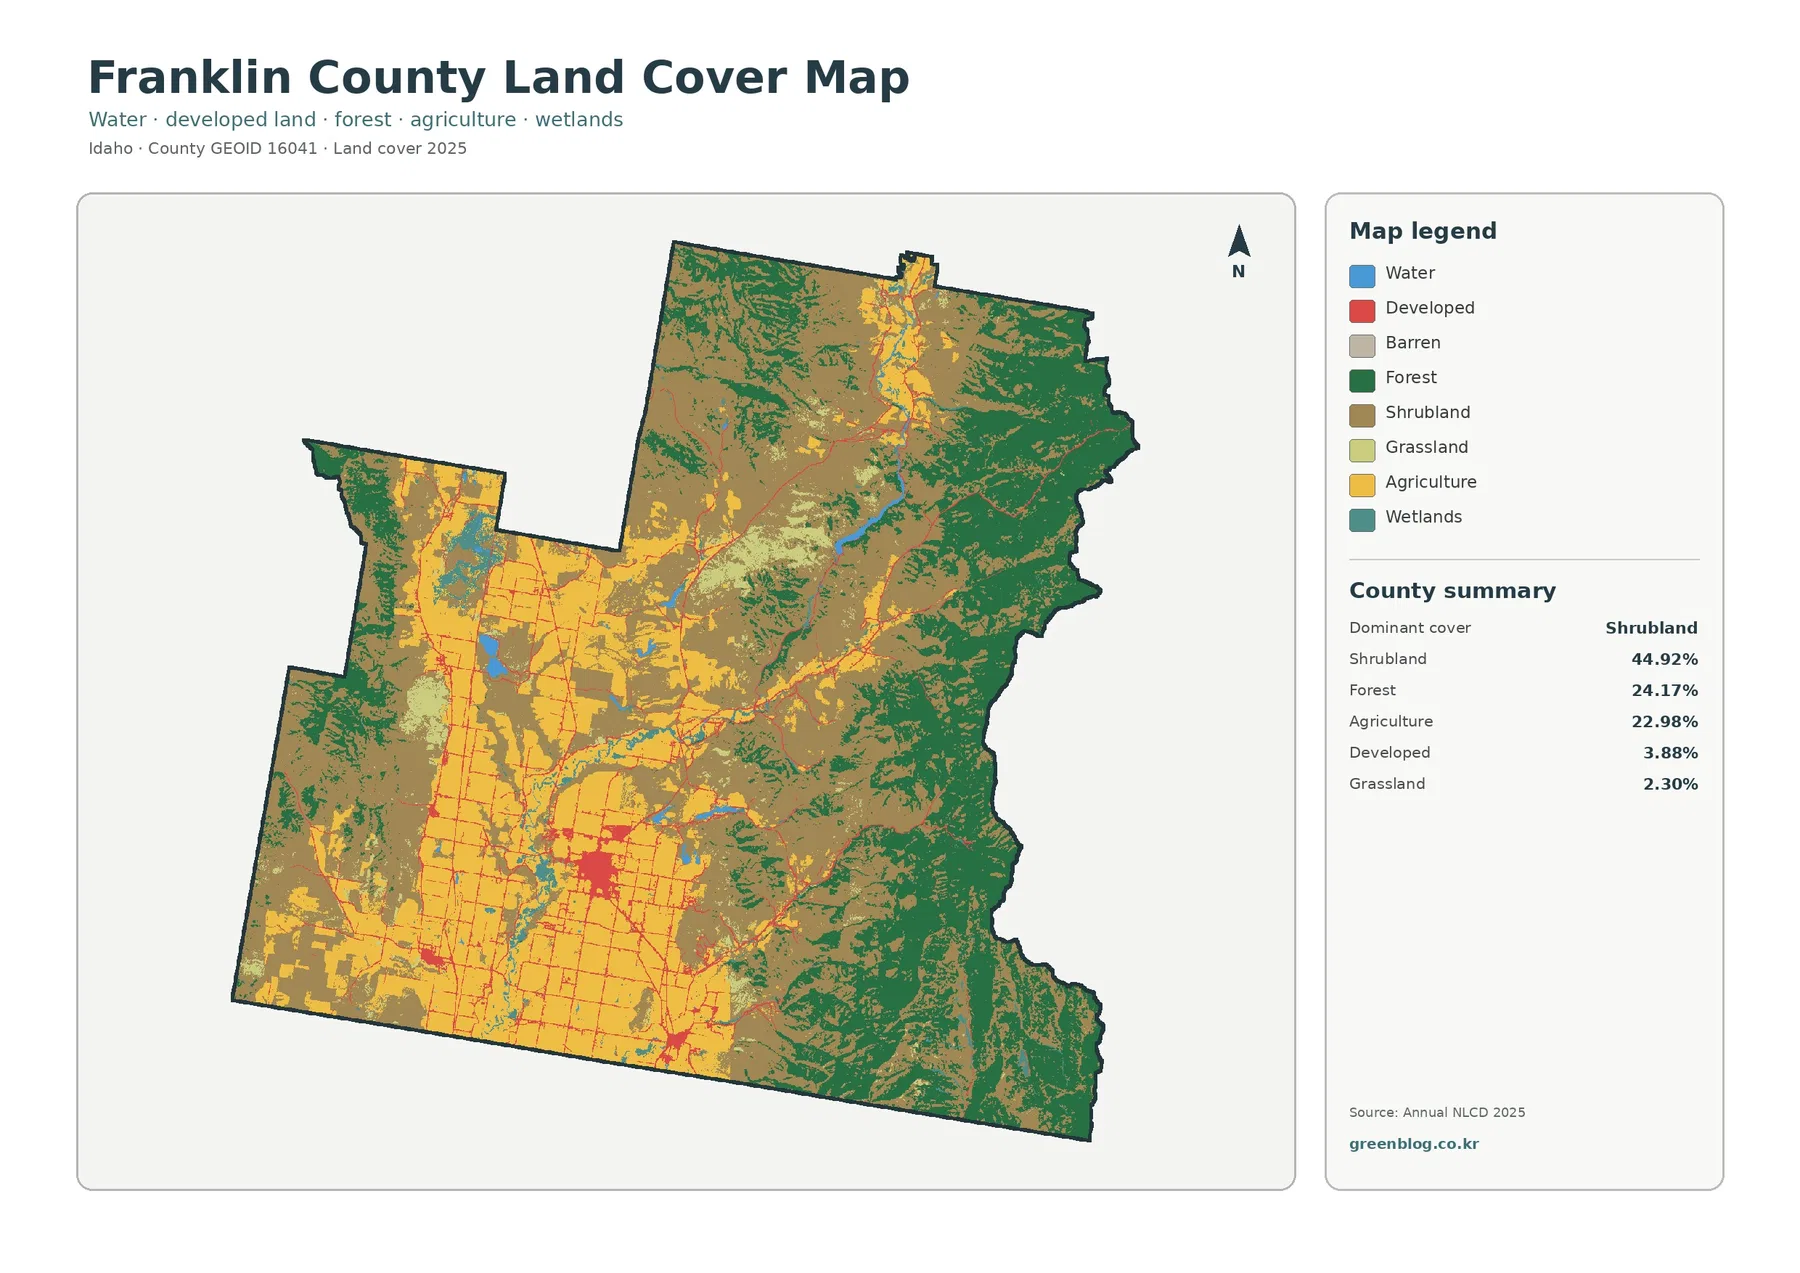
Shrubland is the largest class at 44.92%. Brown areas fill much of the center and north and extend around the edges of both farmland and forest. On the map, shrubland is important not only because it has the highest percentage but because it occupies the broad middle ground between the heavily farmed valley floor and the greener mountain slopes.
Forest accounts for 24.17% and is strongly concentrated rather than evenly distributed. The east side contains large, continuous green blocks, with additional forest along the southeast boundary and smaller patches around western uplands. Because the eastern forest is so concentrated, it appears visually dominant in that part of the county even though its countywide share is only about one quarter.
Agriculture is close behind at 22.98%. Yellow agricultural cover spreads across the southwest, south-central area, and much of the western valley, forming a grid of fields and roads. Farther north, agricultural areas narrow and become more fragmented. The contrast between regular farm blocks in the valley and irregular forest edges in the mountains is one of the easiest patterns to recognize.
Developed land represents 3.88% and grassland 2.30%. Water is 0.49% and wetlands 1.27%. Those small blue and teal classes are easy to overlook when the map is reduced on screen, yet they create useful reference lines through the farmed valley and around a few broader water bodies. Idaho’s Department of Water Resources includes Franklin County in the Bear River drainage, which provides an appropriate watershed context for those mapped water features.
The forest-and-farmland view makes the Cache Valley farm pattern much easier to follow
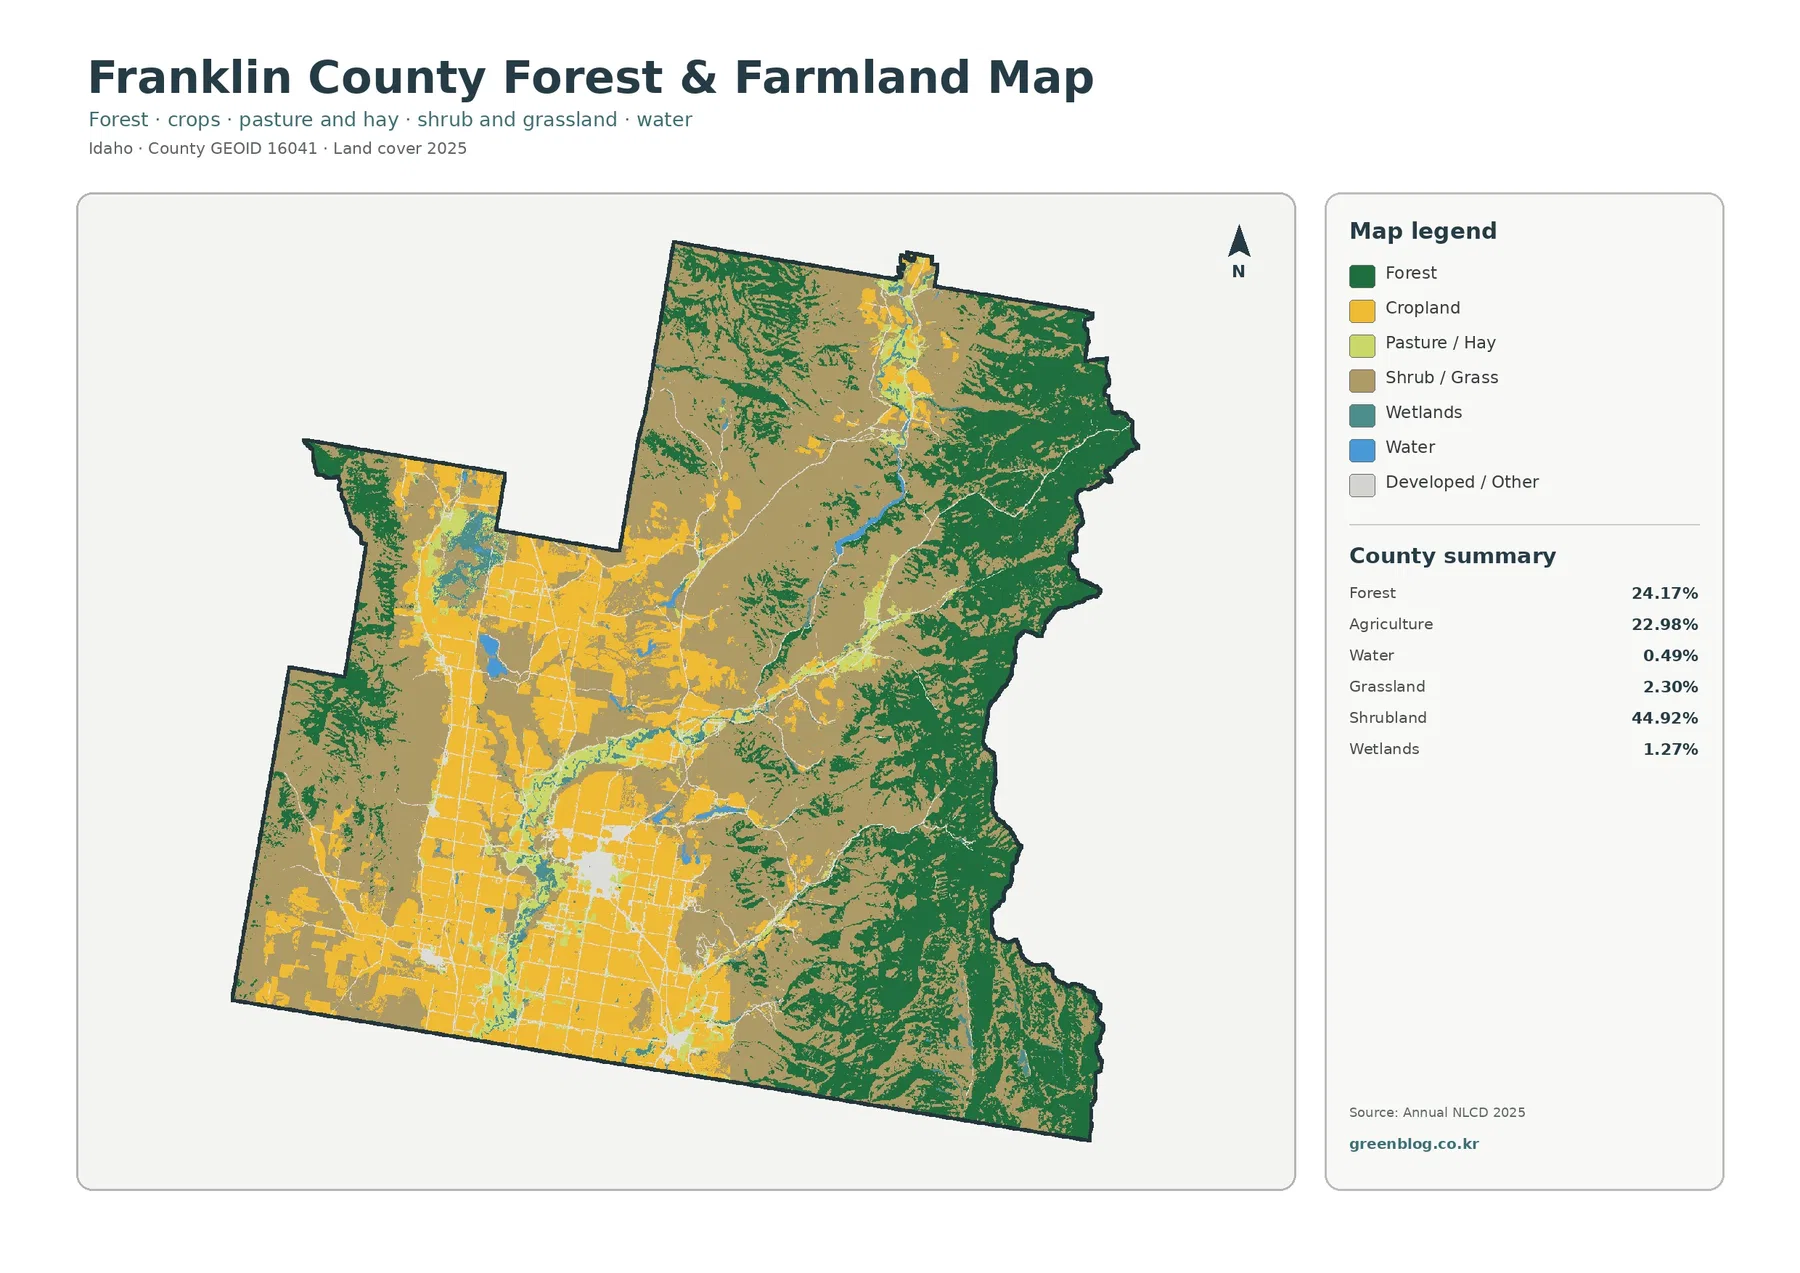
On this map, cropland forms the large yellow blocks across the west and south. The field pattern is especially clear in the southern half, where agricultural parcels create broad connected areas instead of isolated pockets. Moving north, the yellow areas become narrower and are increasingly interrupted by shrub and grass cover, forest, and drainage corridors.
Pasture and hay are shown separately from cropland. Light-green patches occur around parts of the valley floor, along water corridors, and near settled agricultural areas. This separation matters in Franklin County because the comprehensive plan emphasizes livestock and feed production as well as crop farming. A field mapped as pasture or hay should not be counted as cropland simply because both are part of the agricultural economy.
The eastern side provides the opposite pattern. Forest fills the mountain blocks, while cropland becomes uncommon except where narrower valleys or openings reach into the uplands. The Bear River Range described in the county plan lies on this side of the county, which is consistent with the strong concentration of mapped forest. The color does not, however, establish public ownership or a National Forest boundary.
Central shrub and grass areas keep the map from becoming a simple two-part picture of farms versus forest. These open classes occupy wide areas between the major agricultural floor and the mountain woods. When comparing Franklin County with another county, that 44.92% shrubland share is essential because it explains why neither the farm system nor the forest system reaches a majority of the total area.
The built footprint is small overall but clearly concentrated around Preston
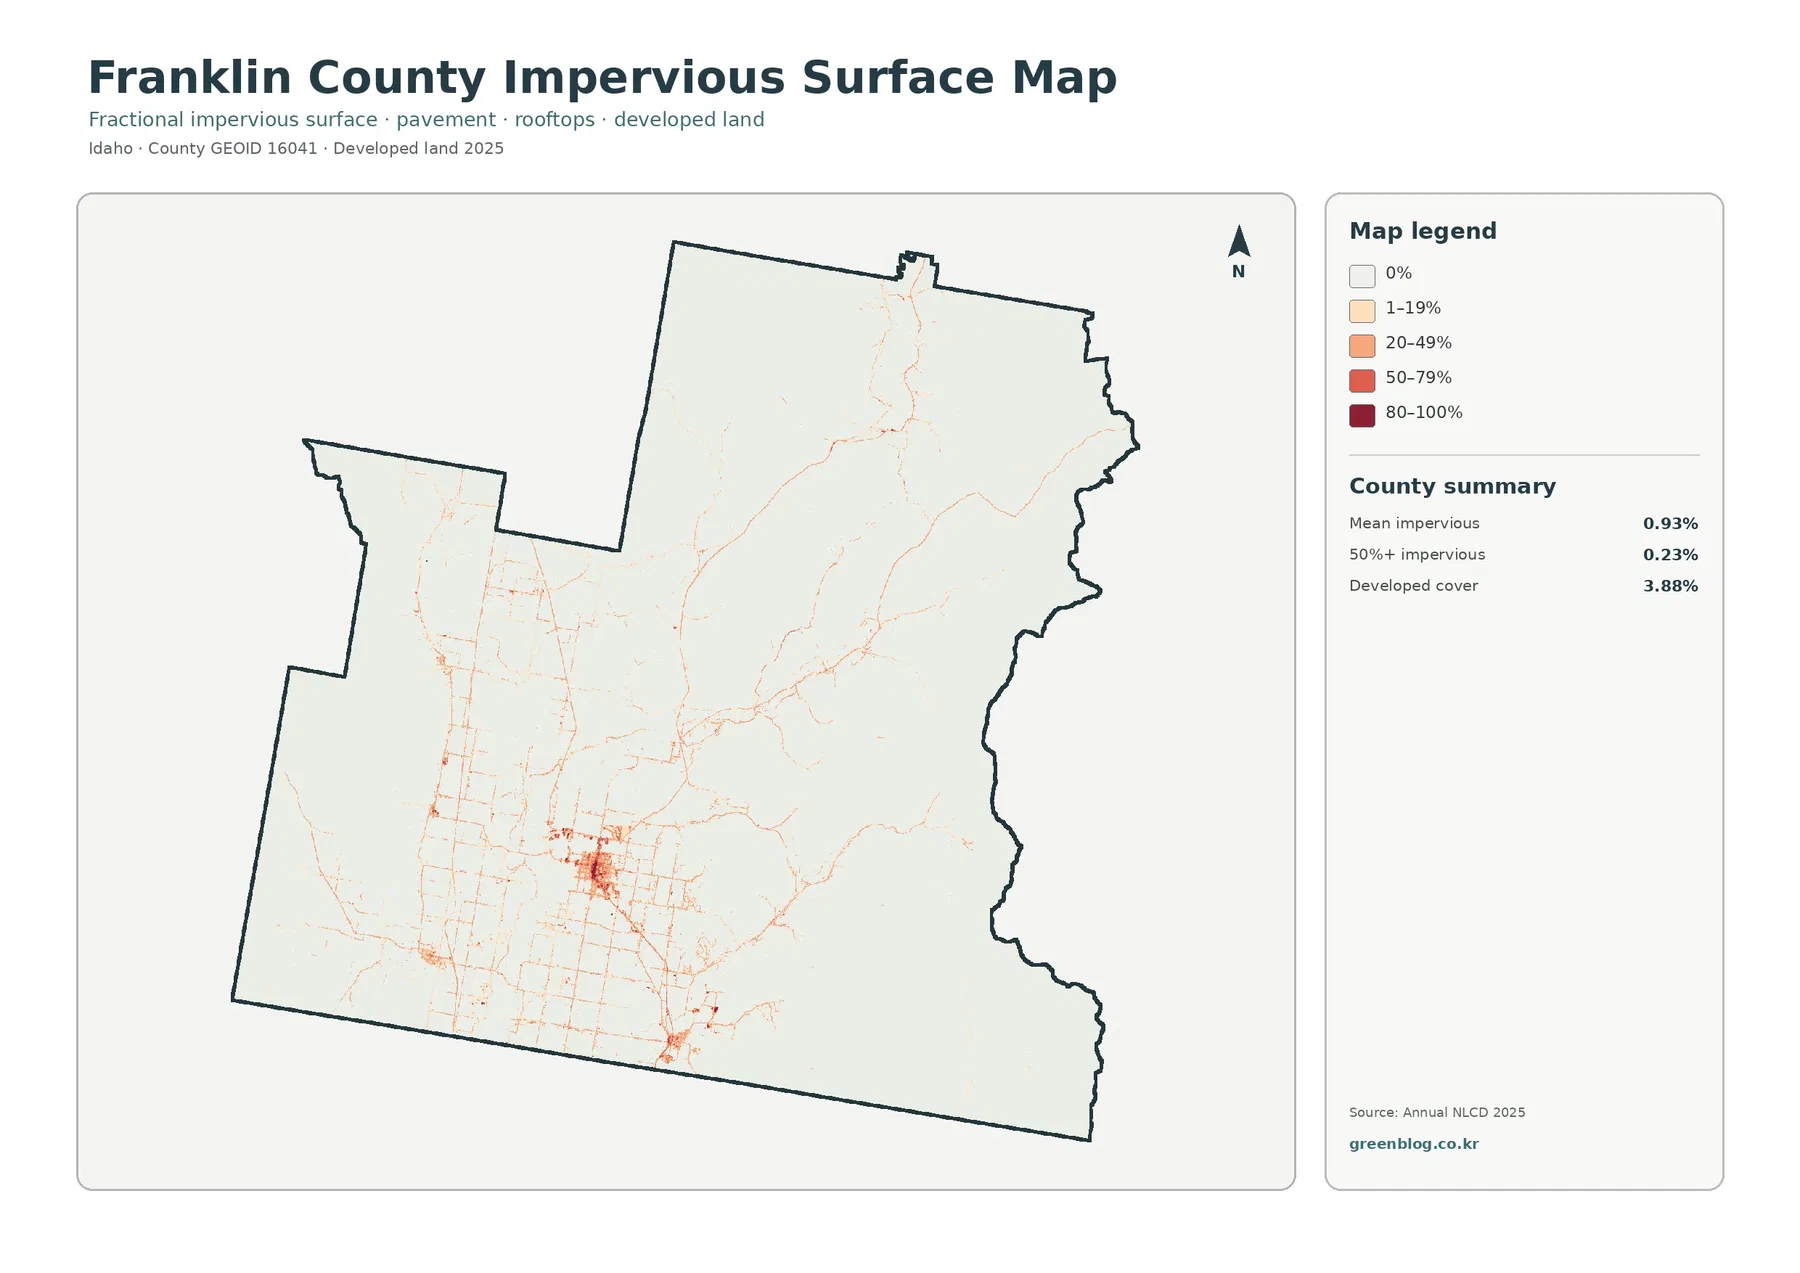
Impervious surface means pavement, rooftops, parking areas, and similar surfaces that do not readily absorb water. Franklin County’s mean impervious value is 0.93%, and cells with 50% or more impervious cover make up 0.23% of the county. Developed land cover is 3.88%, so the mapped built footprint remains much smaller than agriculture, forest, or shrubland.
The strongest cluster sits in the south-central valley around Preston, which the county identifies as its county seat. A dense street grid and compact higher-impervious core stand out against the surrounding farmland. Smaller developed nodes appear near the southern border and in western valley communities, but they are separated by large areas of agricultural or open land rather than forming one continuous urban area.
Outside the main settlements, roads appear as fine light-orange lines. They are most numerous across the farmed valley, where the grid is easy to trace. In the mountain country to the east, the network becomes thinner and more widely spaced. This is one reason the impervious map can be more useful than the general land-cover map when the question is about settlement concentration or road-connected development.
The 3.88% developed figure and the 0.93% mean impervious figure measure different things. A cell classified as developed may still contain grass, soil, trees, or other permeable surfaces. Treating every developed cell as pavement or concrete would overstate the amount of hard surface in the county.
The 1985–2025 comparison reports a 20.04% class difference, not a single conversion rate
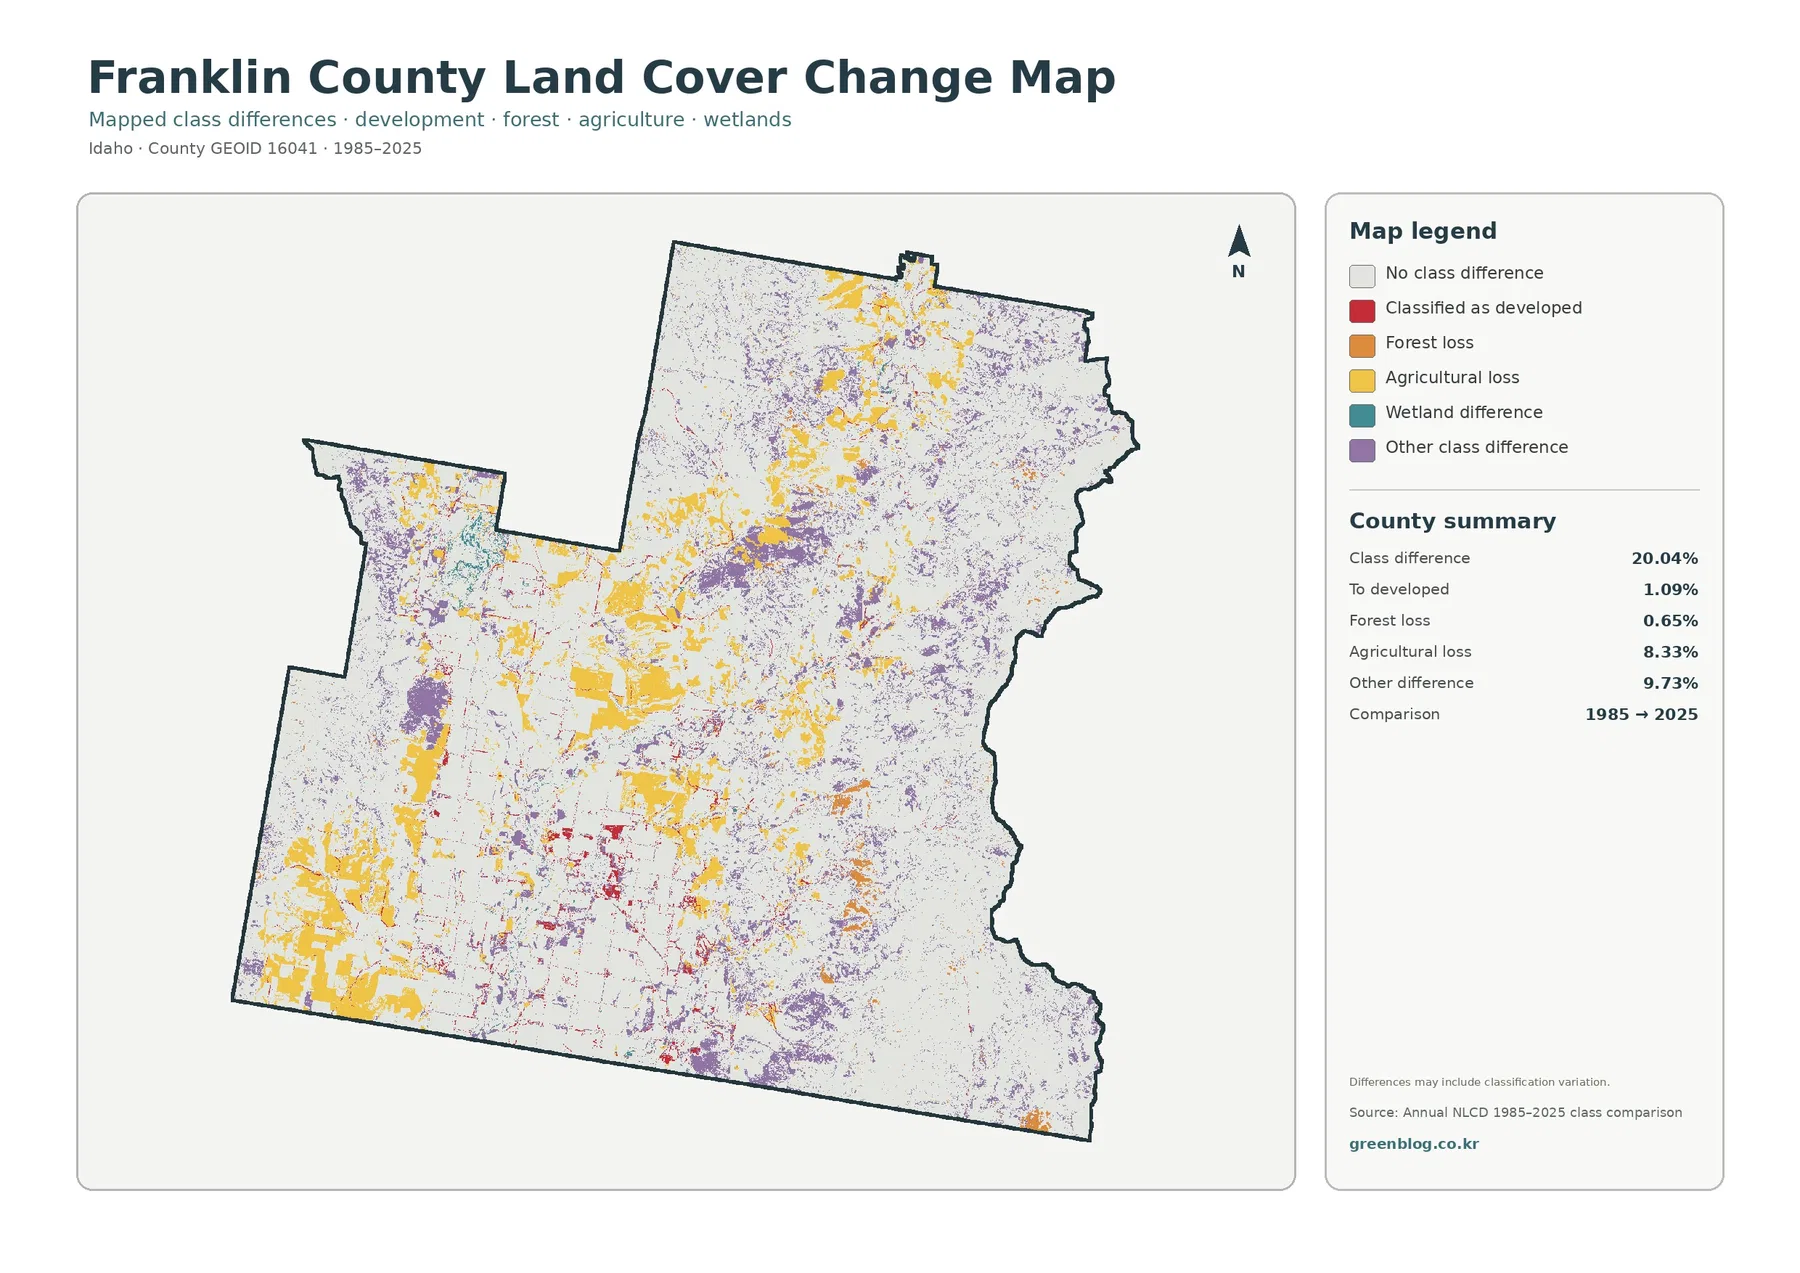
The change map compares broad classifications from 1985 and 2025. The total class difference is 20.04%. Yellow agricultural-loss cells and purple other-class differences are the most widespread colored categories, while red cells classified to developed are more concentrated around the settled valley and along parts of the road network.
The summary gives 1.09% as classified to developed, 0.65% in the forest-loss category, 8.33% agricultural loss, and 9.73% other class difference. Wetland difference is also shown in the legend, but the summary panel does not provide a separate percentage for it, so no additional number should be invented.
The 8.33% agricultural-loss category should not be described as proof that 8.33% of Franklin County’s farmland permanently disappeared. The map itself warns that class differences can include classification variation. A cell may reflect a real land-cover change, but differences in observation conditions, mixed pixels, or classification methods can also affect the comparison.
Large yellow patches occur across parts of the western and southwestern farm country, while purple differences are scattered more widely through open and mountainous terrain. These areas are useful targets for follow-up research. To determine timing, cause, or permanence, the intermediate Annual NLCD years and relevant local agricultural, development, or natural-resource records should be checked.
Small water and wetland shares still help explain the valley pattern
Water covers 0.49% and wetlands 1.27%, so neither class occupies a large share of Franklin County. Yet the blue and teal features provide useful landmarks through the farmed valley. Some water appears as broader reservoir or pond shapes, while streams and wetland corridors create thinner lines that cross agricultural and open land.
Idaho Department of Water Resources lists Franklin County within the Bear River drainage. That watershed context is important in a county where the official comprehensive plan also describes irrigated agriculture and livestock production. The land-cover map does not show water rights or irrigation infrastructure, but it can help readers see where mapped water, wetland, cropland, pasture, and developed areas occur near one another.
Because water and wetlands are small percentages, zoom level can change how important they look. At a reduced size, narrow streams may nearly disappear. When enlarged, a bright blue reservoir or teal wetland patch may appear visually larger than its countywide share suggests. Reading the percentages together with the map keeps both scale and location in perspective.
Each map answers a different Franklin County question
Use the general land-cover map when the goal is to explain the county’s overall landscape. It places shrubland, forest, agriculture, developed land, grassland, wetlands, and water in one frame and makes the Cache Valley versus mountain-country contrast immediately visible. It is also the most straightforward choice for a same-year comparison with another county.
Choose the forest-and-farmland map when agriculture is the main topic. Cropland and pasture or hay are separated, so the farmed floor of Cache Valley can be discussed in more detail without the visual competition of every developed subclass. This view is also useful for comparing how forest and open shrub or grass cover meet the edge of the agricultural area.
The impervious map is best for Preston, roads, and other built concentrations. The change map serves a different purpose: it highlights cells whose broad class differs between 1985 and 2025. Because that comparison can include classification variation, it is better used as a screening map for further investigation than as a final measurement of cause or permanent conversion.
A 30-meter land-cover grid is not a parcel survey, zoning map, or ownership record
Annual NLCD is a raster product, meaning the surface is divided into grid cells and each cell receives a representative land-cover class. The land-cover product uses 30-meter resolution. A cell can contain a field edge, road, trees, a house, and bare soil at the same time, even though the final map displays one class for that location.
For that reason, the edge between yellow agriculture and green forest is not a surveyed property line. A forest-colored area does not establish public ownership, and agricultural cover does not prove that a parcel is legally zoned for farming. Franklin County’s planning, zoning, and GIS property resources are more appropriate for legal land-use and parcel questions.
The same caution applies to the change map. Two endpoints can show different classes without revealing everything that happened in the years between them. A surface may have changed more than once, recovered from disturbance, or been classified differently as the data system improved. Intermediate annual data are needed for a more complete time sequence.
Use matching years and matching map types when comparing Franklin County
For printing, the general land-cover map works well as the first page because the legend and county summary explain the three dominant classes immediately. Franklin County is especially suitable for a simple visual comparison: agriculture and forest have similar countywide shares but occupy very different parts of the map, while shrubland is the largest class overall.
For a county-to-county comparison, keep the year and map type consistent. Comparing Franklin County’s 2025 general map with another county’s 2025 general map makes differences in shrubland, agriculture, forest, and development meaningful. Comparing a single-year map on one side with a 1985-to-2025 difference map on the other would mix two different measurements.
In a classroom or presentation, Franklin County can also illustrate the difference between physical land cover and legal land use. The maps show what covers the ground—such as crops, pasture, forest, shrubland, water, and developed surfaces. They do not show ownership, building rights, zoning permissions, or irrigation entitlements, which must be checked in separate authoritative records.
Frequently Asked Questions
What is the largest land-cover class in Franklin County?
Shrubland is the largest class in the supplied 2025 summary at 44.92%. Forest follows at 24.17% and agriculture at 22.98%, with developed land at 3.88% and grassland at 2.30%. Shrubland is most extensive through central and northern open country between the farmed valley and mountain forests.
Why does agriculture look so extensive if it covers 22.98% of the county?
Agricultural cover is concentrated in large connected blocks across the west and south rather than scattered evenly. The bright field pattern on the Cache Valley floor is therefore visually prominent. Forest has a similar countywide share at 24.17%, but it is concentrated mostly in the east, making location as important as percentage when reading the map.
Does the 8.33% agricultural-loss category equal permanent farmland loss?
No. It identifies cells placed in the agricultural-loss comparison category between 1985 and 2025. The map warns that classification variation may be included, so a permanent farmland-loss estimate would require intermediate annual land-cover data and relevant local agricultural or development records.
Map File Information
The four original JPG maps for Franklin County are provided together in one ZIP file.
- Intended Use: printing, county comparisons, classroom work, presentations, and reference
Related Maps
Sources and references
- MRLC Annual NLCD Data – annual land cover and impervious products used for the map set
- USGS Annual NLCD Land Cover Classification – 30-meter class definitions and interpretation
- Franklin County Comprehensive Plan 2025 – Cache Valley, mountain geography, and agricultural context
- University of Idaho Extension in Franklin County – local agriculture and horticulture programs
- Idaho Department of Water Resources – Water Districts – Bear River drainage context for Franklin County
Green Map creates custom-edited map images using open geographic data sources such as geoBoundaries, Natural Earth, OpenStreetMap, and government open data. These maps are edited visual materials, not raw data files, and are provided for education, documents, presentations, and graphic reference.