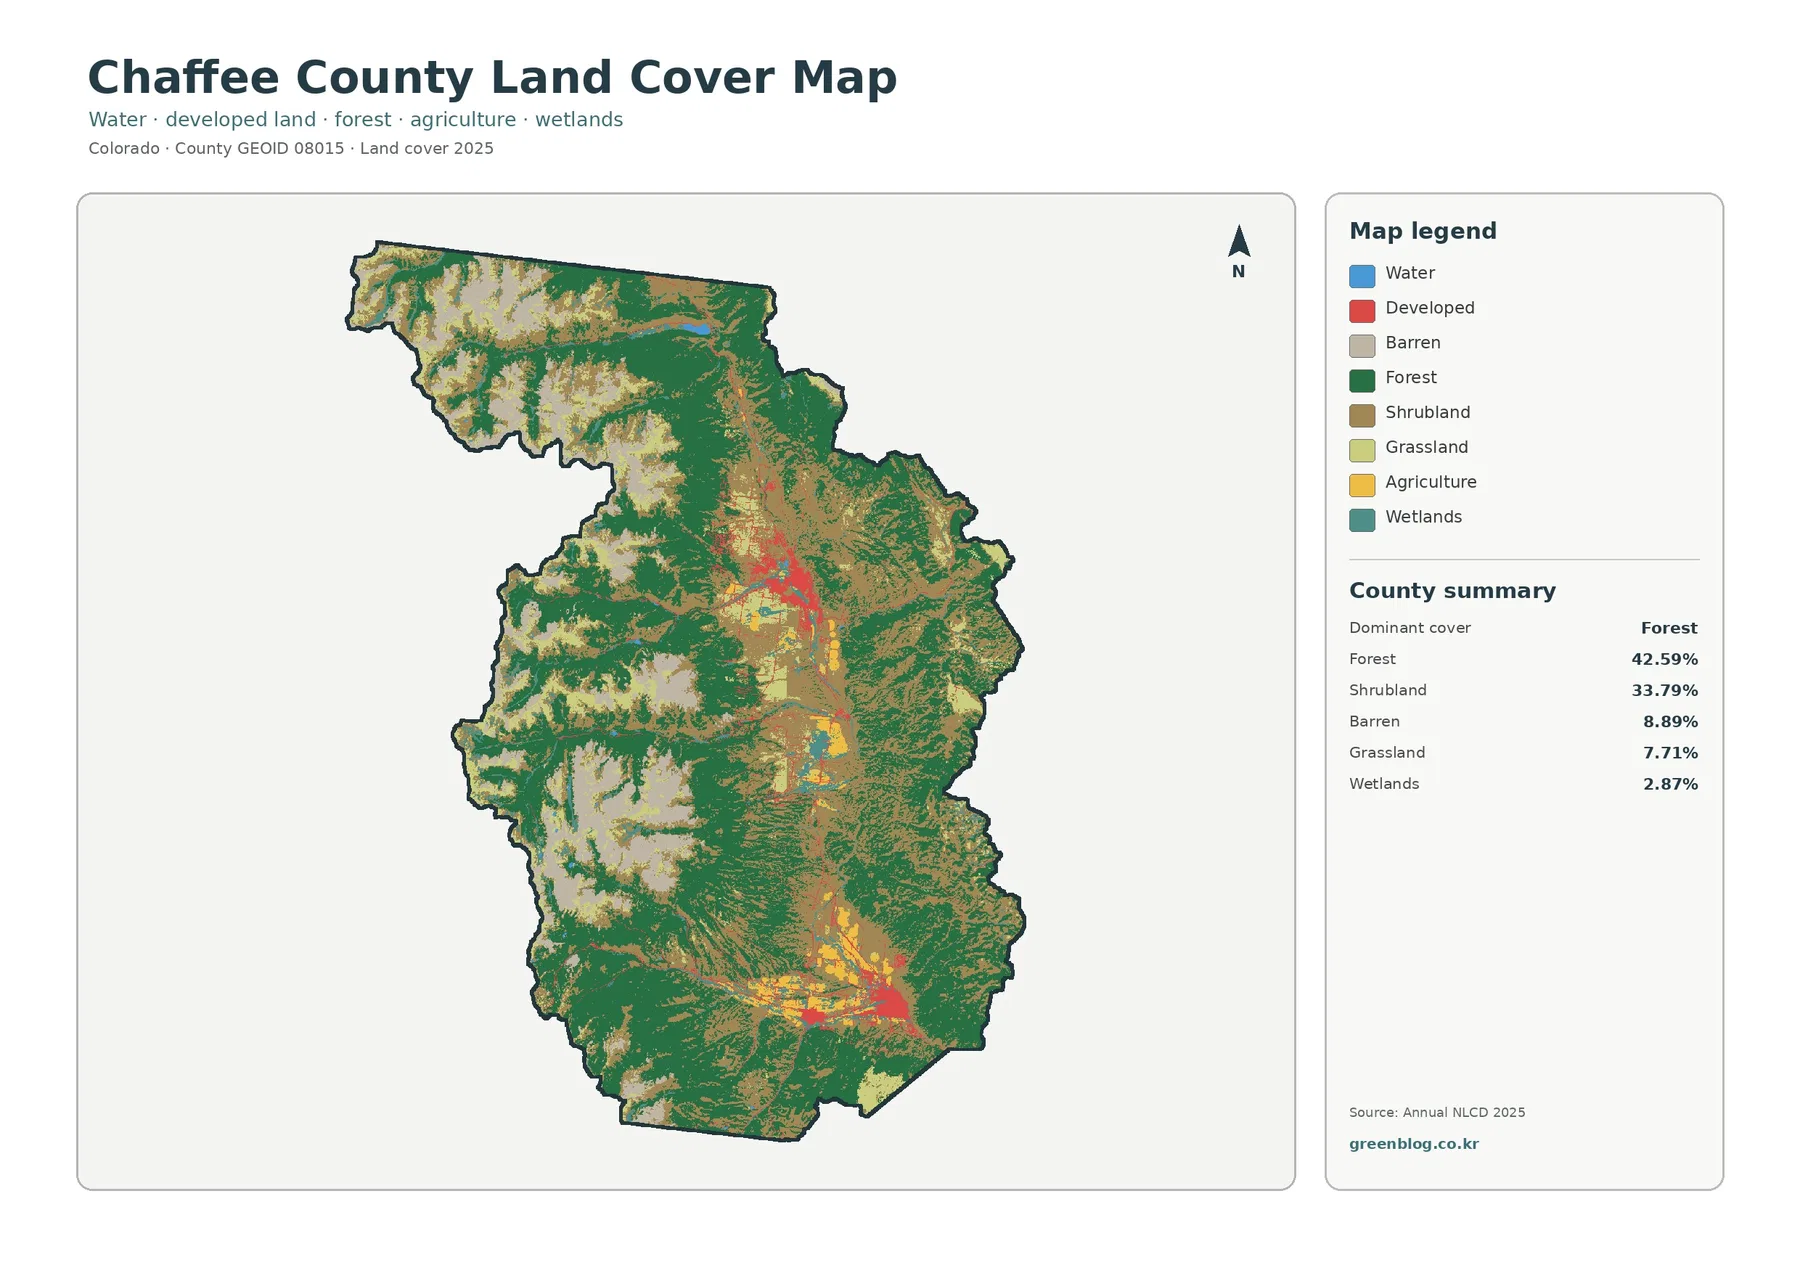
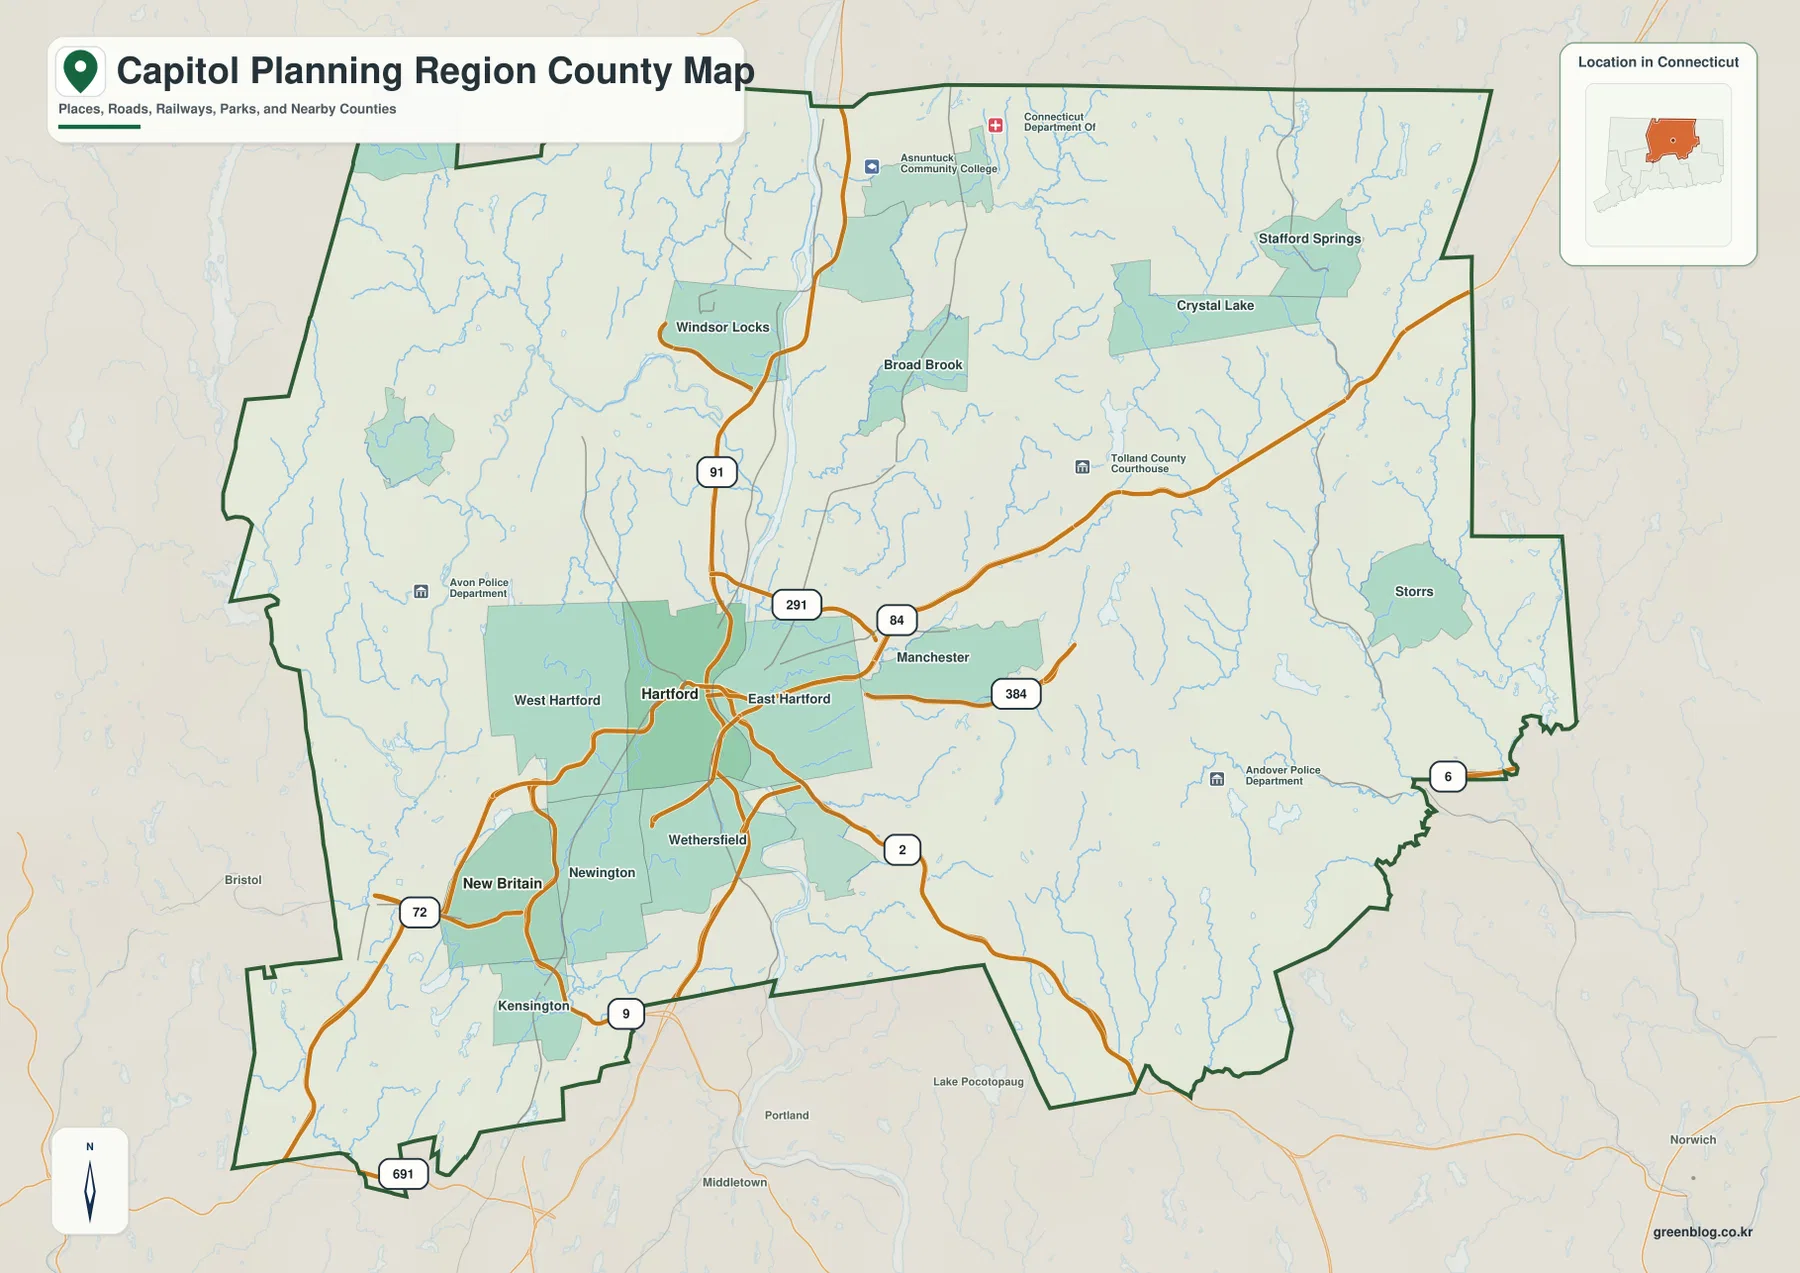
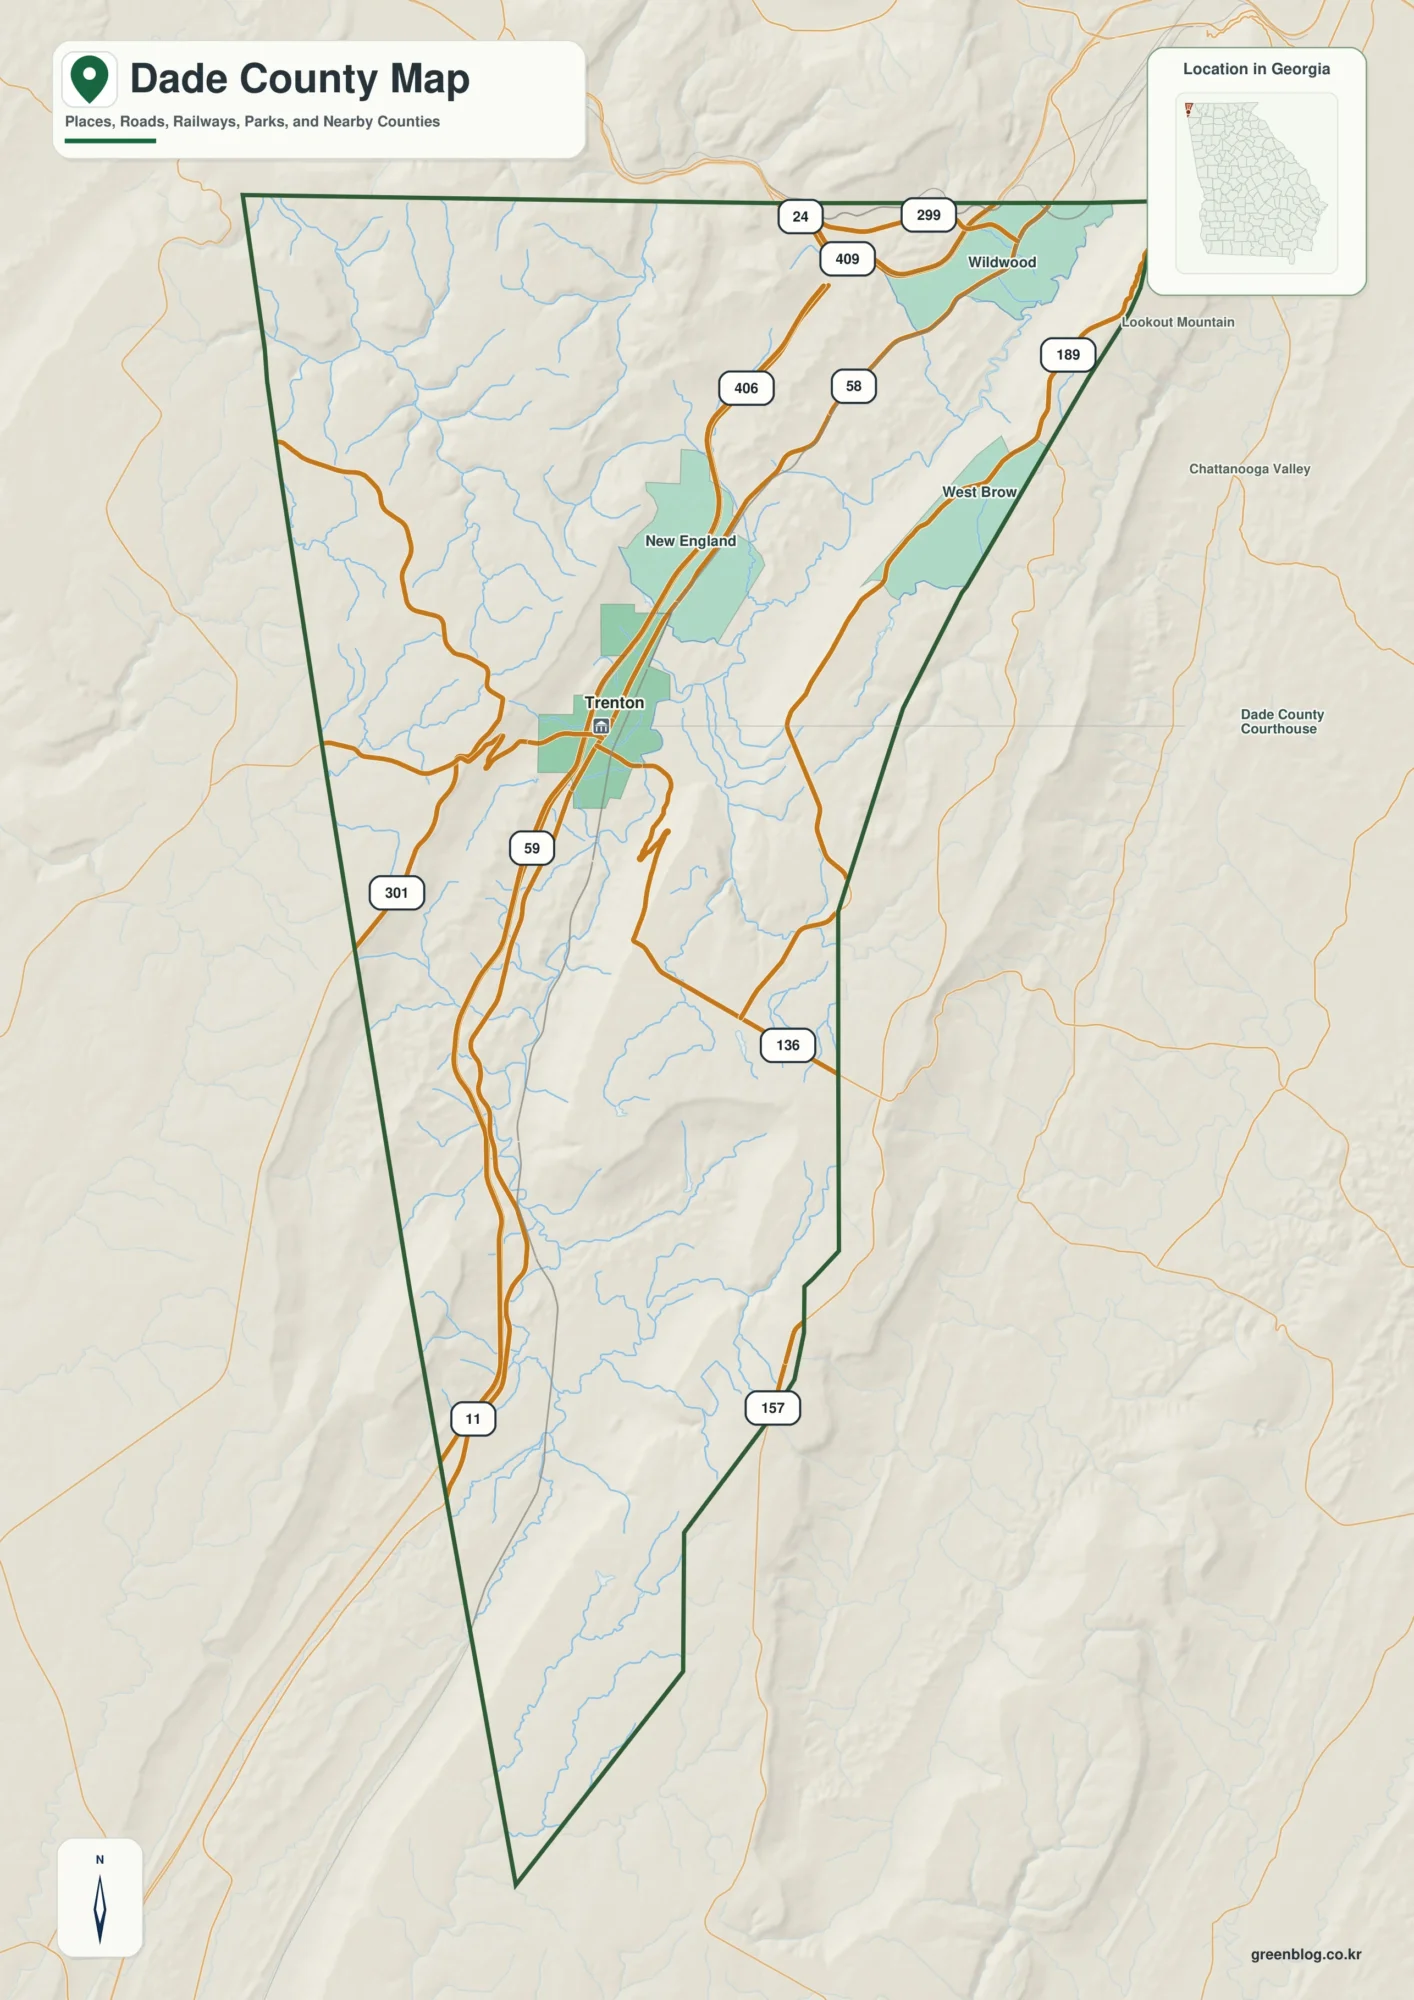
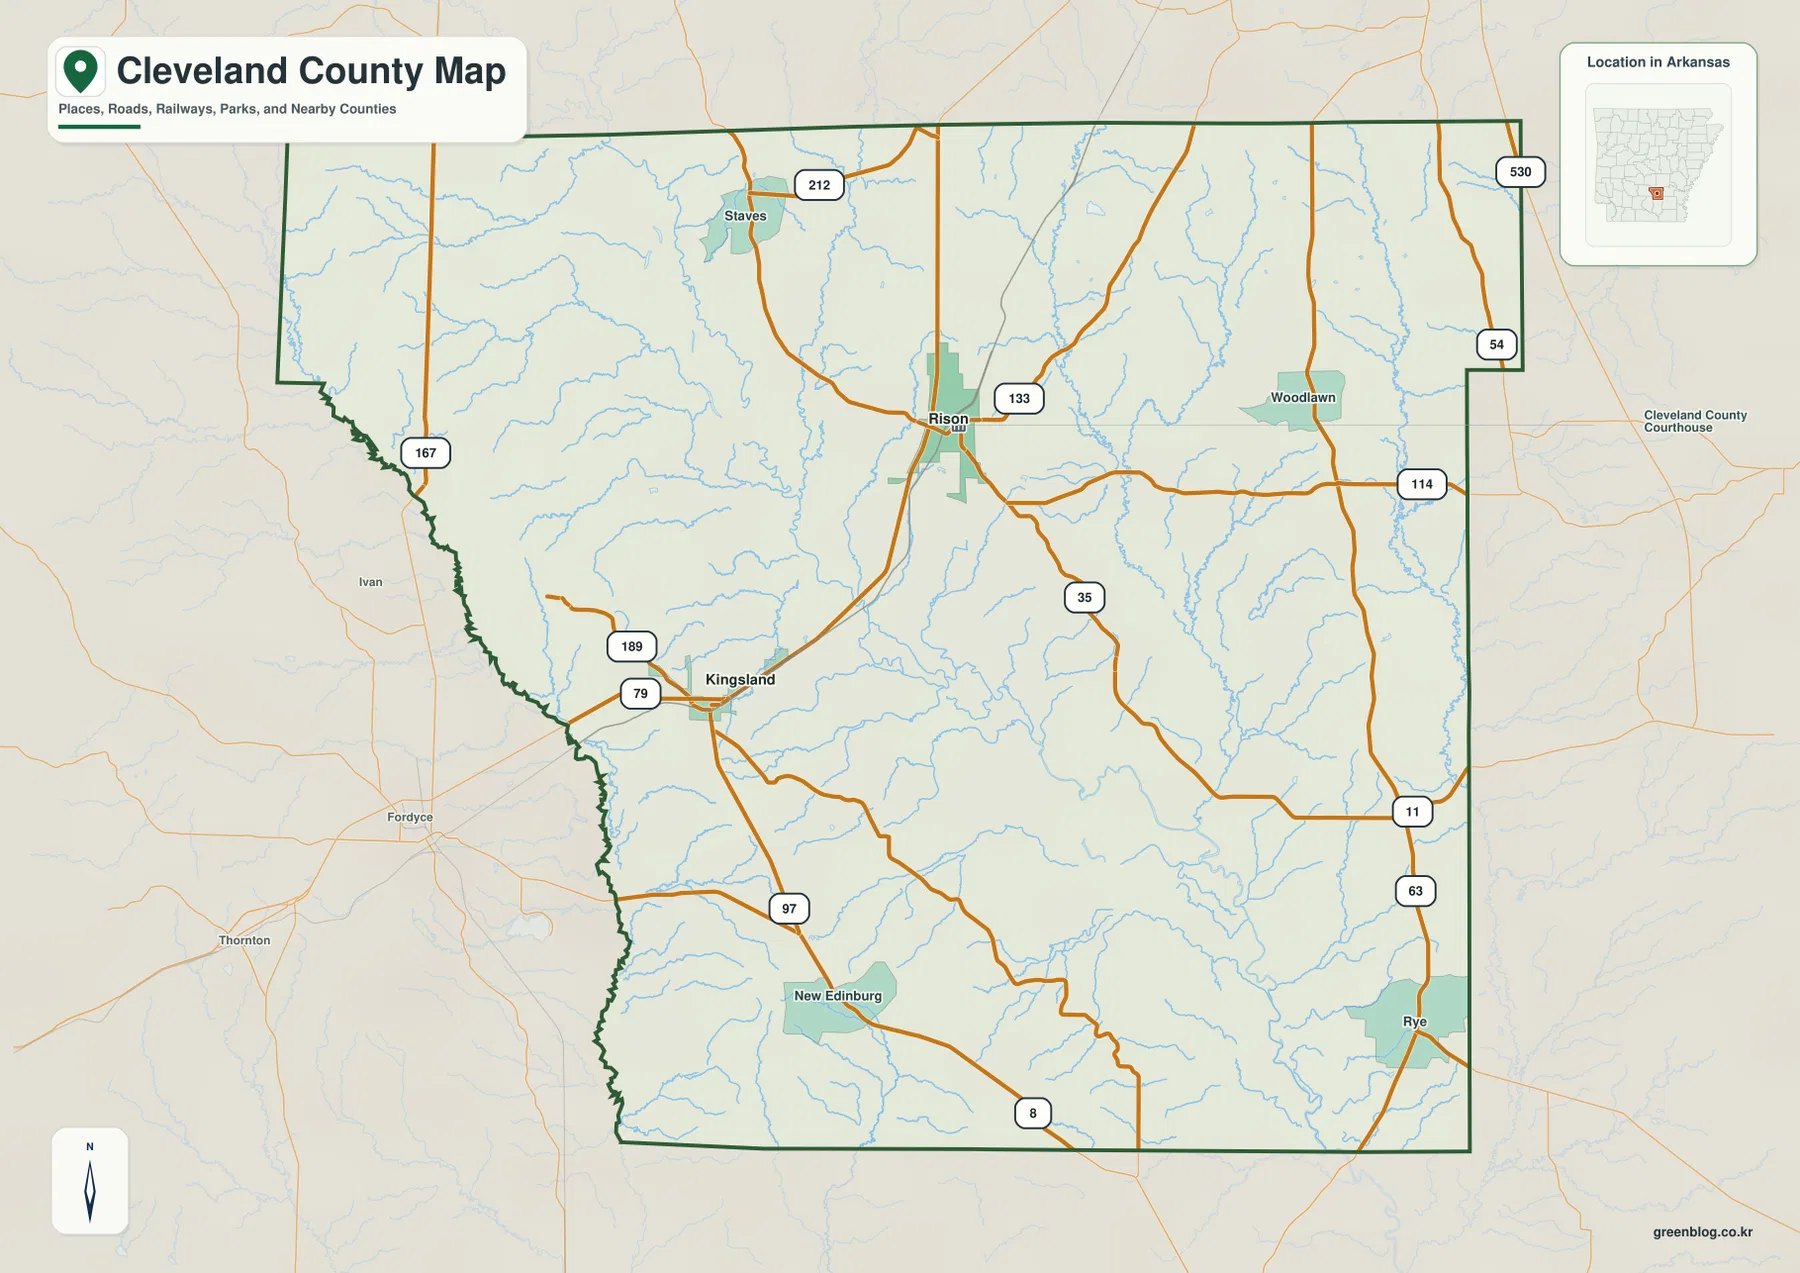
Montgomery County in west-central Arkansas is a strongly forested Ouachita Mountains county. The 2025 land-cover summary assigns 80.26% of the county to forest, compared with 10.88% agriculture, 4.31% developed cover, and 2.33% water. Four views on this page separate those patterns so you can compare the countywide cover, forest and farmland, impervious surfaces, and mapped class differences between 1985 and 2025.
The four original JPG maps are available together in one download near the end of the page. Use the general map for a quick landscape overview, the forest-and-farmland view for open-land patterns, the impervious map for pavement and building footprints, and the change map to locate places where the two comparison years received different land-cover classifications.
Table of Contents
Why the 2025 county map is dominated by forest
A broad green field covers most of Montgomery County, with other classes breaking it into smaller pockets rather than replacing it across large areas. That visual impression matches the 80.26% forest figure in the county summary. The pattern is also consistent with the county’s setting in the Ouachita Mountains, where the Ouachita National Forest surrounds Mount Ida and covers extensive ridges and wooded uplands.
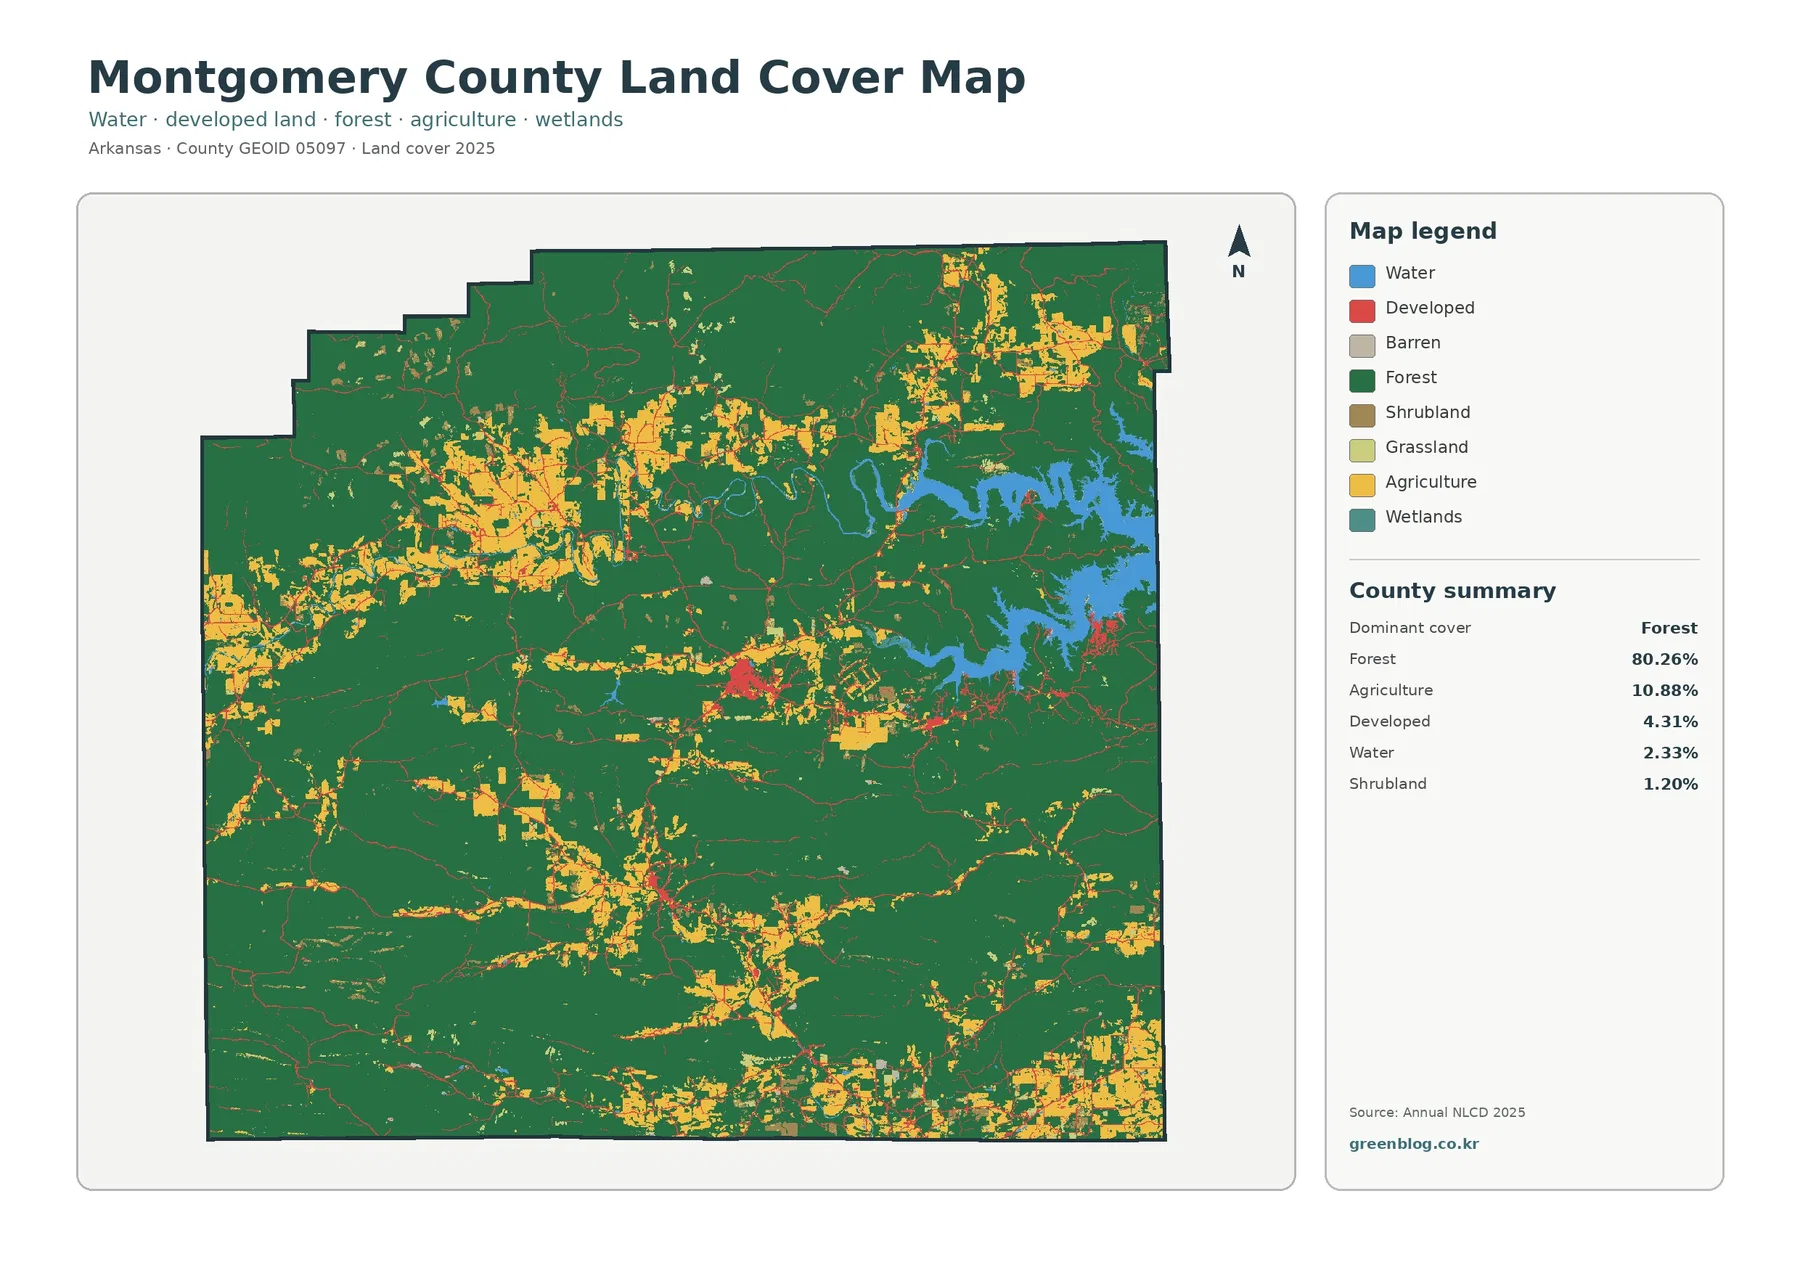
Agricultural cover accounts for 10.88%, but it does not form a single broad plain. Yellow agricultural areas occur in several groups across the northwest, north-central area, southern interior, and along the county’s southern edge. Developed cover is still more limited. Red patches are concentrated around settlement and transportation areas, while long stretches between them remain forested.
Land cover should not be confused with zoning or legal land use. The map classifies what is observed at the surface, such as forest, water, agriculture, or developed cover. It does not show ownership, parcel boundaries, building rights, conservation easements, or local zoning decisions. A parcel can contain more than one mapped cover type and still have a single legal use designation.
Impervious surfaces reveal a small but connected human footprint
Montgomery County’s mean impervious value is 0.70%, and only 0.17% of the county is mapped at 50% impervious or higher. Those numbers explain why most of the impervious map is pale. Pavement, rooftops, and other surfaces that shed water instead of absorbing it are concentrated in small clusters and thin road-like lines rather than broad urban blocks.
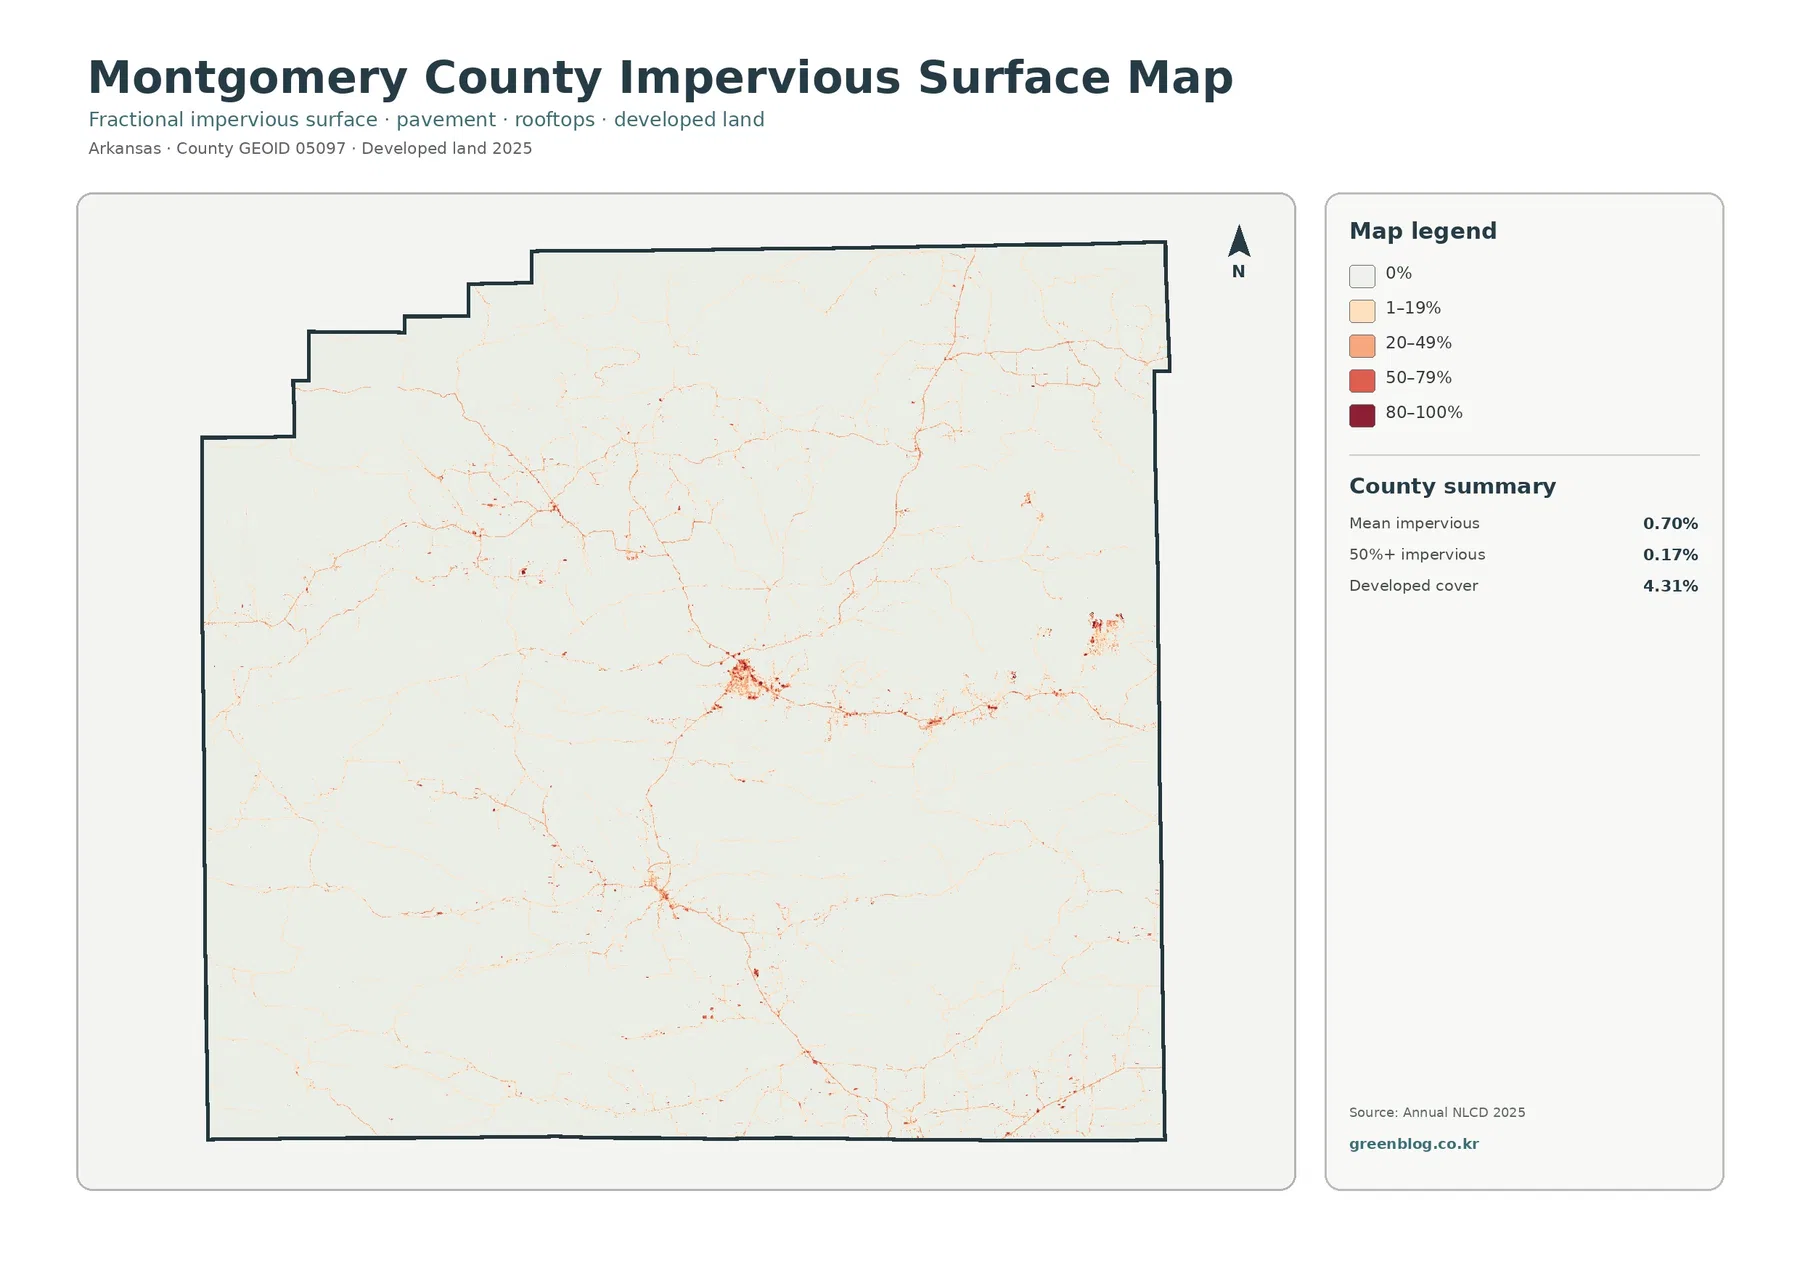
The most noticeable concentration is around the central Mount Ida area, with additional narrow traces extending along transportation corridors and smaller settlement areas. This is a different view of development from the 4.31% developed-cover statistic. A low-density residential area can be classified as developed while still containing many trees and lawns, so its impervious percentage may remain low. Conversely, a compact paved site can have a high impervious value even though it occupies only a tiny area.
That distinction makes the layer useful for introductory watershed studies. Students can compare places classified as developed with the much smaller subset that has dense pavement or building coverage. The same comparison can help when preparing a presentation about how a mostly forested county still contains connected transportation and settlement footprints.
Impervious percentage alone does not predict runoff or flooding. Slope, soils, drainage systems, rainfall, and stream conditions also matter. The map should therefore be used to locate built-surface concentrations, not to calculate engineering risk or determine stormwater requirements for a property.
Lake Ouachita creates the clearest water-and-forest contrast
The branching blue water body on the eastern side of the county is one of the easiest features to recognize. Lake Ouachita extends into Montgomery County from the east and is surrounded by wooded terrain associated with the Ouachita National Forest. Because its coves and narrow arms reach far into the forest, the lake has a much stronger visual presence than its 2.33% countywide water share might suggest.
Open land appears in pockets rather than broad agricultural belts
Removing much of the visual competition from other cover classes makes the forest-and-farmland map especially useful in Montgomery County. Forest remains the continuous background, while cropland, pasture or hay, and other open vegetation appear as irregular patches. The larger concentrations are separated by wooded ridges and forest blocks, so the county does not resemble the broad, uninterrupted farm landscapes found in flatter parts of Arkansas.
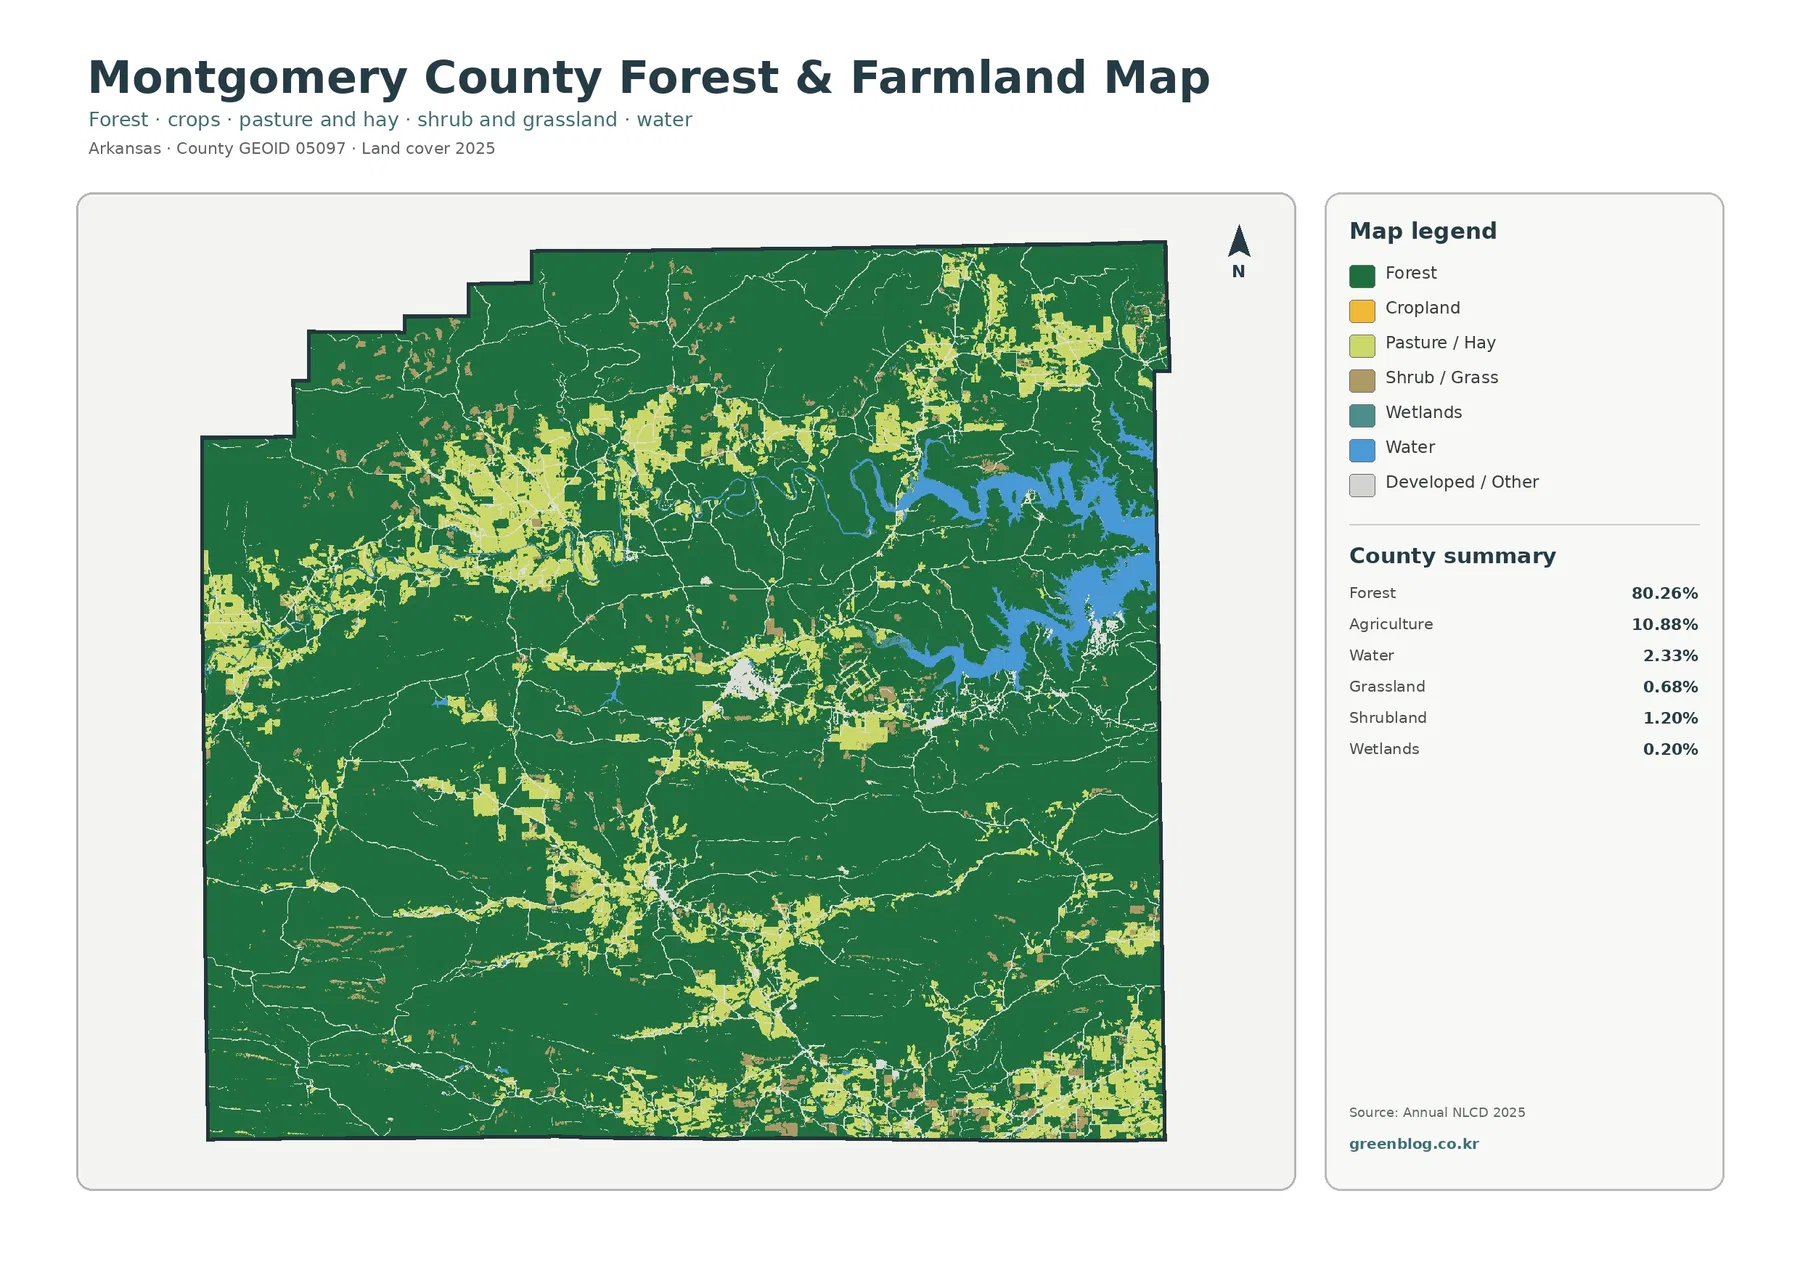
The 10.88% agriculture figure should be read as a countywide summary rather than a description of one type of farm. The mapped agricultural colors can represent cropland and pasture or hay, and the map does not identify individual crops or livestock operations. The University of Arkansas Extension office in Montgomery County provides programs for beef, forage, horticulture, soil testing, and hay testing, which offers useful local context for why pasture and other agricultural land are relevant even in a county dominated by forest.
Reading forty years of mapped class differences
The 1985–2025 change view is the most complex of the four maps because it does not simply describe the current surface. It flags raster cells where the two comparison years have different classifications. The county summary reports 23.47% class difference, including 0.87% classified as a move to developed, 3.33% forest loss, 0.43% agricultural loss, and 18.81% other class difference.
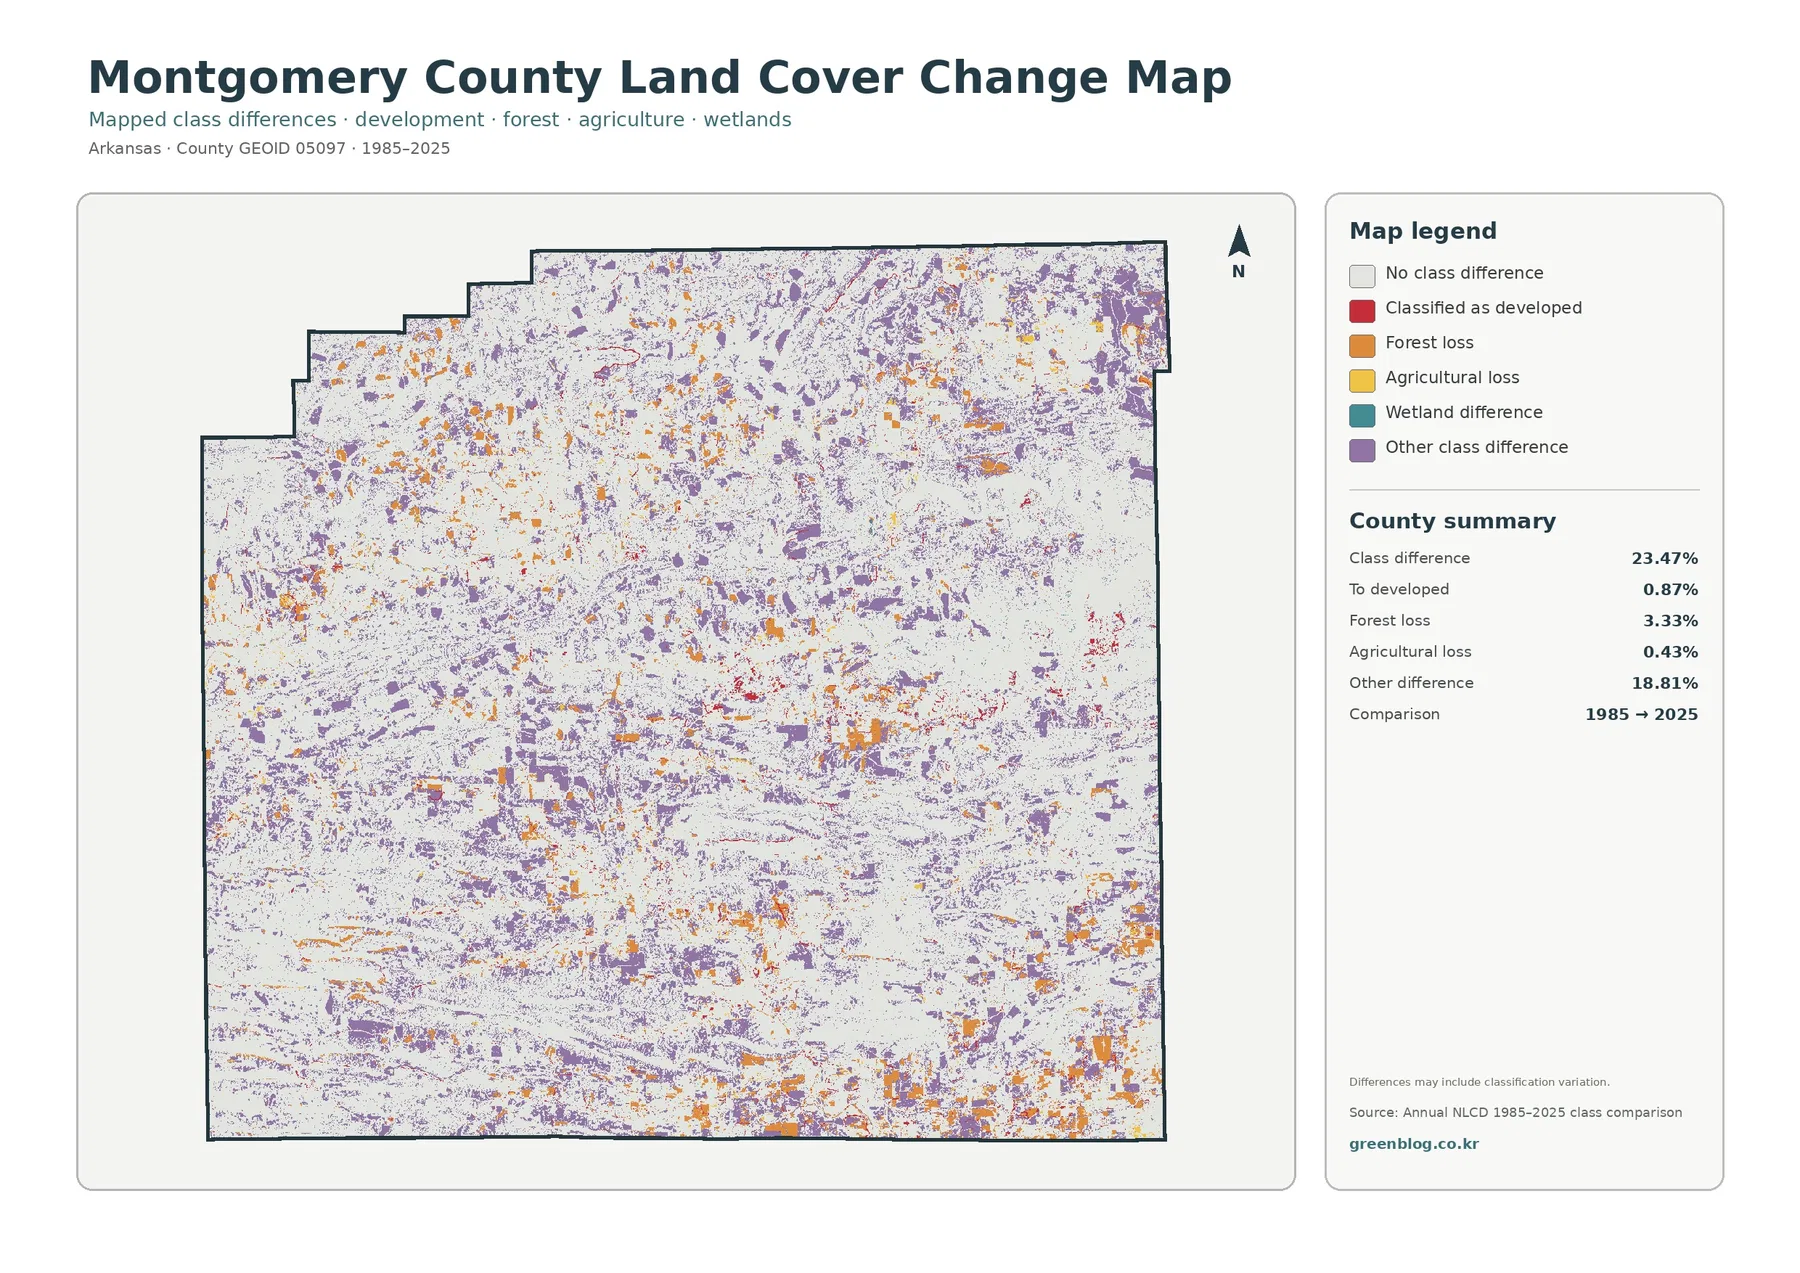
Purple “other class difference” pixels are widespread, while orange forest-loss patches and smaller developed-change areas appear in selected locations. The map itself warns that differences may include classification variation. That caution is essential: 23.47% should not be reported as the percentage of Montgomery County that was physically transformed by people, and 3.33% should not automatically be treated as net forest decline.
A better way to use this layer is as a screening map. First identify a cluster of change, then compare it with the 2025 land-cover map and, when the question matters, check annual NLCD layers or historical aerial imagery. A cell currently classified as forest may still be marked as different because it had another class in 1985. The two-year comparison does not explain the timing or cause of that transition.
Scale, raster cells, and other limits to keep in mind
Annual NLCD products are designed to classify large areas consistently. They use a raster grid, which means the landscape is divided into cells rather than traced along every fence, driveway, streambank, or property line. A commonly used 30-meter cell can contain several real-world surfaces at once. The classification assigns a representative category, so small mixed features may be generalized or omitted.
The date matters as well. A 2025 classification cannot include land changes that occurred after the observation period. Recent construction, timber harvest, wildfire effects, or agricultural conversion may not appear. When current site conditions are important, compare the map with newer aerial imagery and local records instead of assuming the classification is a live view.
Download the Montgomery County land-cover map set
The ZIP below contains the same four original JPG maps discussed on this page: general land cover, forest and farmland, impervious and developed land, and the 1985–2025 change comparison. They can be used for teaching, reference, presentations, and countywide environmental context, with the limitations described above.
Frequently Asked Questions
How forested is Montgomery County in the 2025 map?
Forest accounts for 80.26% of the county summary, making it by far the dominant cover. Agriculture is 10.88%, developed cover 4.31%, and water 2.33%. The map also includes smaller areas of shrubland, grassland, wetlands, and barren land.
Which map is best for seeing development around Mount Ida?
Use the impervious-surface map when the goal is to see pavement, rooftops, and road-like built surfaces. The general land-cover map is better for comparing Mount Ida’s developed footprint with surrounding forest and agricultural cover. Looking at both avoids treating all developed land as equally paved.
Sources and Reference Data
- MRLC Annual NLCD Data – land-cover and annual classification data
- USGS Annual NLCD Land Cover Classification – class definitions and interpretation guidance
- U.S. Census Bureau TIGER/Line Shapefiles – county boundary reference
- U.S. Forest Service Caddo/Womble Ranger District – Ouachita National Forest context around Mount Ida
- University of Arkansas Extension, Montgomery County Programs – local agriculture, forage, horticulture and testing programs
Map File Information
The download contains four original Montgomery County JPG maps covering 2025 land cover, forest and farmland, impervious/developed surfaces, and mapped class differences from 1985 to 2025.
- Printable Size: 2480×1754 pixels each
- File Type: ZIP containing four JPG files
Related Maps
- A Craighead County Arkansas Land Cover Map
- Arkansas County Arkansas Land Cover Map
- Ashley County Arkansas Land Cover Map
Green Map creates custom-edited map images using open geographic data sources such as geoBoundaries, Natural Earth, OpenStreetMap, and government open data.
These maps are edited visual materials, not raw data files, and are provided for education, documents, presentations, and graphic reference.