Camas County’s 2025 land-cover summary is led by shrubland at 47.51%, but the county does not look uniform. Forested mountain country dominates the north, while the central and southern Camas Prairie contains a broad agricultural belt, wetlands, grassland, and open shrub cover. This Camas County Idaho Land Cover Map focuses on that transition from mountain forest to a high agricultural prairie rather than treating the county as one continuous landscape.
The page compares 2025 land cover, forest and farmland, impervious surface with developed land, and 1985–2025 endpoint class differences. WebP versions appear with the discussion, and the four original 2480 × 1754-pixel JPG files are available together in one ZIP below. The set is especially useful for comparing the Camas Prairie farm grid, wet ground around the prairie, the sparse built footprint near Fairfield, and the forested northern half.
Table of Contents
The county changes from forested mountains to an open prairie in a short north–south distance
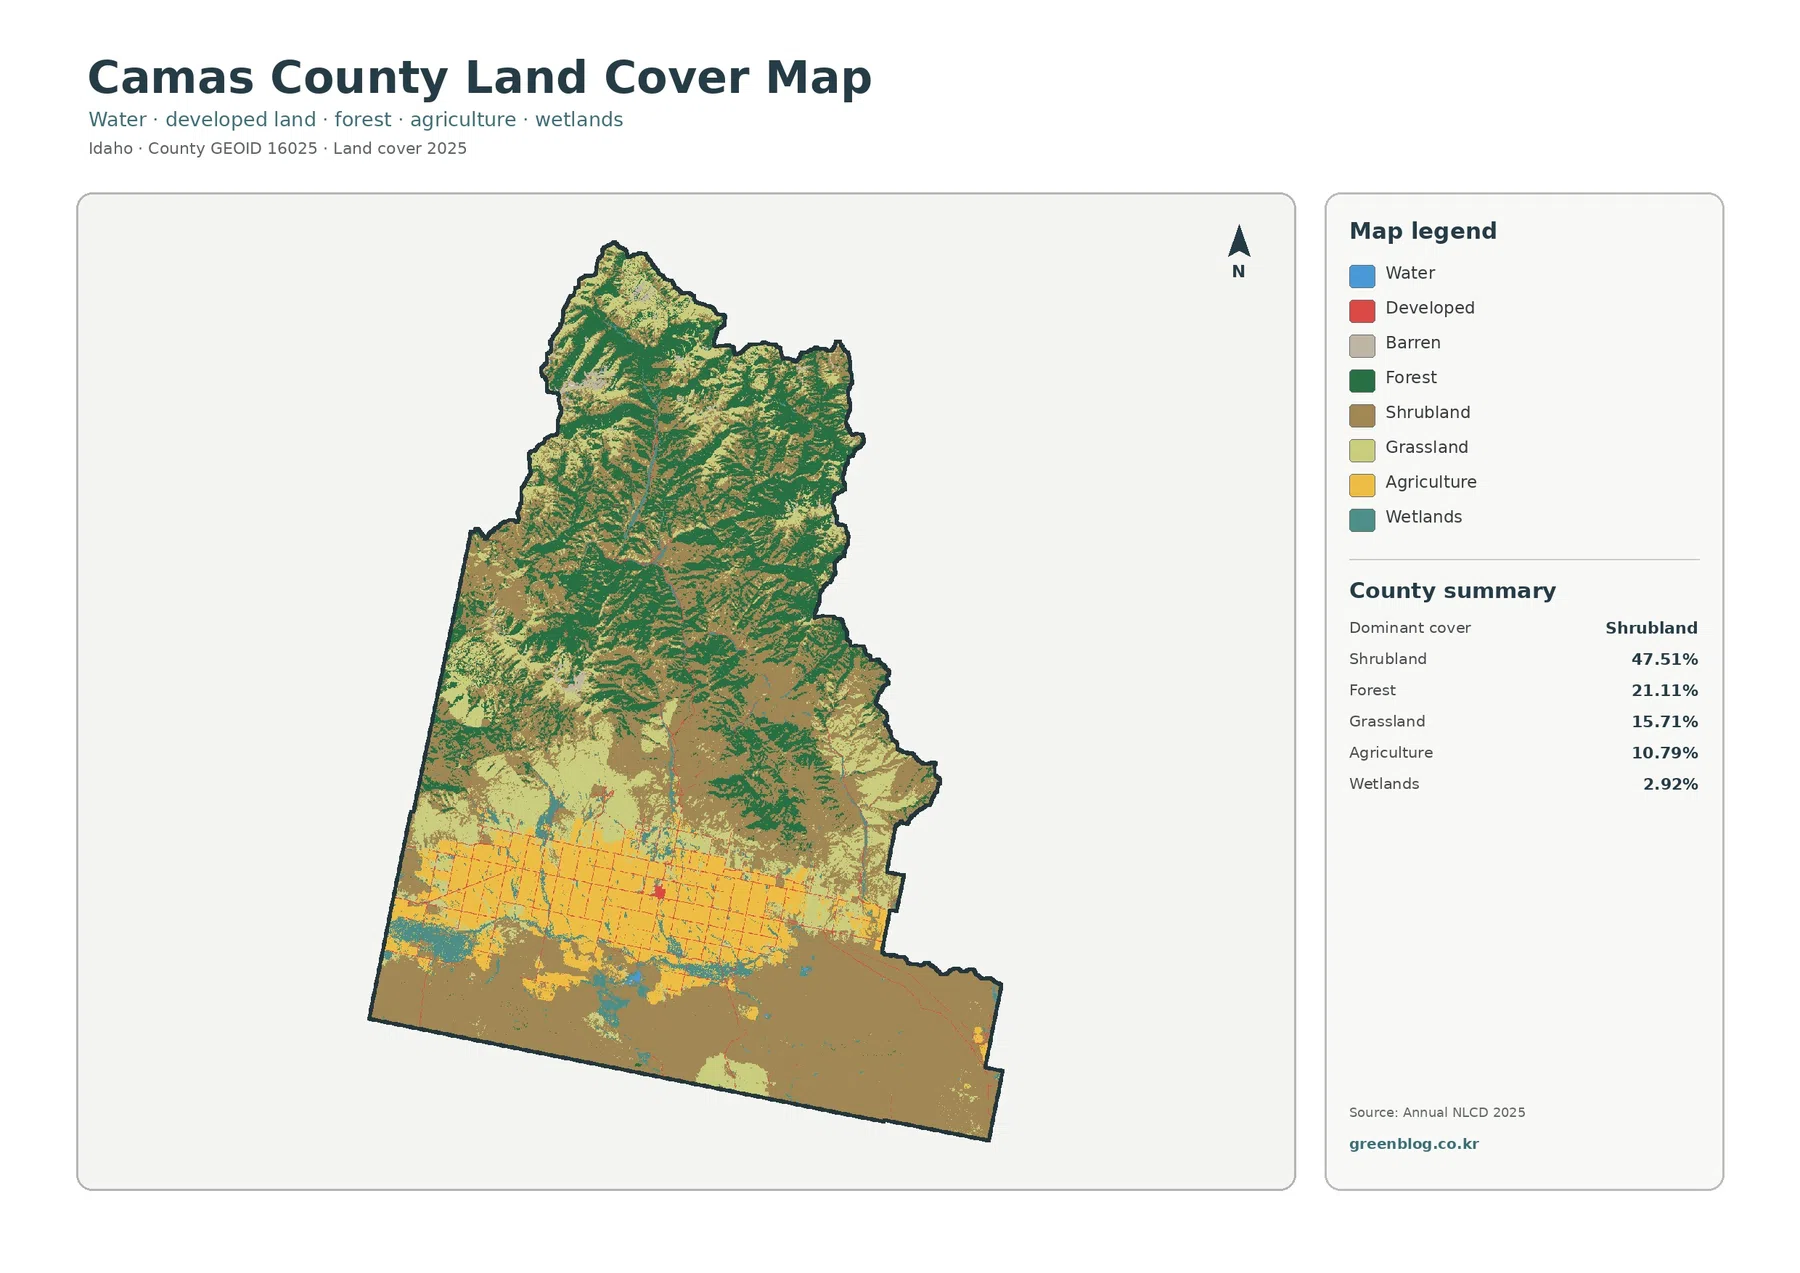
Shrubland is the largest class at 47.51%. It spreads across much of the middle and south, with especially broad brown areas near the southern county line and through open uplands west and east of the prairie. Grassland adds 15.71% and appears as lighter green areas mixed with shrub cover. Those two classes together occupy well over half the county, giving most of the central and southern landscape a much more open appearance than the dark-green northern mountain blocks.
Forest covers 21.11%, but its location makes it one of the strongest visual features. The largest connected forest areas occupy the north and northeast, and green fingers extend south along mountain valleys and ridges. Camas County’s official comprehensive plan describes the northern half as mountainous and part of the Sawtooth National Forest. The land-cover image does not draw the administrative forest boundary, yet the forest concentration closely matches that official description of the county’s northern terrain.
South of the mountains, the map changes abruptly. The county plan describes the Camas Prairie as a former lake bed and high plateau supporting residences, farmland, rangeland, and marsh. On the 2025 image, that same broad central-southern area contains the strongest agricultural concentration, wetland strips, grassland, and shrubland. The prairie therefore functions as the main visual break between northern forest and the drier shrub-dominated land farther south.
A concentrated farm grid occupies the prairie while forest follows higher northern terrain
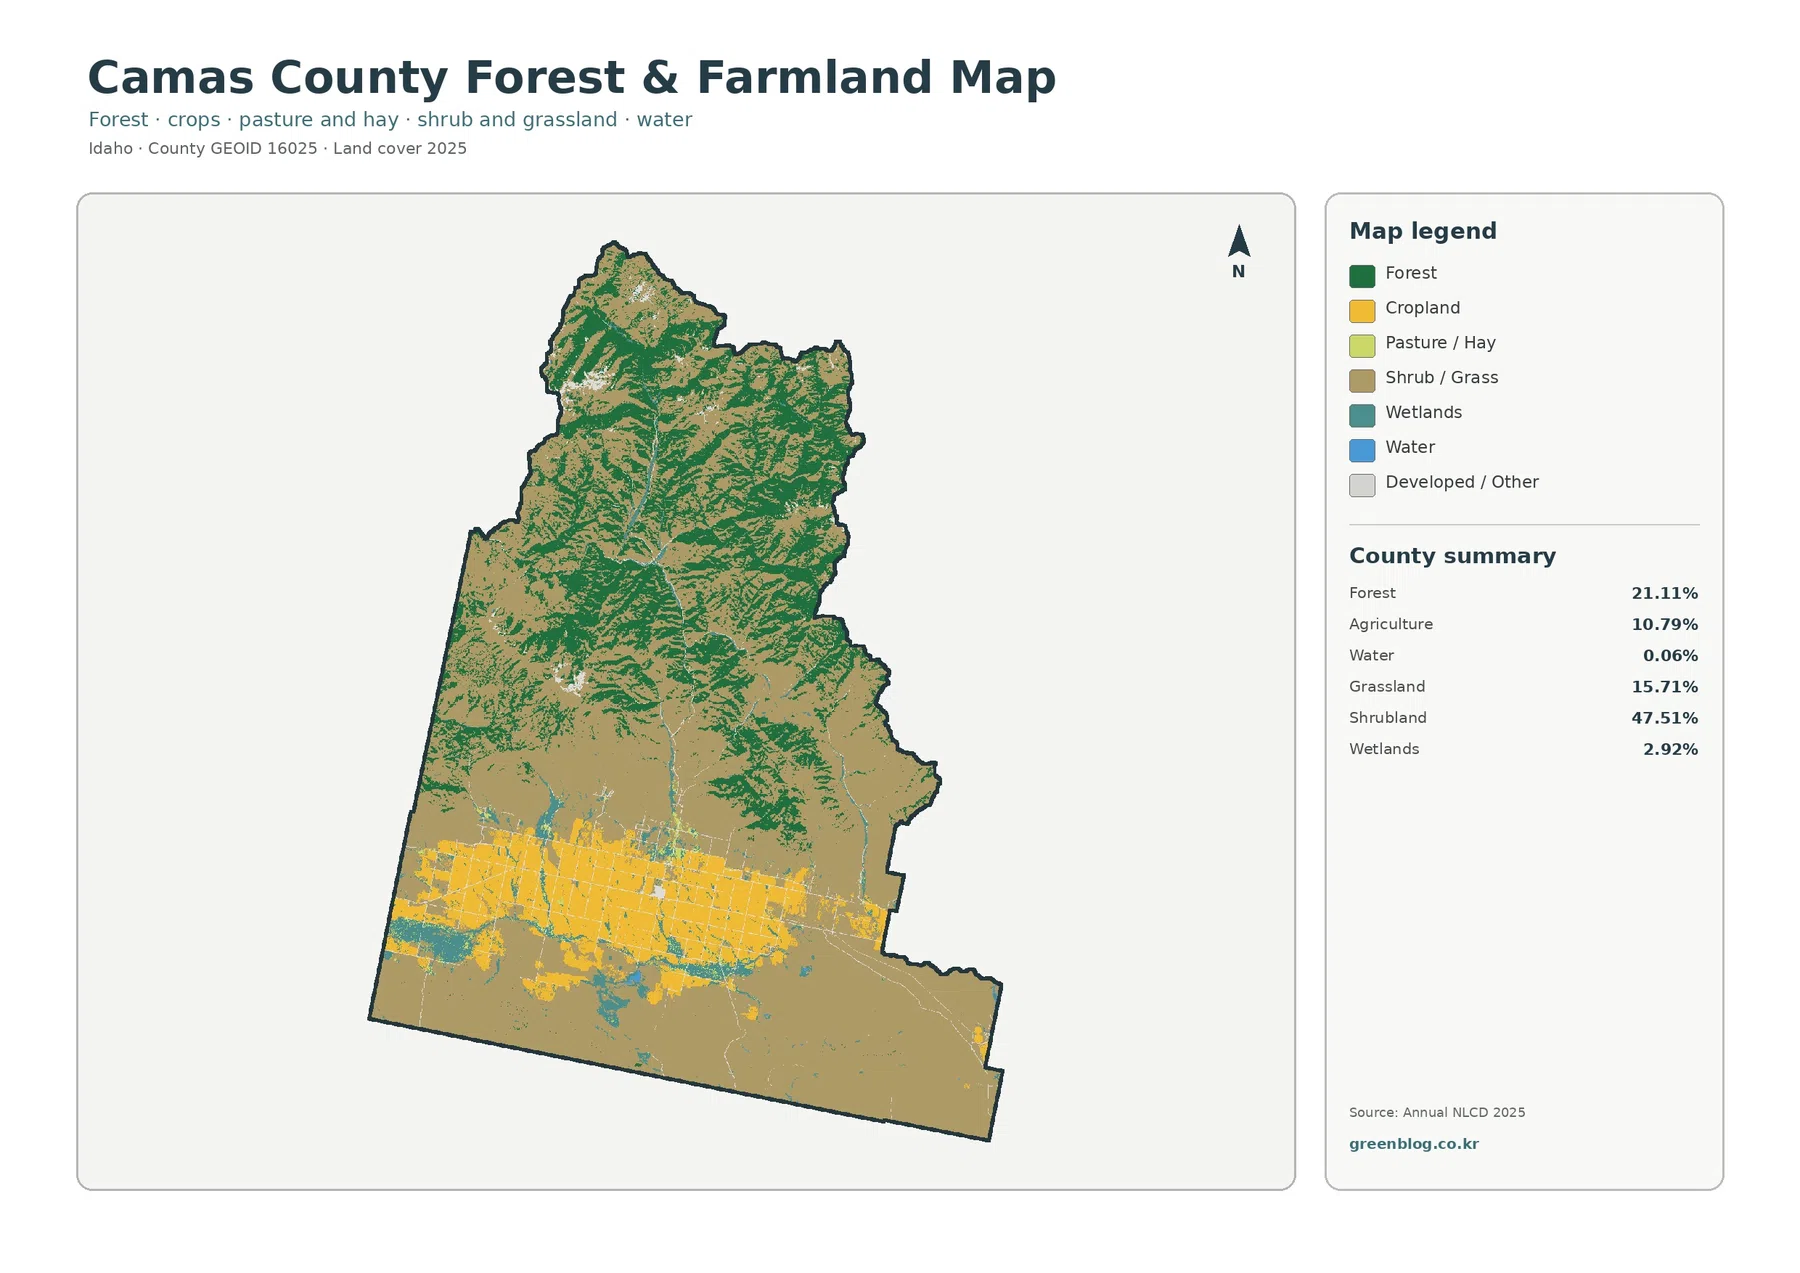
Agriculture covers 10.79%, and nearly all of its visual weight is concentrated in the central-southern prairie. The yellow crop and pasture areas form a broad horizontal belt with many straight field edges. This geometry differs sharply from the irregular forest fingers farther north. The pattern shows that cultivated land is not scattered evenly through Camas County; it is focused on the broad, flatter prairie where the county’s official planning material also places farmland and residential activity.
Hard surfaces remain rare even where Fairfield and prairie roads are visible
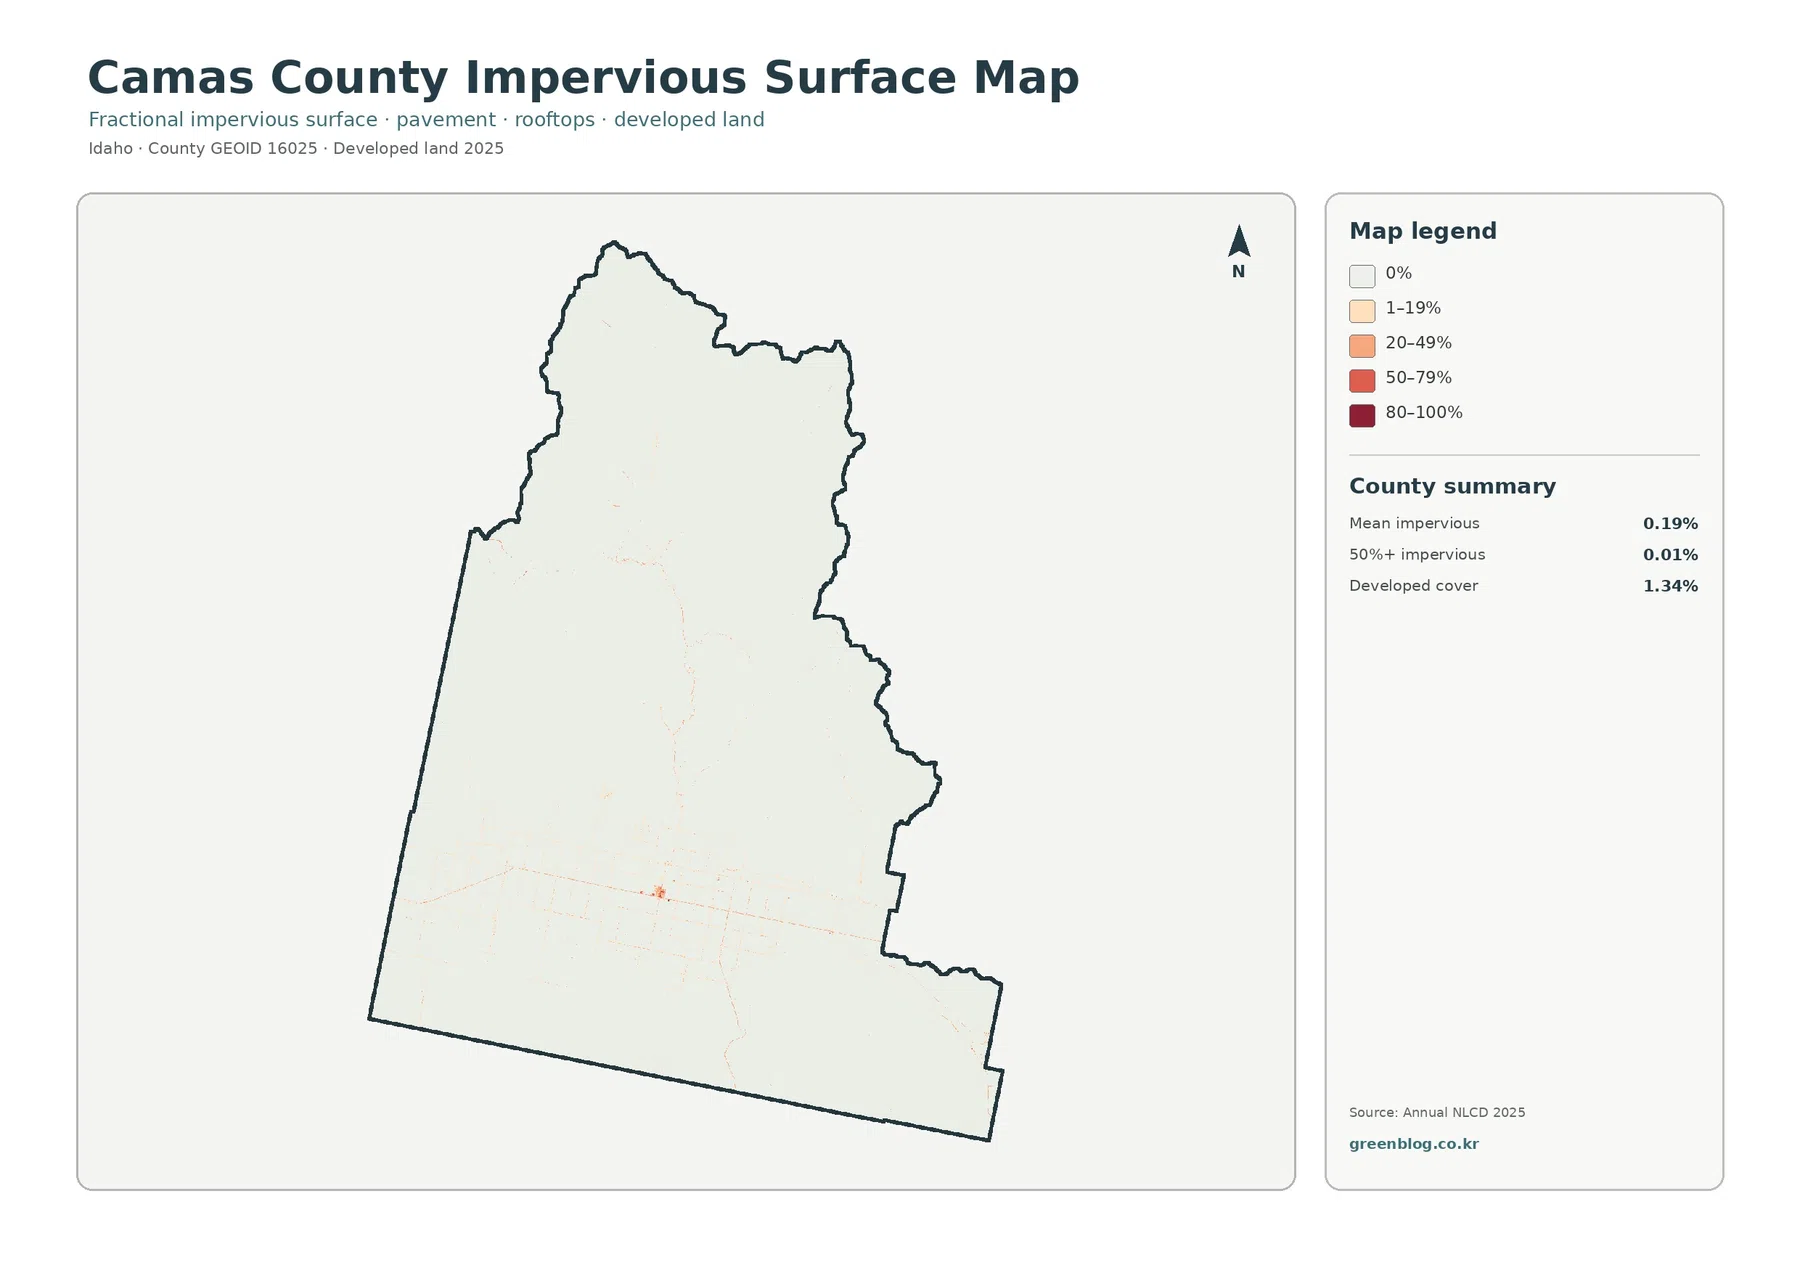
Impervious surface is hard cover such as rooftops, pavement, and parking areas where water does not readily soak into the ground. Camas County’s mean impervious value is only 0.19%, and cells with at least 50% impervious cover account for 0.01%. Developed land covers 1.34%. The map therefore confirms that most of the county remains forest, shrub, grass, farmland, or wet ground rather than continuous built surface.
Developed cover at 1.34% is much larger than the 0.19% mean impervious value because the two measures describe different things. A developed land-cover class can contain lawns, trees, bare soil, and other permeable surfaces around buildings and roads. The impervious layer isolates the hard fraction. This distinction matters in a rural county where scattered homes and roads can produce a developed classification without creating a large continuous paved area.
The 20.81% endpoint difference is dominated by non-development class changes
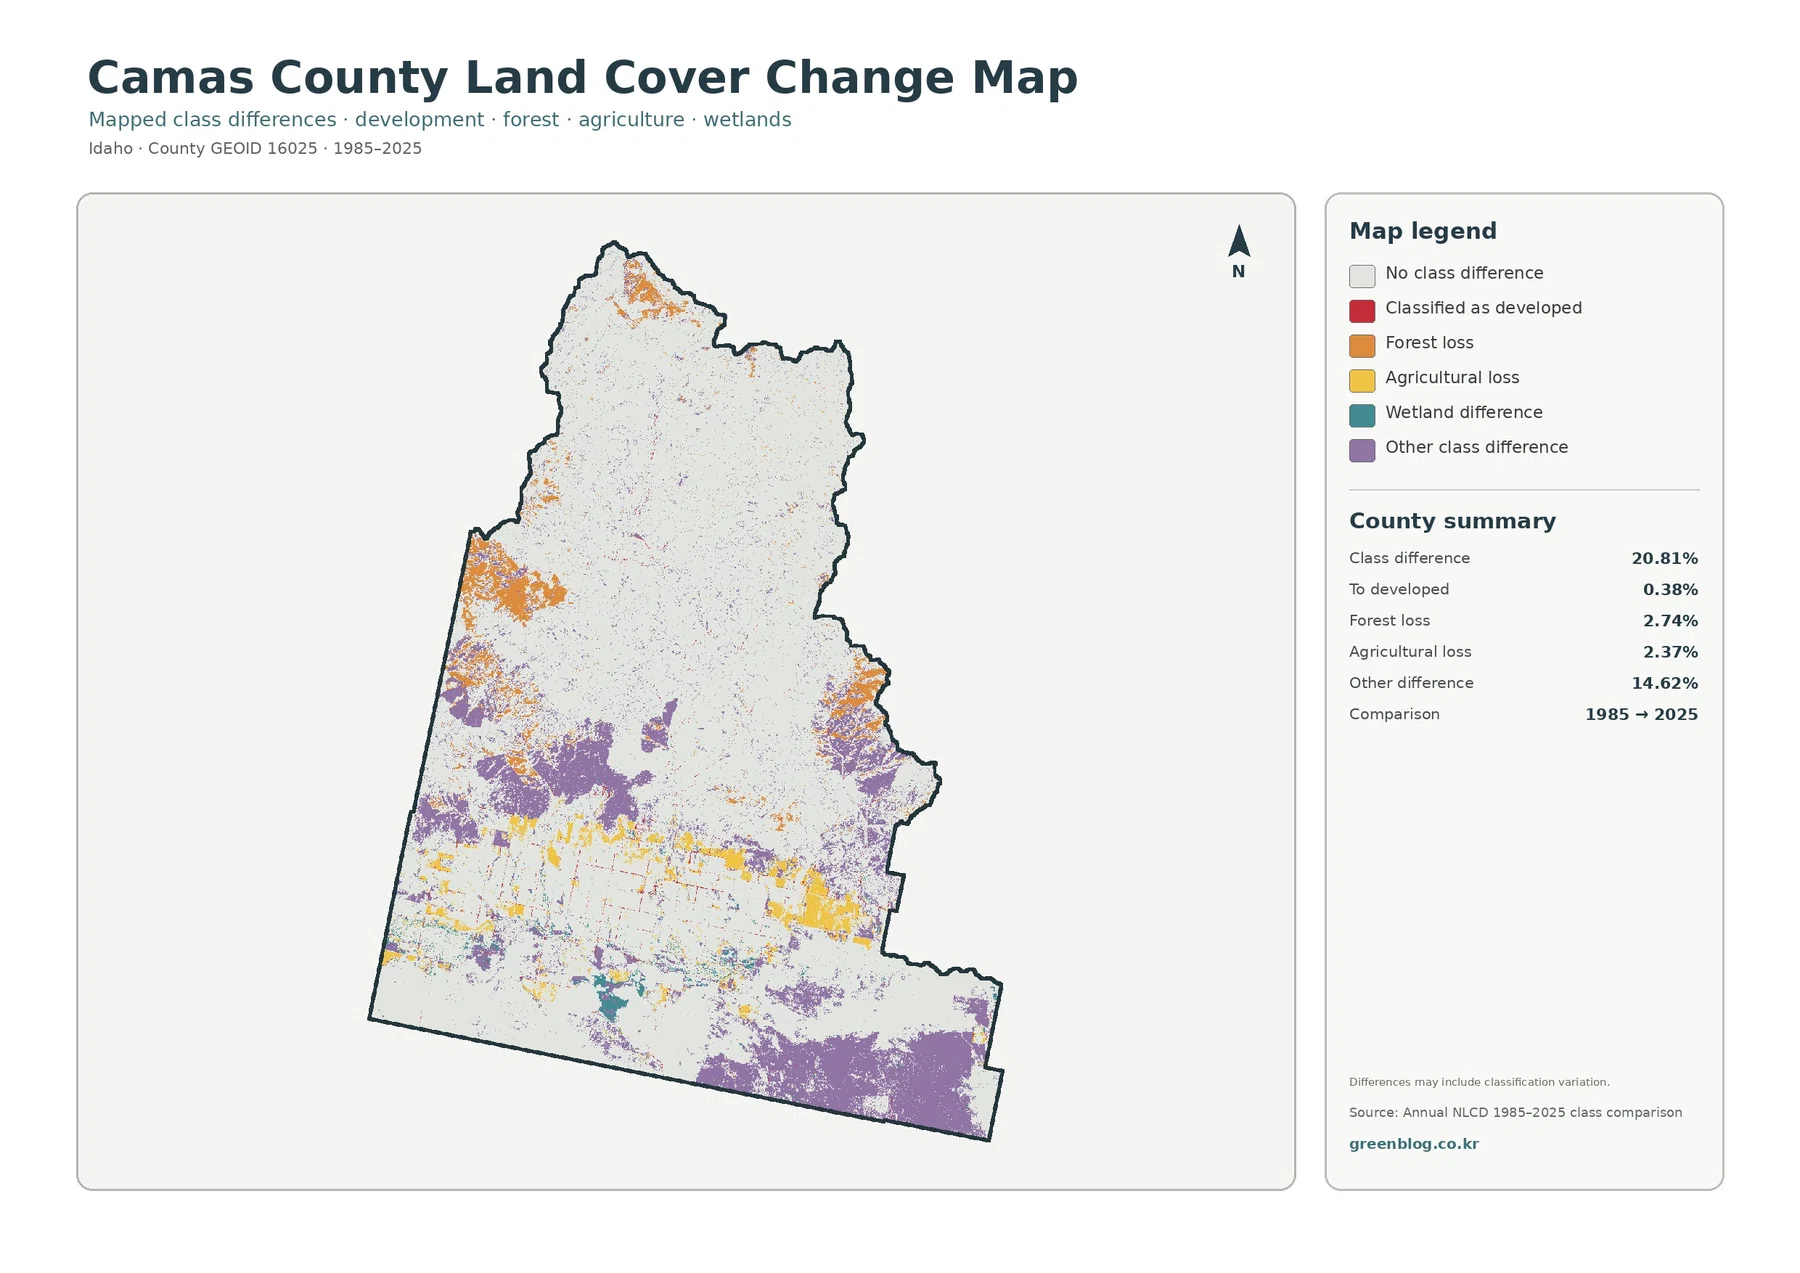
The endpoint comparison marks 20.81% of Camas County as a different class in 1985 and 2025. Only 0.38% is listed as classified to developed. Forest loss is 2.74%, agricultural loss 2.37%, and other class difference 14.62%. The total therefore cannot be described as a 20.81% development increase. Most of the mapped change belongs to differences among vegetation, agriculture, wetland, barren, and other non-developed classes.
Orange forest-loss patches are visible near the northern tip and in a larger west-central cluster. Yellow agricultural-loss areas are concentrated through parts of the Camas Prairie, where current agriculture is strongest. Purple other-difference areas are widespread through the central and southern shrub-and-grass country and along several prairie margins. The red classified-to-developed marks are much smaller and largely remain near the same settlement and road traces that appear on the impervious map.
Centennial Marsh and Camas Creek provide context for the prairie wetland pattern
Camas County’s comprehensive plan identifies Centennial Marsh at the western end of the Camas Prairie and says Camas Creek flows east across the county. Those official references help orient the teal wetland areas that appear west of and within the farm belt. The land-cover image does not provide legal wetland boundaries or label the marsh, but the concentration of wet cover in the same broad prairie setting is consistent with the county’s physical description.
Pair the files by question to keep the Camas Prairie pattern clear
The 2025 overview is the best starting point for the full county because it shows the 47.51% shrubland background, northern forest, prairie agriculture, wetlands, and limited development together. The forest-and-farmland version then simplifies the same geography, making the yellow agricultural belt and northern forest easier to compare without the smaller current-cover classes competing for attention.
The change layer is most informative alongside a current map when the subject is endpoint difference. Purple and orange colors on that image are not current land-cover classes. A purple patch in the south means the 1985 and 2025 classifications differ there; it does not mean that the present surface is a special purple-coded land type. Keeping the current legend and change legend separate prevents that common confusion.
Thirty-meter cells and the 2025 observation date limit site-level conclusions
Annual NLCD is a raster product, meaning the landscape is divided into square cells and each cell receives a predominant class. At the commonly used 30-meter scale, a single cell can contain field edge, grass, road, drainage, and trees while still being assigned one category. That generalization is visible in the Camas Prairie grid, where narrow ditches and roads can appear blocky or merge with surrounding agricultural cover.
The current layers use the 2025 observation year. Construction, crop rotation, wildfire, vegetation recovery, drought, flooding, or wetland changes after that date may not appear. The 1985–2025 comparison also shows only two endpoints. A cell could have changed several times between those years and still end in a class similar to its starting class.
The download contains four original JPG files
The ZIP contains the original JPGs for 2025 land cover, forest and farmland, impervious surface and developed land, and 1985–2025 land-cover class differences. Keeping them together makes it easy to compare the same Camas Prairie field block, wetland edge, northern forest area, or Fairfield-area hard-surface trace across several layers without relying on a small composite image.
Frequently Asked Questions
What is the largest land-cover class in Camas County?
Shrubland is the largest 2025 class at 47.51%, followed by forest at 21.11%, grassland at 15.71%, and agriculture at 10.79%. The classes are not evenly distributed: forest is strongest in the north, while agriculture and wetlands are concentrated on the Camas Prairie.
Why are agriculture and wetlands both prominent on the Camas Prairie?
The maps establish that they occur together, while the county comprehensive plan describes the Camas Prairie as a former lake bed and high plateau containing farmland, rangeland, residences, and marsh. That is useful geographic context, but the maps alone cannot determine the drainage or irrigation cause for an individual field or wetland patch.
Does the 20.81% endpoint difference mean that one fifth of the county became developed?
No. Only 0.38% is listed as classified to developed. The total also includes 2.74% forest loss, 2.37% agricultural loss, and 14.62% other class difference, so it combines several kinds of endpoint classification change.
Sources and Reference Data
- MRLC Annual NLCD Data – official access point for Annual NLCD land-cover and comparison products
- USGS Annual NLCD Land Cover Classification – definitions for forest, shrubland, grassland, agriculture, wetlands, developed land, and other classes
- Camas County Comprehensive Plan 2024 – official county context for the Camas Prairie, northern mountains, Centennial Marsh, Camas Creek, and local land use
- Camas County Planning and Zoning – official planning, zoning, and comprehensive-plan resources
Camas County Map Files
Four original JPG maps cover 2025 land cover, forest and farmland, impervious surface and developed land, and 1985–2025 endpoint differences.
Camas County maps (ZIP)Related Maps
Green Map creates custom-edited map images using open geographic data sources such as geoBoundaries, Natural Earth, OpenStreetMap, and government open data. These maps are edited visual materials, not raw data files, and are provided for education, documents, presentations, and graphic reference.