Caribou County in southeastern Idaho is dominated by open shrubland and forest, while broad farm blocks stand out in the western and southwestern part of the county. This page brings together four views of the same county: 2025 land cover, forest and farmland, fractional impervious surface, and mapped class differences between 1985 and 2025. Reading them together makes it easier to separate the large natural areas from the agricultural valleys, small developed centers, wetlands, and water.
The maps can be viewed below, and the four original JPG files are available together in one ZIP from the file box later on the page. The set is useful when you need a printable county reference, a classroom comparison, a presentation graphic, or a starting point for a closer look at land-cover patterns without trying to force every kind of information into one map.
Table of Contents
Start with the county-wide pattern, not the city dots
The 2025 summary puts shrubland first at 46.76 percent of Caribou County. Forest accounts for 30.04 percent and agriculture for 15.29 percent, followed by wetlands at 3.61 percent and developed land at 1.97 percent. The forest-and-farmland view also reports water at 1.76 percent and grassland at 0.52 percent. Those numbers describe a county where open and wooded land far outweighs built-up surfaces, but the percentages become more meaningful when the map is used to see where each class occurs.
Forest is especially prominent across the eastern side and along other upland-looking margins. Large agricultural blocks occupy much of the west and southwest, where their regular shapes contrast with the less geometric shrub and forest patterns. Between those areas are broad expanses of shrubland, scattered wetlands, water bodies, and relatively small developed patches. The result is not a simple east-west split, but it is a clear enough contrast that a reader can quickly recognize several different landscape settings within one county boundary.
Soda Springs is the county seat, with Grace and Bancroft also serving as incorporated communities within Caribou County. Their presence helps provide a human reference for the small developed clusters visible on the maps. The county is not mapped as one continuous urban corridor. Instead, developed surfaces appear as compact nodes and thin road-related lines surrounded by much larger areas of rangeland, farmland, and forest.
The 2025 cover map shows where the major classes separate
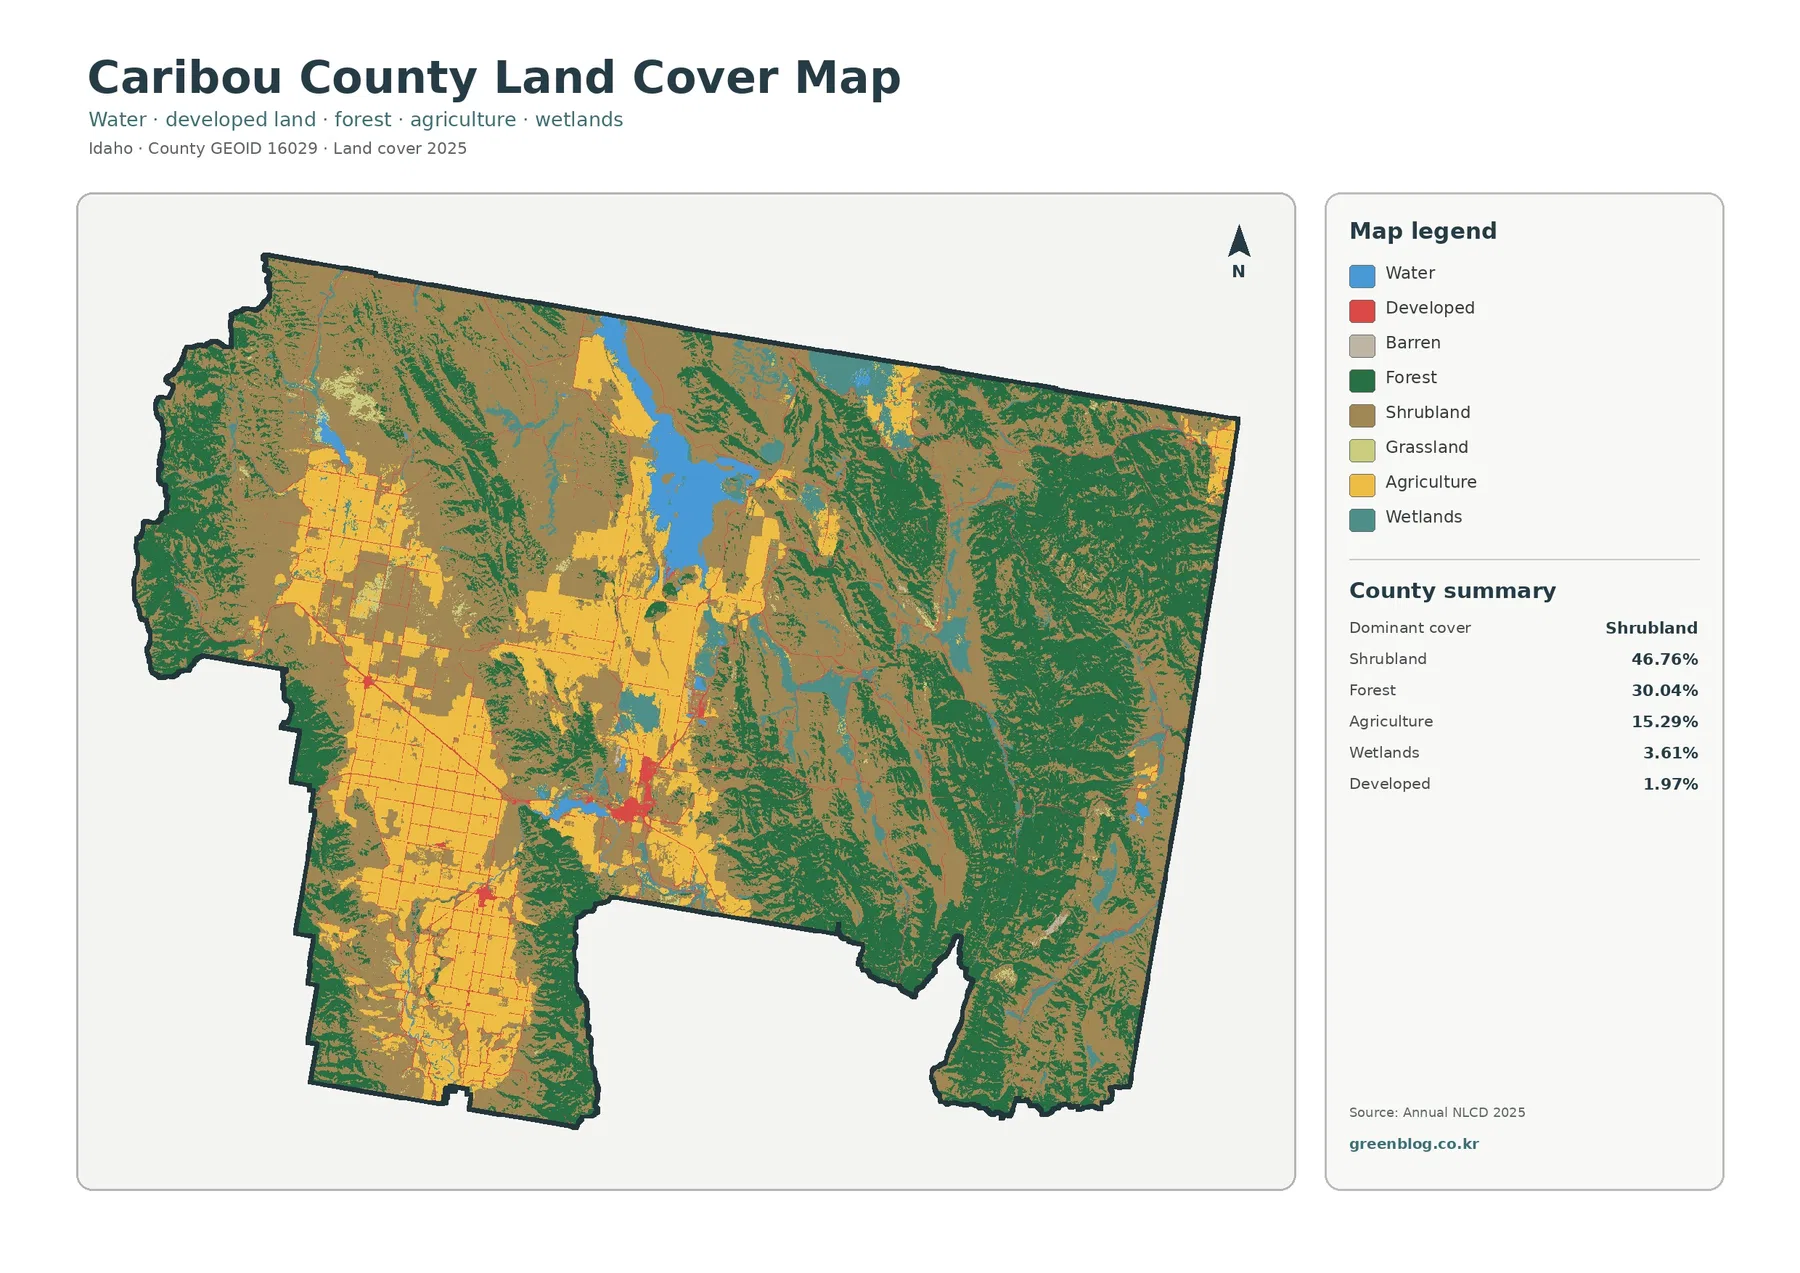
The general land-cover map is the best place to understand the county as a whole. Brown-toned shrubland covers much of the central and northern interior, dark green forest forms extensive areas to the east, and yellow agricultural land makes broad blocks in the west and southwest. Red developed patches are small by comparison. Rather than treating those colors as isolated categories, it is useful to look at their boundaries: farmland often meets shrub or grass cover abruptly, while forest edges are more irregular and follow the shape of the surrounding terrain.
Blue water is conspicuous in the north-central part of the county map as well as in smaller features elsewhere. Idaho Fish and Game identifies Blackfoot Reservoir as a large water body spanning Bingham and Caribou counties and flowing into the Blackfoot River. That official reference helps explain why water deserves attention even though it occupies a modest share of the county. The land-cover map itself is not a hydrography map, however, so it should be used to compare water with surrounding cover rather than to identify every stream or reservoir boundary by name.
Wetlands make up 3.61 percent in the supplied summary and appear as narrower patches associated with low-lying and water-adjacent areas. A wetland color next to open water does not mean that every mapped cell has the same hydrology on the ground. Land cover is a classification of surface condition derived from remote sensing and related data. It does not establish wetland jurisdiction, water rights, parcel boundaries, or legal land use.
Why the forest-and-farmland view is easier to read
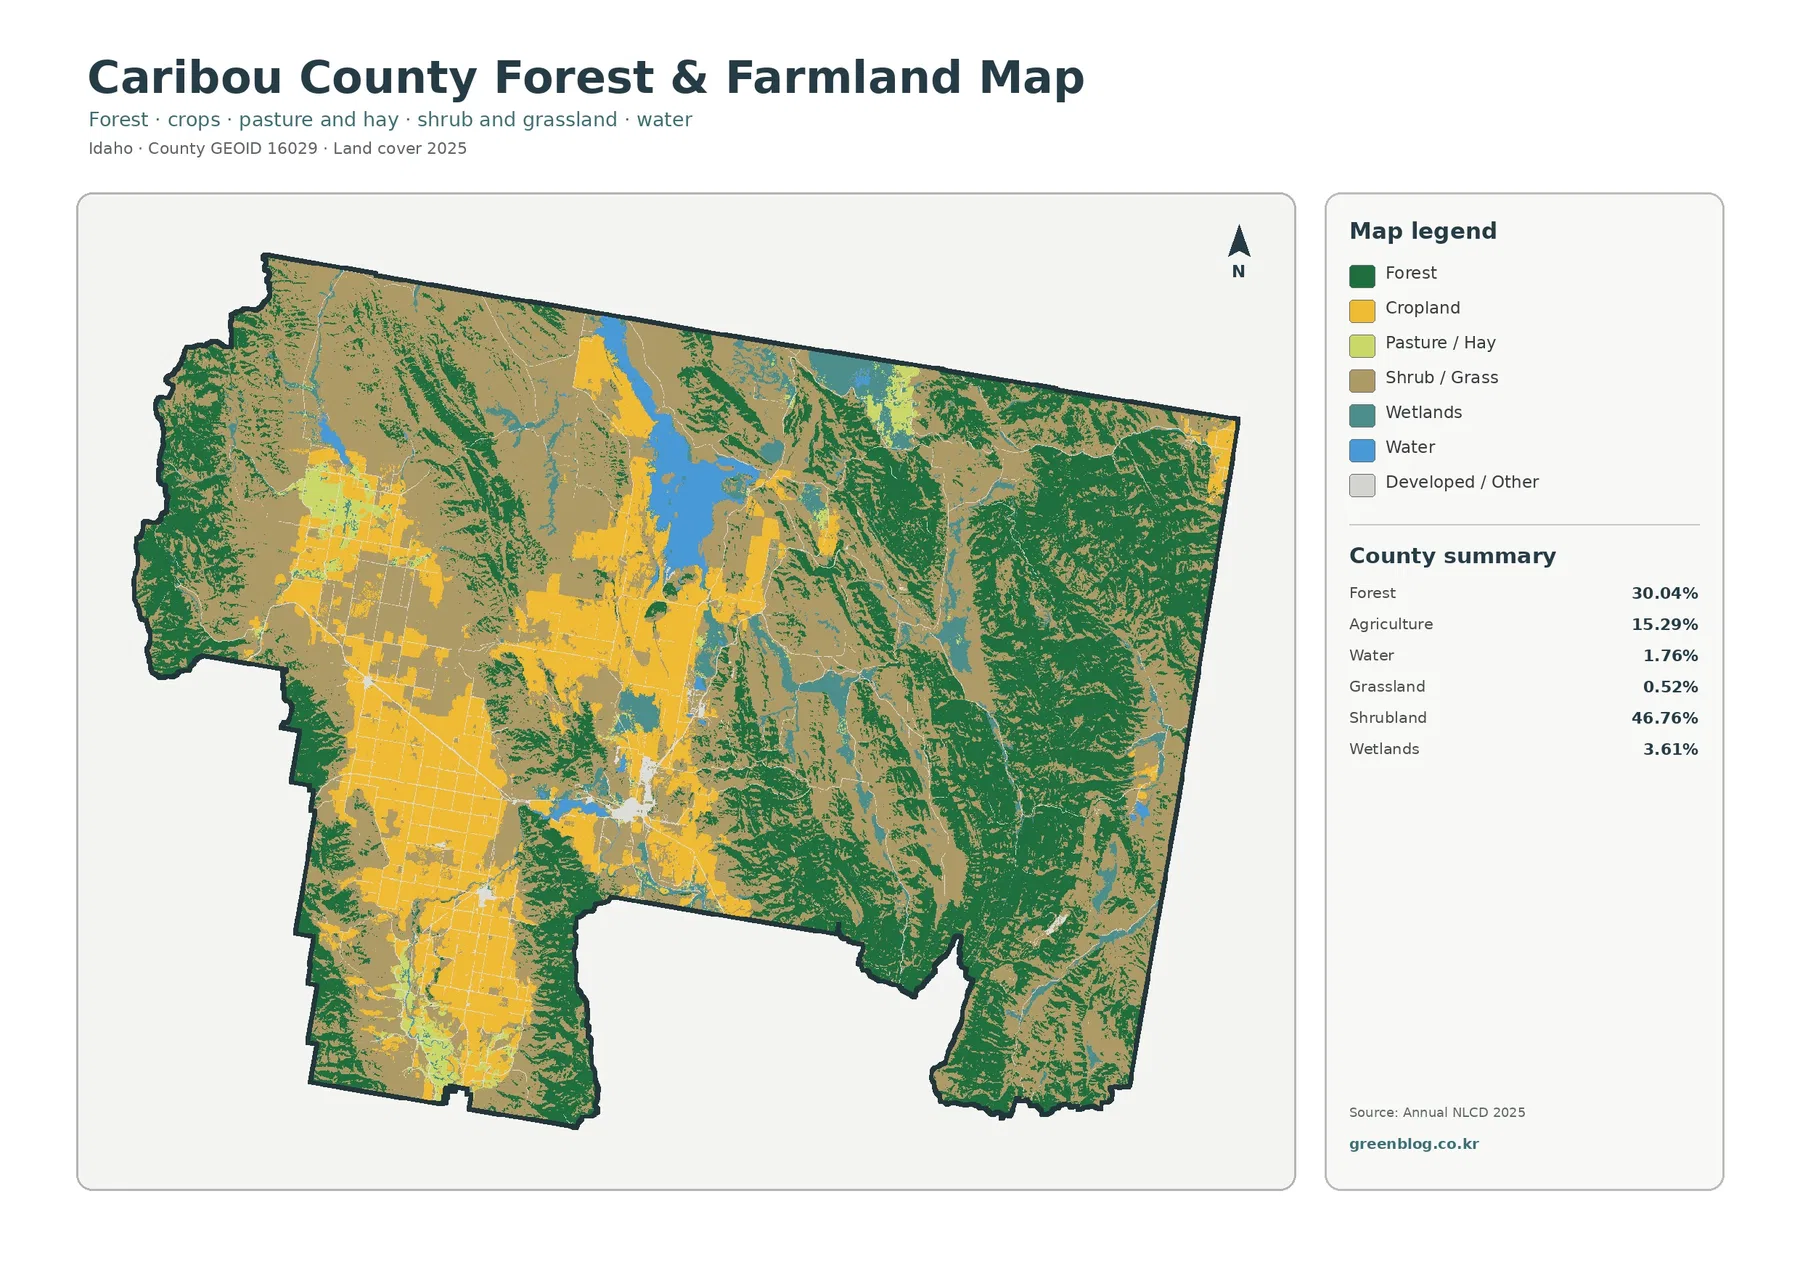
When the goal is to compare working agricultural land with wooded and open natural cover, the second map removes some of the visual complexity. Forest remains concentrated across the east, while cropland forms recognizable blocks through the western and southwestern portions of the county. Pasture and hay occur within and around the broader agricultural pattern, and shrub or grass cover fills much of the area between farm districts and forested uplands.
Agriculture represents 15.29 percent of the county in the supplied 2025 summary. That share is smaller than either shrubland or forest, yet the agricultural areas are highly visible because they form large, regular shapes. Their arrangement is useful for distinguishing the more open valley and basin settings from the irregular wooded slopes. It also shows why a county-wide percentage alone can be misleading: a class can occupy a minority of the county while still defining the appearance of a large local district.
The Caribou Soil Conservation District describes a county economy and resource base with strong ties to agriculture and natural resources. That background fits the broad agricultural and rangeland patterns visible here, but it should not be confused with a land-ownership map. A green forest cell is not automatically National Forest land, and a yellow cropland cell does not establish agricultural zoning or private ownership. Land cover answers a different question: what kind of surface cover was classified at that location for the mapped year?
The USDA Forest Service notes that Caribou-Targhee National Forest includes land in Caribou County along with several neighboring counties. The large forested areas on the eastern side of the land-cover maps therefore fit a broader regional setting of wooded mountain country. Still, anyone who needs the exact boundary of National Forest land should use Forest Service management maps. The supplied maps show vegetation and surface cover, not agency boundaries.
A low county average still leaves visible developed centers
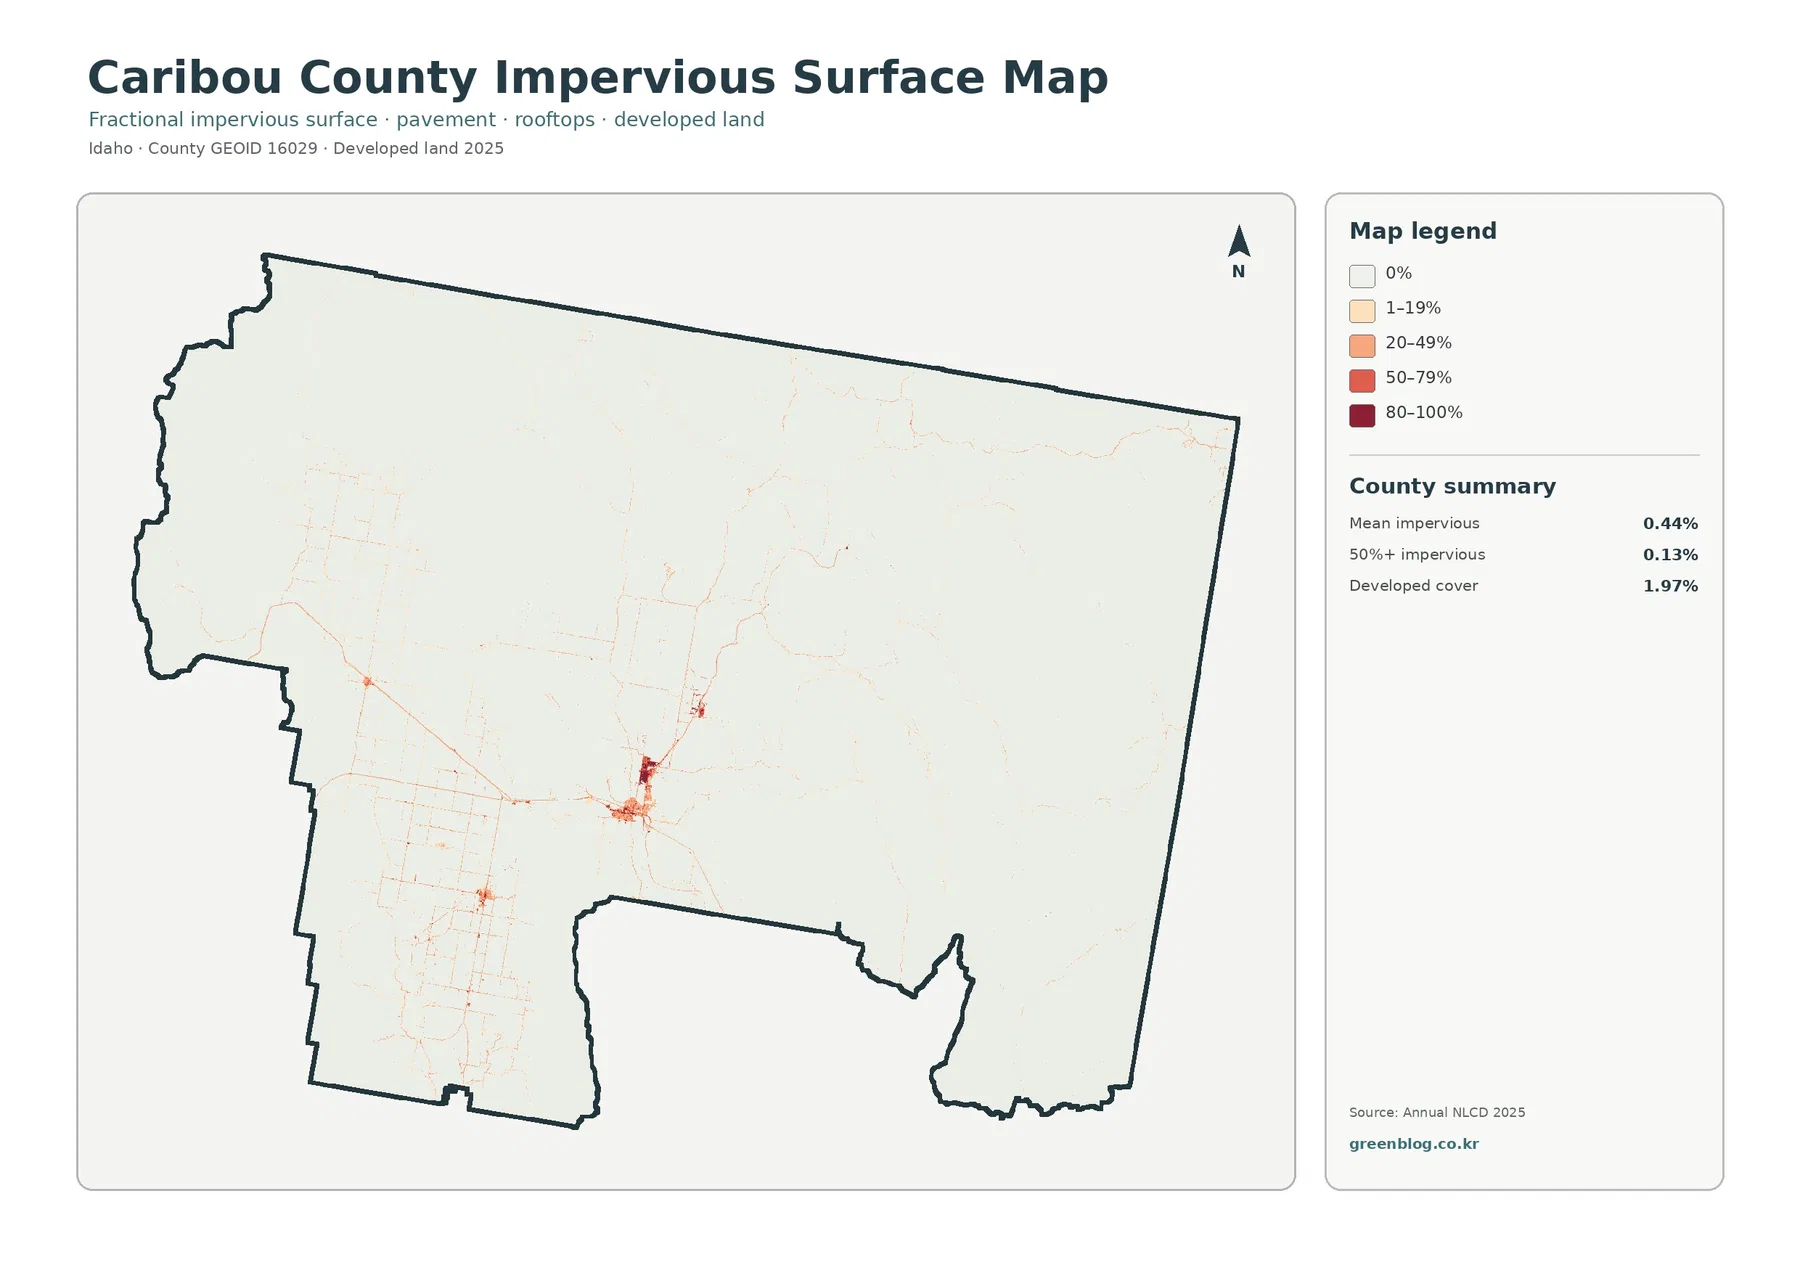
Impervious surface means processed or built material such as pavement, concrete, and rooftops that does not absorb water like soil or vegetation. The county-wide mean shown here is just 0.44 percent, while cells at 50 percent impervious or greater cover 0.13 percent. Those numbers are consistent with the general land-cover map, where developed land accounts for 1.97 percent and most of the county remains shrubland, forest, farmland, wetland, or water.
The impervious map is intentionally pale across most of Caribou County. Against that light background, a stronger cluster appears in the central-southern part of the county, with smaller nodes and thin lines extending through the western and southwestern road grid. These are the places where built surfaces are easiest to see. Soda Springs, Grace, and Bancroft provide useful settlement references, but the map should not be read as a street map or as a complete inventory of individual buildings.
This view also helps separate two ideas that can look similar on a simple land-cover legend. “Developed” is a land-cover class that can include built areas with vegetation mixed in, while fractional impervious surface estimates how much of a 30-meter pixel is covered by hard or constructed surfaces. A residential block with yards can therefore be developed without being close to 100 percent impervious. Comparing the two maps is more informative than assuming every developed pixel has the same amount of pavement.
The 1985–2025 layer marks class differences, not a single growth rate
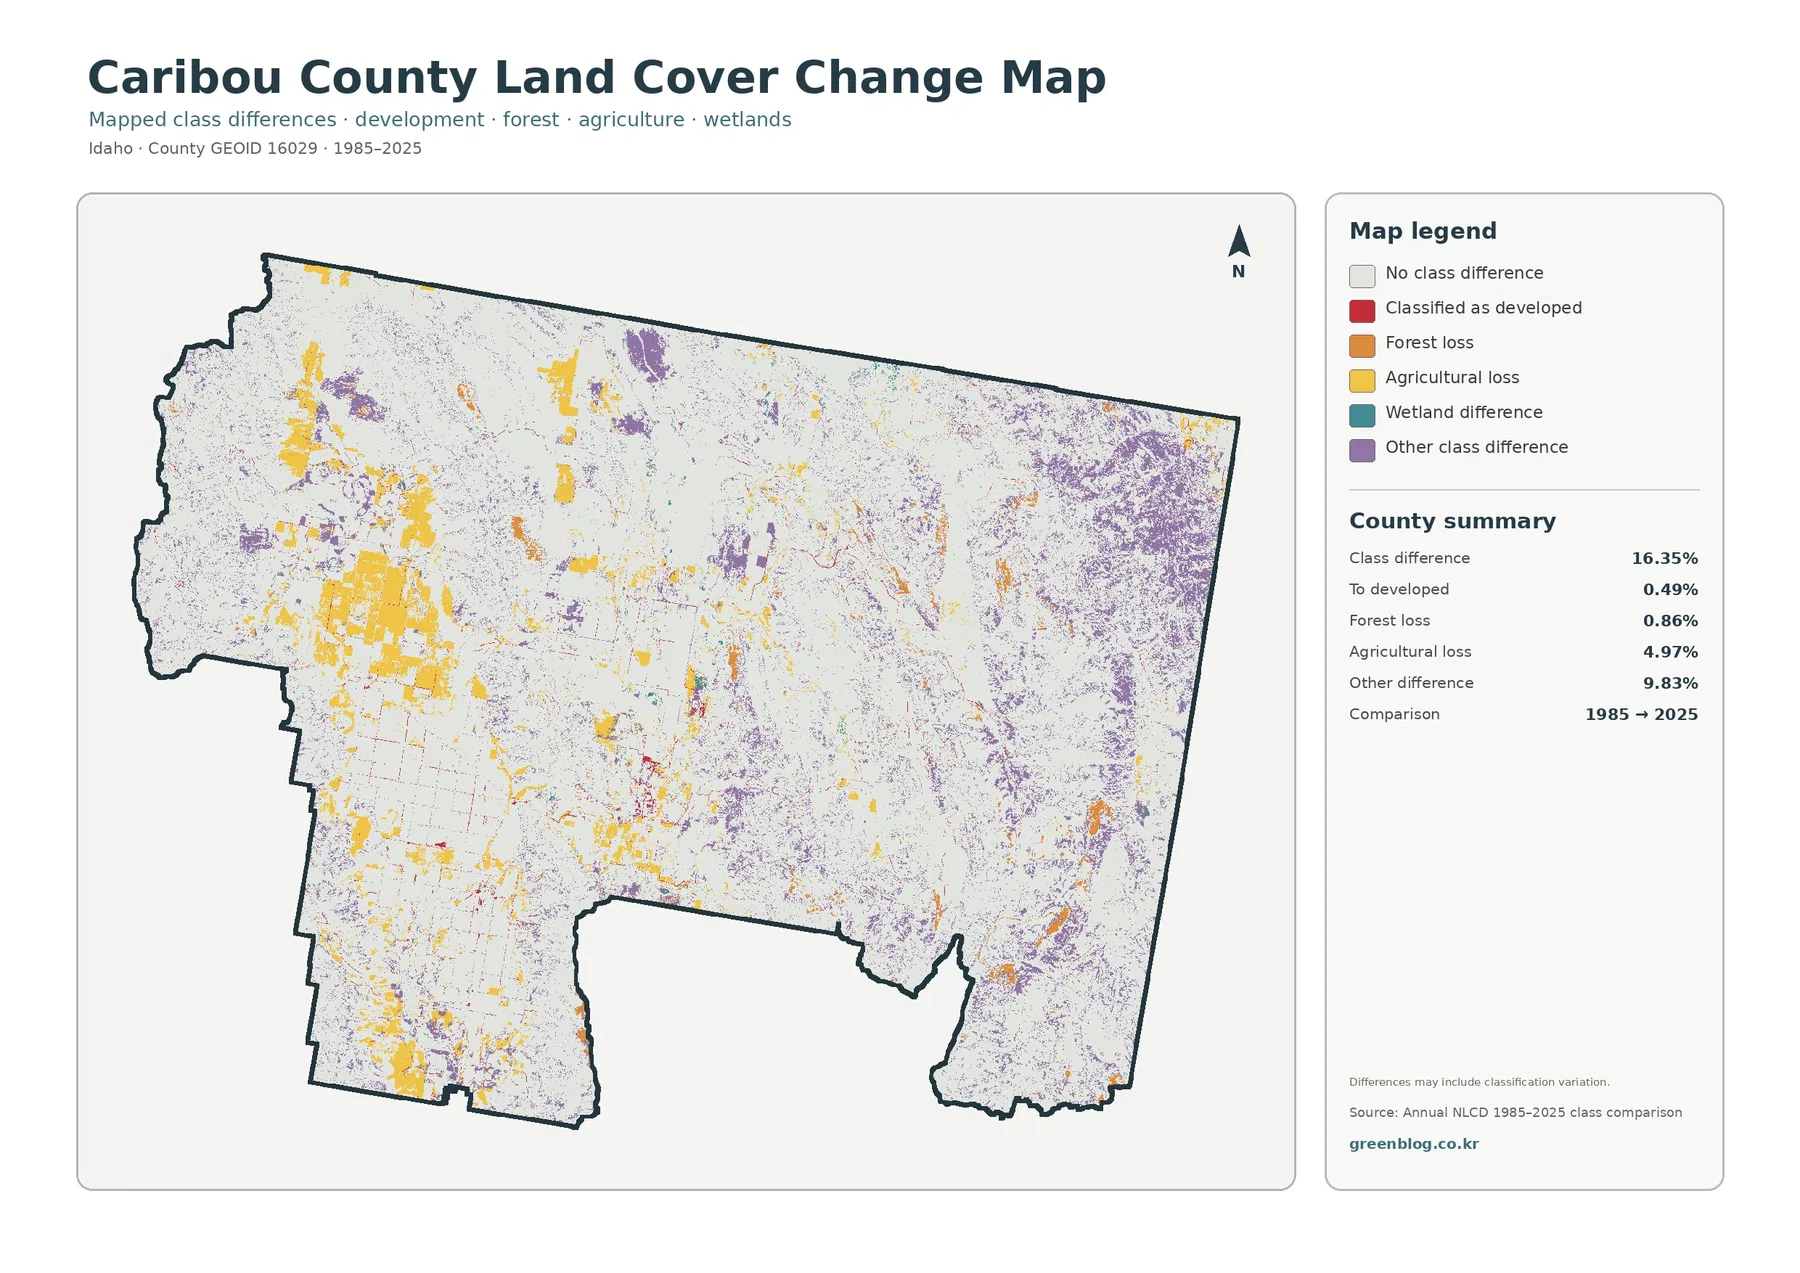
The change map needs more caution than the other three. Its headline value is a 16.35 percent class difference between the 1985 and 2025 comparison years. That does not mean 16.35 percent of Caribou County was converted by development or permanently altered by one process. The map itself warns that differences can include classification variation, so the safest use is to locate cells that received different labels at the two endpoints and then investigate those places in more detail.
The supplied summary separates some of those differences into 0.49 percent classified to developed, 0.86 percent forest loss, 4.97 percent agricultural loss, and 9.83 percent other difference. Agricultural-loss colors are especially noticeable across parts of the western farm pattern, while forest-loss and other-difference colors are scattered through the more wooded east and other upland areas. The developed-change category occupies far less space, appearing mainly as small patches and narrow features near existing settlement and transportation patterns.
A color labeled forest loss does not tell you why the classification changed. Fire, timber activity, vegetation recovery, disturbance, mixed pixels, imagery conditions, and classification behavior can all require separate evidence before a cause is assigned. The same caution applies to agricultural loss. A cell that is classified differently in 2025 may reflect a long-term land-cover conversion, a different crop or grass condition, or a classification boundary that shifted between products. The map is a screening tool, not a final history of each parcel.
Choose the map by the question you need to answer
For a quick county overview, the 2025 land-cover map gives the strongest balance of detail and context. It is the clearest choice when you want to explain why shrubland and forest dominate the county while agriculture forms large western blocks. The forest-and-farmland version is better when the main question is how cropland, pasture or hay, shrub and grass, and forest sit next to one another. Because it simplifies the legend, it works well for lessons or presentations focused on rural land patterns.
The impervious map is the better choice for a discussion centered on settlement, roads, rooftops, or runoff-related surface cover. Since the county average is very low, the few stronger lines and clusters become easy to isolate when the image is viewed at full size. The change map serves a different purpose: it helps identify where the 1985 and 2025 classifications disagree. It is most useful when paired with one of the 2025 maps so the current cover around a change location can be understood.
For printing, it is usually better to select the map that matches the task instead of squeezing all four onto one page. The full land-cover image benefits from color because it contains the largest number of classes. The forest-and-farmland view is easier to explain to an audience that only needs the major rural classes. The impervious map contains many very light cells, so opening the original JPG and zooming in is helpful when the road grid and compact developed nodes are the subject.
Scale, classification, and other reading limits
The supplied 2025 maps are based on the Annual NLCD family of products. USGS documentation describes Annual NLCD as a 30-meter raster dataset, meaning the landscape is divided into grid cells and each cell receives mapped information at that scale. A 30-meter cell can contain more than one real-world surface, so edges between a road, field, wetland, and forest may look simpler on the map than they do on the ground. Small features can also be generalized or absorbed into a neighboring class.
County percentages are therefore best used for broad comparison rather than parcel-level decisions. A shrubland share of 46.76 percent and a forest share of 30.04 percent describe the composition of the mapped county, but they do not determine ownership, zoning, development rights, grazing rights, or agricultural status for a specific property. For those questions, official county records, agency management maps, surveys, and current site information are the appropriate sources.
Time matters as well. A 2025 land-cover layer represents the mapped condition for that product year; changes made after the observation and processing period will not automatically appear. The 1985–2025 comparison also reduces a long period to two endpoints. If a project depends on recent construction, a recent fire, a new field boundary, or a short-term wetland condition, use these maps as context and confirm the present situation with newer imagery or local data.
Frequently Asked Questions
What is the largest land-cover class in Caribou County?
Shrubland is the largest class in the supplied 2025 summary at 46.76 percent. Forest follows at 30.04 percent and agriculture at 15.29 percent. On the map, shrubland occupies much of the central and northern interior, forest is especially strong in the east, and agriculture forms large blocks in the west and southwest.
Why does the developed-land percentage differ from the impervious percentage?
Developed land is a land-cover class, while fractional impervious surface estimates how much of each mapped pixel is covered by hard surfaces such as pavement and rooftops. A developed area can still contain yards, bare ground, or vegetation. That is why the county can have 1.97 percent developed cover while the mean impervious value is only 0.44 percent.
Does the 16.35% class difference mean that much of the county was permanently converted?
No. The map compares class labels at the 1985 and 2025 endpoints, and the supplied legend warns that the difference can include classification variation. The change layer is useful for finding locations to investigate, but a cause or permanent conversion should be confirmed with additional annual data, imagery, or local records.
Map File Information
The ZIP contains the four original JPG map files prepared for Caribou County.
- Included Versions: land cover, forest and farmland, impervious/developed land, and land-cover change
- File Type: ZIP containing four JPG files
- Intended Use: printing, county comparison, classroom reference, and presentations
Related Maps
Sources and References
- MRLC Annual NLCD Data – official access to Annual NLCD land-cover and change products
- USGS Annual NLCD Collection 1.2 Land Cover – 2025 availability and 30-meter product documentation
- Caribou Soil Conservation District FY26 Plan – county-specific agriculture and natural-resource context
- U.S. Census Bureau TIGER/Line Shapefiles – county boundary reference
Green Map creates custom-edited map images using open geographic data sources such as geoBoundaries, Natural Earth, OpenStreetMap, and government open data. These maps are edited visual materials, not raw data files, and are provided for education, documents, presentations, and graphic reference.