Agriculture is the defining surface pattern in Orleans County in the 2025 land-cover summary, accounting for 58.17% of the mapped area. The county is not a single uninterrupted farm landscape, however. Wetlands make up 16.98%, forest 14.16%, developed land 9.79%, and water 0.67%, creating clear contrasts between broad fields, wet southern areas, wooded patches, and the county’s compact village centers.
This page brings together four views of the same county: current land cover, forest and farmland, impervious/developed surfaces, and mapped class differences from 1985 to 2025. The four original JPG maps are available in one ZIP download, making it easy to compare them side by side or use a single view in a report, classroom handout, presentation, or regional reference project.
Table of Contents
A county of fields, canal villages, and wet southern landscapes
Orleans County lies in western New York along the south shore of Lake Ontario, between the Buffalo and Rochester regions. New York State identifies Albion as the county seat and notes that the Erie Canal crosses the county from east to west. That geography matters when reading the maps because the largest developed clusters appear near the long-established canal villages of Medina, Albion, and Holley, while agricultural cover fills much of the land between them.
The dominant agricultural share does not mean that every part of the county has the same appearance. Large yellow blocks cover much of the northern and central map, yet wetlands form extensive teal areas near the southern edge and in several eastern sections. Forest becomes more prominent in parts of the east and south, while developed cover is concentrated into relatively small hubs rather than spread at the same intensity across the county.
Local agricultural programs also help explain why a simple “farm county” label is too broad. Cornell Cooperative Extension Orleans County lists regional support for Lake Ontario fruit, dairy and field crops, and vegetable production. This countywide classification does not identify apples, vegetables, pasture fields, or individual crop types. Local context confirms that the large agricultural class represents a working landscape with more variety than one color can show.
Impervious surfaces reveal how compact the developed footprint really is
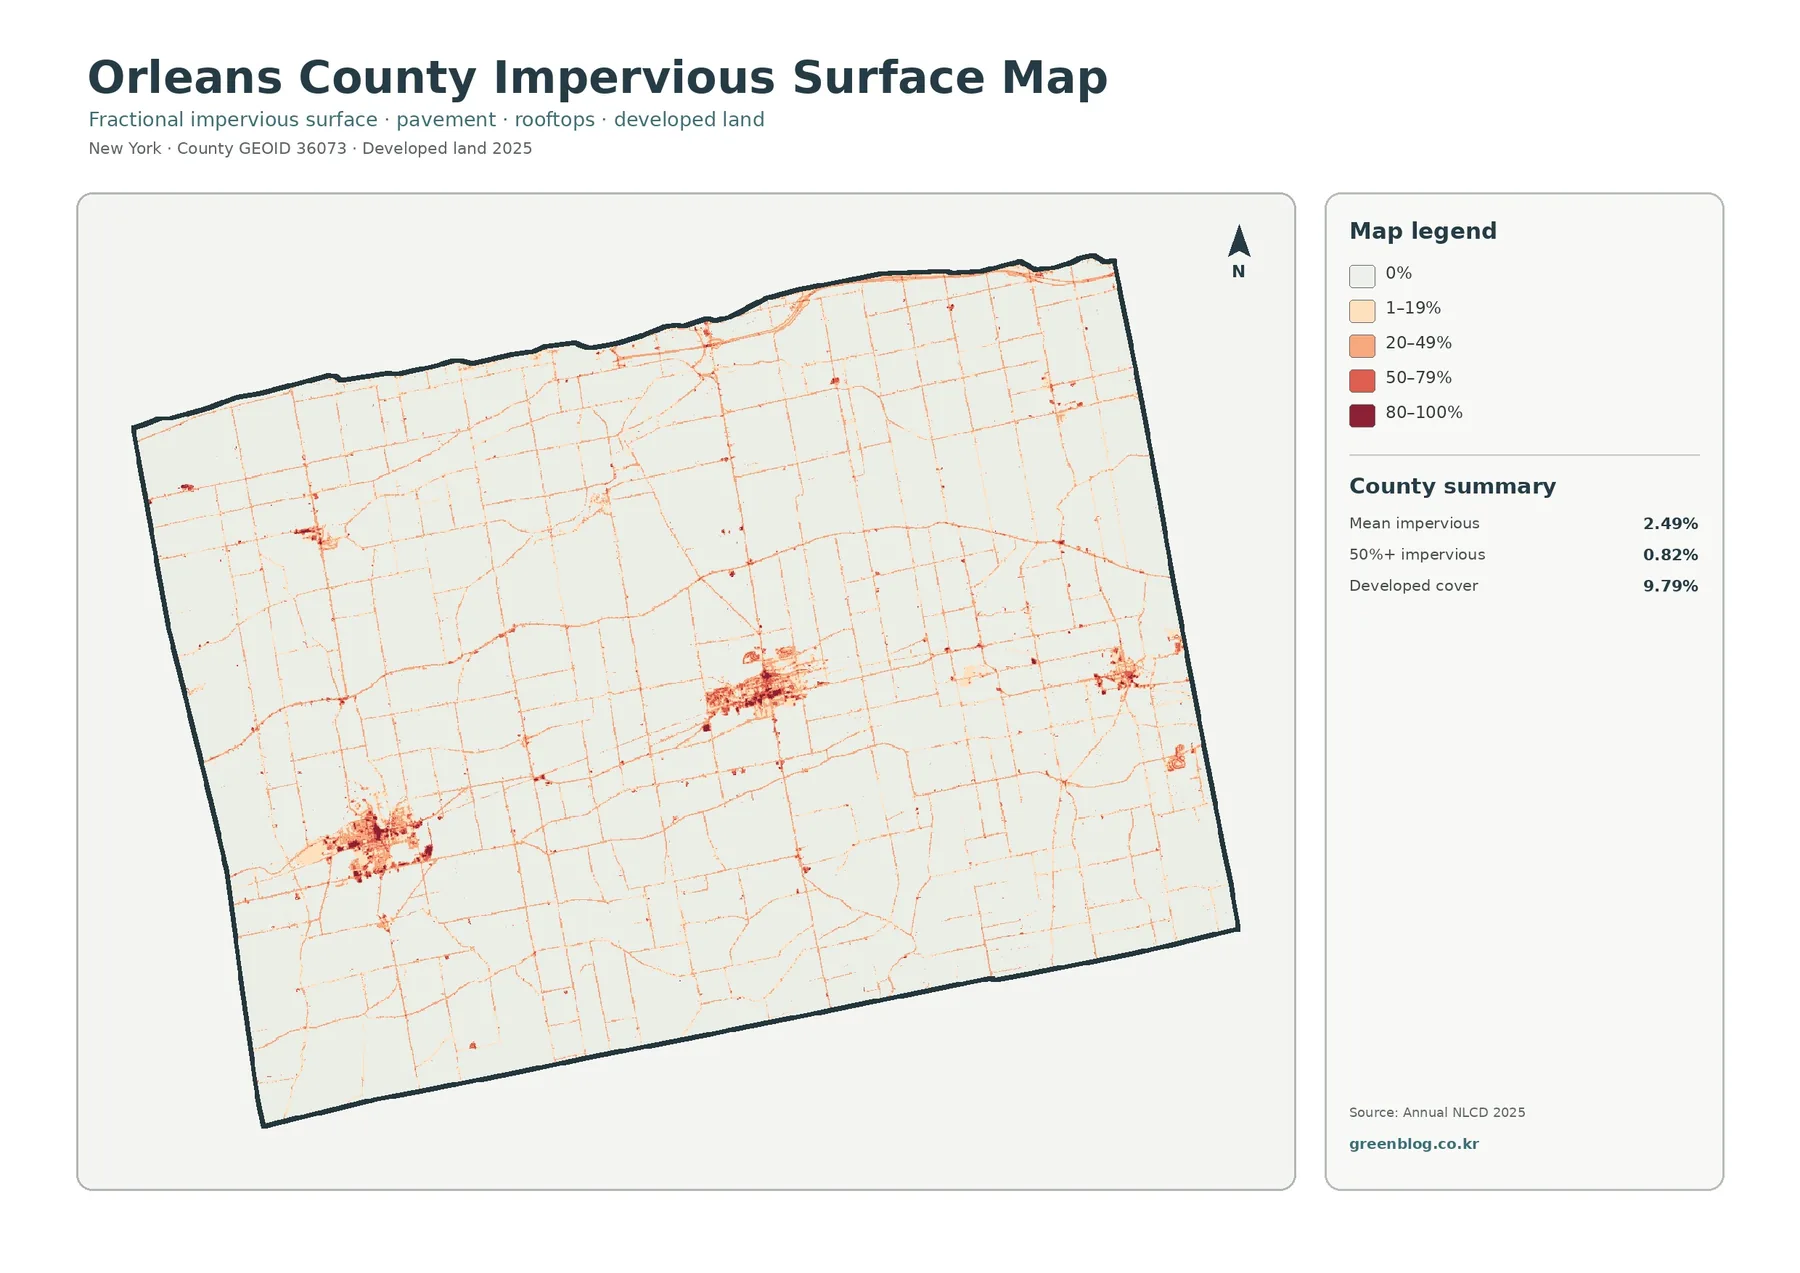
Mean impervious surface is only 2.49% across Orleans County, and just 0.82% of the county is mapped at 50% impervious or higher. Those values are much lower than the 9.79% developed-land share. The difference is expected because a developed land-cover class can include lawns, trees, gardens, and other permeable ground around homes, businesses, institutions, and roads, while the impervious layer measures the harder surfaces themselves.
The darkest concentrations are easy to pick out around the western, central, and eastern village clusters. Medina, Albion, and Holley stand out from the surrounding farm landscape, with thinner linear traces extending away from the denser cores. These lines can indicate places where roads and other built surfaces are close together. The impervious layer is not a transportation map, so a separate reference layer is needed to identify a road by name.
Reading imperviousness beside the general land-cover map answers two separate questions. Current land cover shows where developed classes occur, while the impervious layer shows how much of each cell is occupied by surfaces such as pavement and rooftops. A low-density residential area can therefore be developed without appearing as a very dark impervious cluster, whereas a small commercial center or tightly built village block can show a much stronger hard-surface signal.
This distinction is useful in watershed education and planning discussions, but it should not be stretched into a flood-risk conclusion. A higher impervious percentage generally means less exposed ground is available for infiltration, yet flooding also depends on rainfall, slope, soil, drainage infrastructure, stream capacity, and many other conditions. For watershed use, this layer provides surface context rather than a complete stormwater or hazard model.
The forest-and-farmland view makes the county’s rural pattern easier to separate
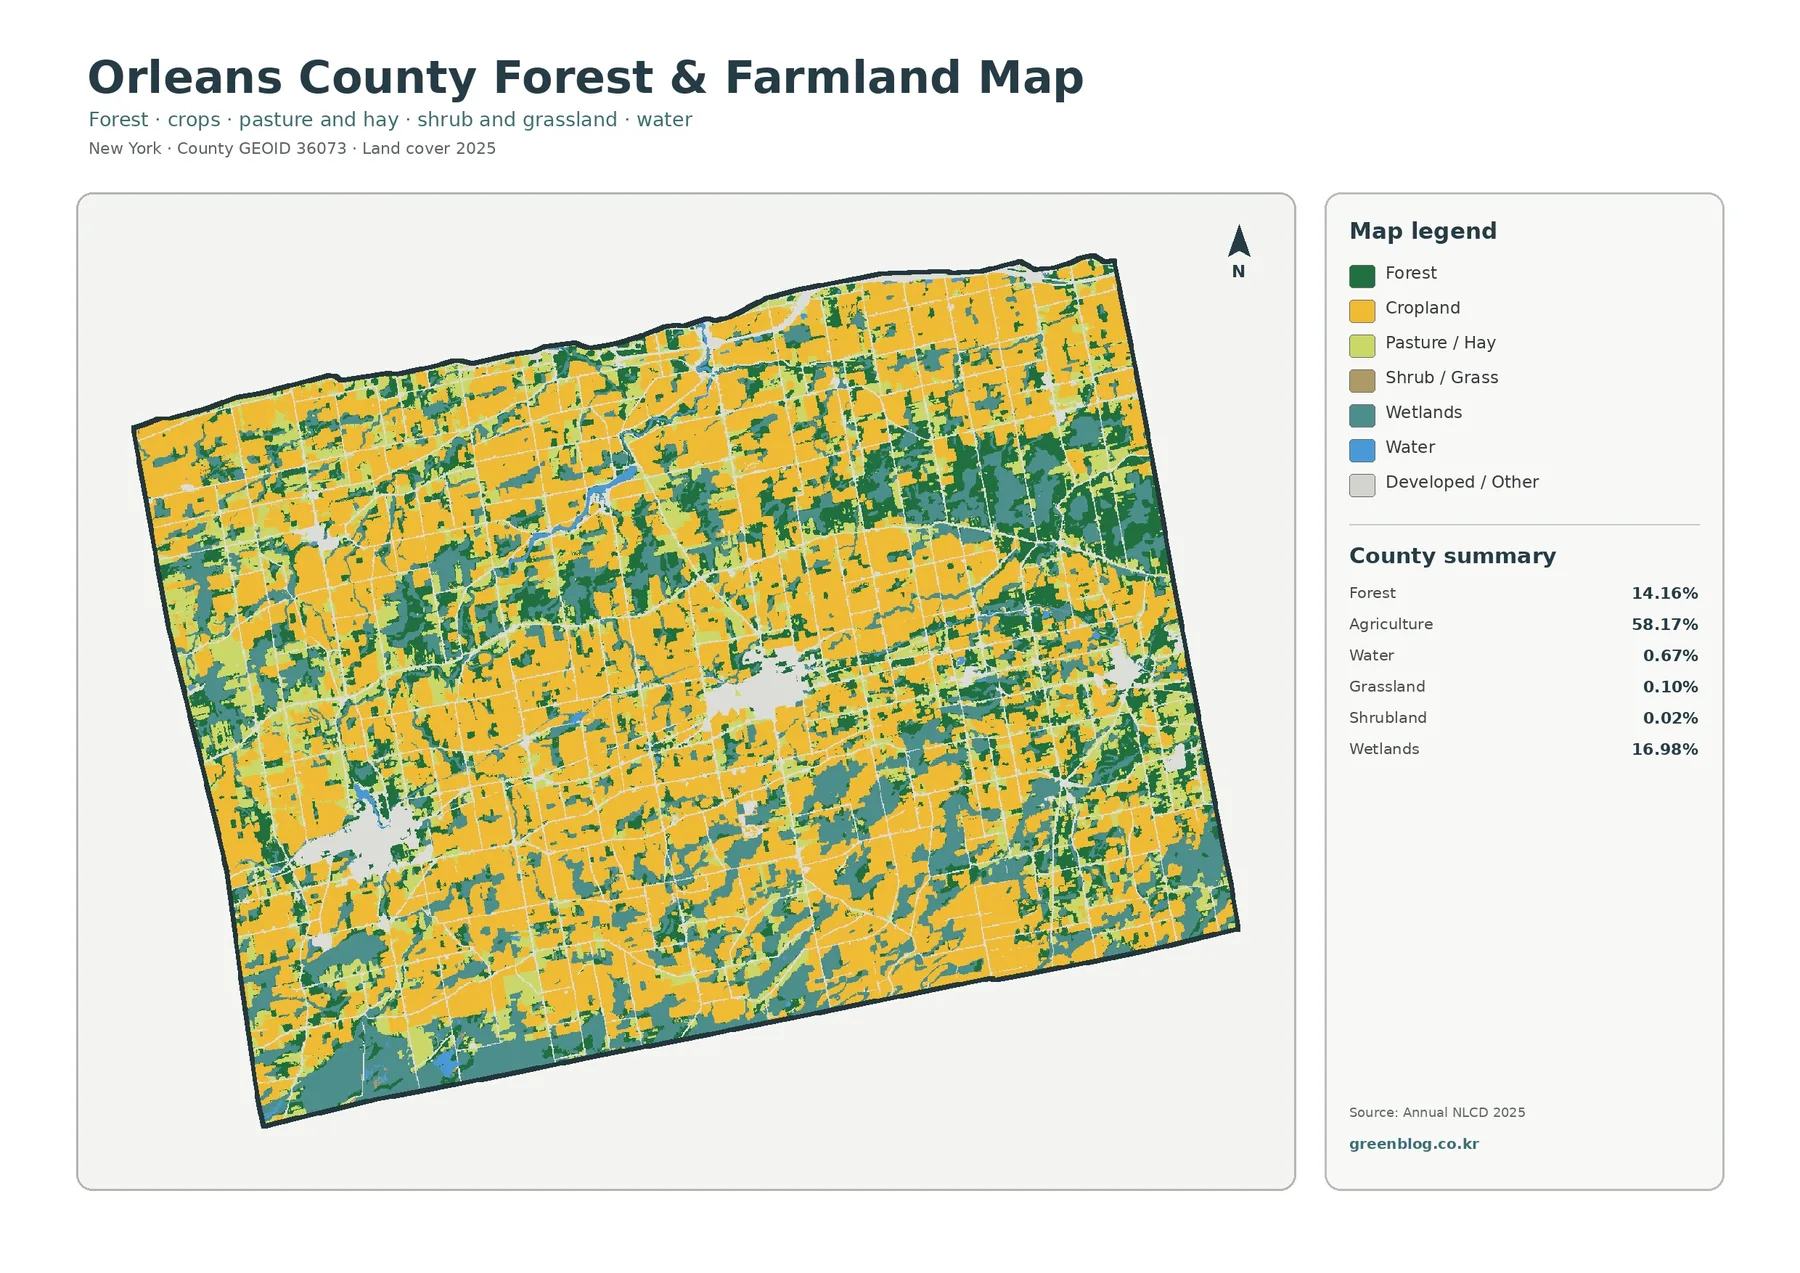
Once developed and miscellaneous classes are muted, the dominance of agriculture becomes even more obvious. Agriculture remains 58.17% of the county, compared with 14.16% forest and 16.98% wetlands. Grassland is only 0.10% and shrubland 0.02%. The more useful comparison is between the broad farm matrix and the larger wooded or wet areas that interrupt it.
Farmland spreads across most of the county in large blocks, but it is repeatedly broken by green forest patches and teal wetlands. The eastern half includes several larger wooded areas, while the southern edge contains some of the most conspicuous wetland cover. This pattern gives the county a mosaic structure at map scale: agriculture is the main surface, yet sizable natural-cover areas remain embedded within and beside it.
New York State’s Department of Environmental Conservation provides useful context for the southern wetland pattern. Oak Orchard and Tonawanda Wildlife Management Areas are part of a roughly 19,000-acre state and federal habitat complex. DEC describes those management areas as primarily wetland with additional upland forest, shrubland, and grassland. Oak Orchard WMA includes land in the Orleans County towns of Barre and Shelby.
That official description helps explain why wetlands are not a minor class in the countywide summary. NLCD colors must not be treated as the legal boundaries of a wildlife management area or regulated wetland. Land cover describes the mapped surface. Management ownership, regulatory jurisdiction, conservation easements, and parcel lines come from different datasets and may cut across the land-cover classes in very different ways.
The same caution applies to agriculture. A yellow cell does not establish that a parcel is enrolled in an agricultural district, protected by a farmland easement, or currently planted with a particular crop. For farm-specific research, use the land-cover map as a countywide overview and then move to agricultural district, parcel, soils, or recent imagery data for the details.
The full 2025 land-cover map brings wetlands, villages, and fields back together
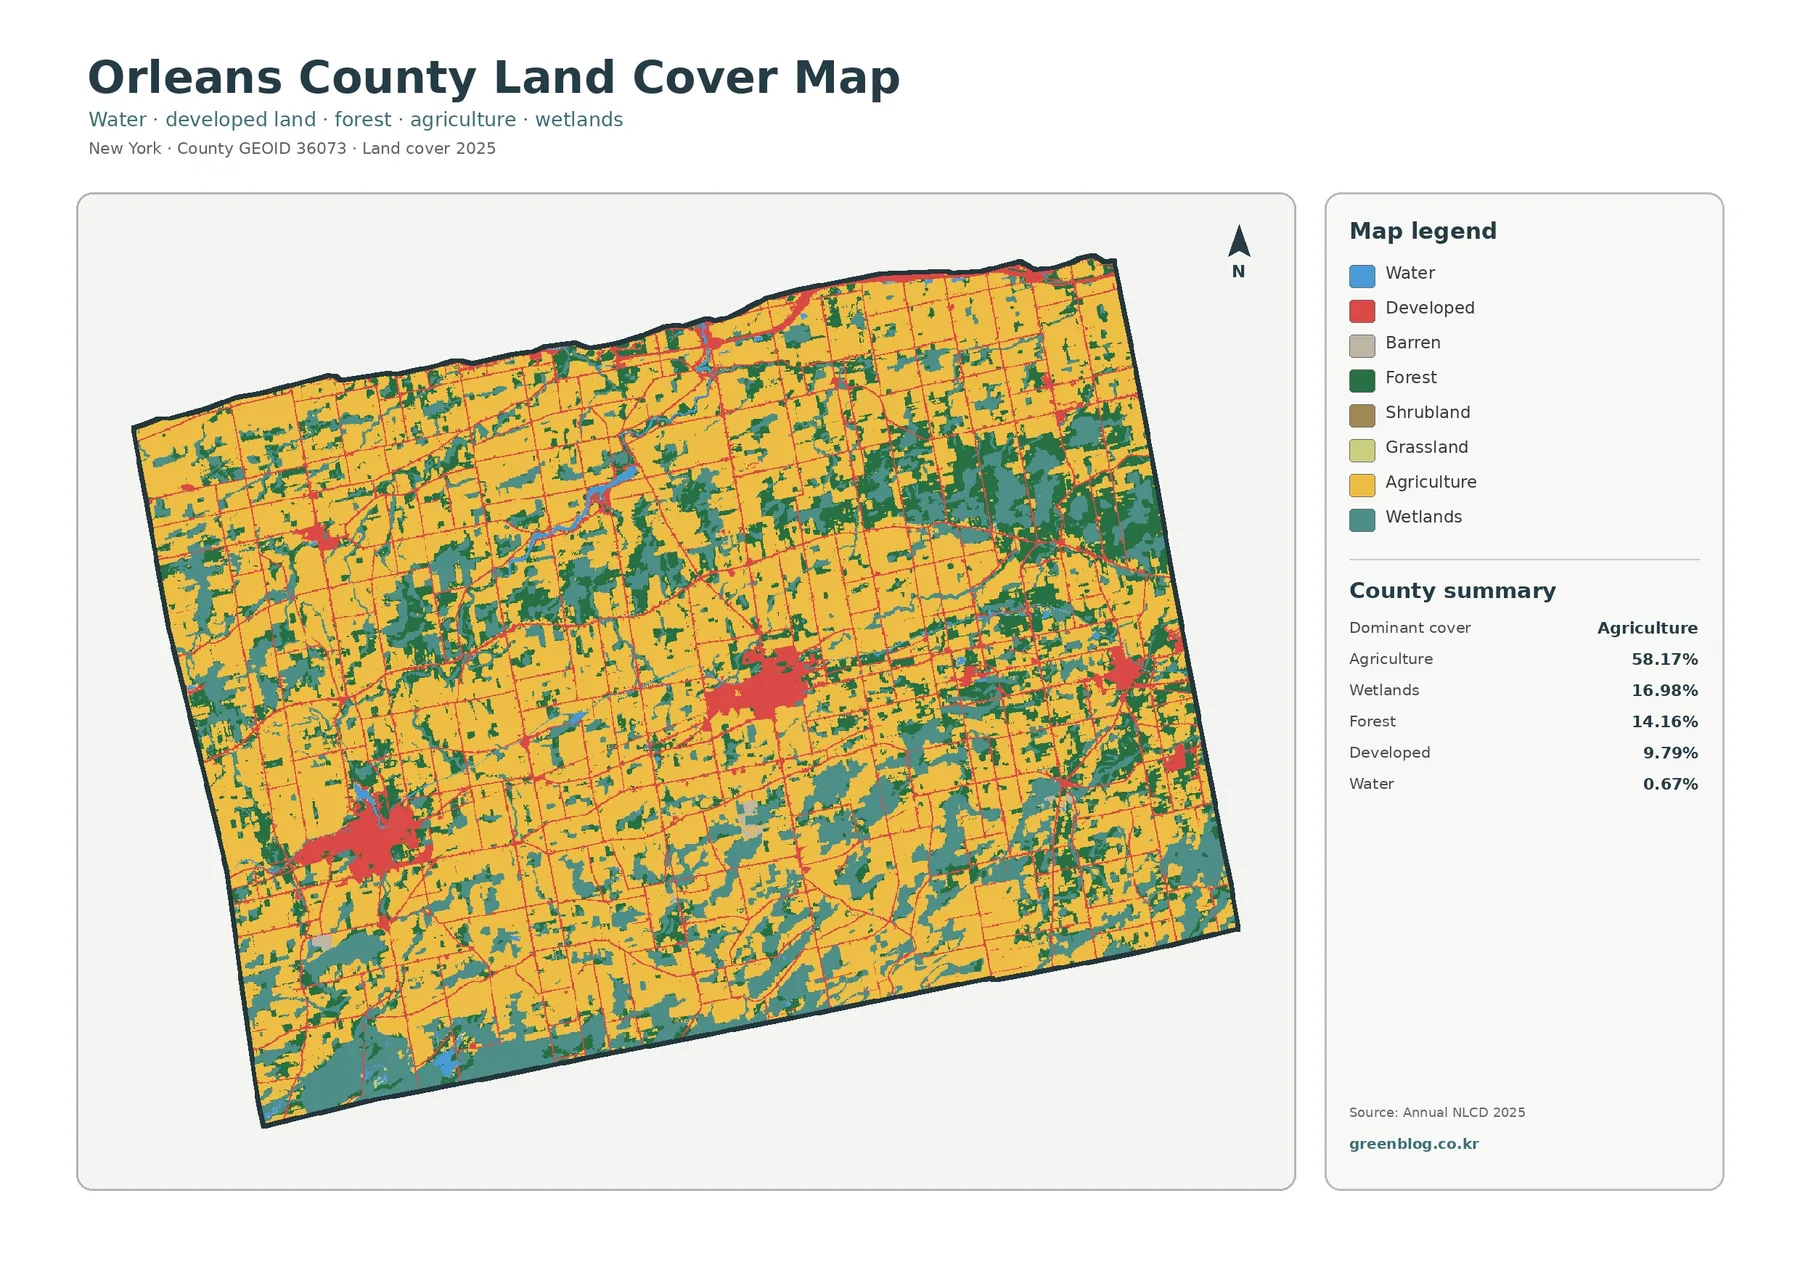
The general map is the best place to see how the major classes meet. Yellow agriculture forms the background across much of Orleans County, while developed areas appear as red clusters and narrow connections. Forest is less extensive than either agriculture or wetlands by percentage, but several green blocks are large enough to shape the eastern and southern parts of the map. Teal wetlands often sit along the edges of farmland and wooded areas rather than forming one isolated zone.
Water accounts for 0.67% of the mapped county summary. Orleans County’s northern boundary meets Lake Ontario, but the county land-cover total should not be interpreted as including the whole lake outside the county land polygon. Within the mapped area, blue water cells mark open-water surfaces, while the much larger wetland class captures a different type of water-influenced environment.
Developed cover at 9.79% is large enough to be visible yet small enough that the agricultural setting remains dominant. The three main village areas are especially clear because their red clusters contrast strongly with adjacent fields. Smaller developed traces also extend through the rural landscape, reminding the reader that settlement, roads, farms, and natural cover are interwoven rather than separated into perfectly distinct regions.
Barren land, shrubland, and grassland are present in the legend but do not control the overall visual character. For a first reading, it is more effective to compare agriculture, wetlands, forest, and developed land. The minor classes can then be checked when a project needs more detail, particularly around field margins or places where the broader categories meet.
A 13.67% class difference does not equal a 13.67% confirmed land-use conversion
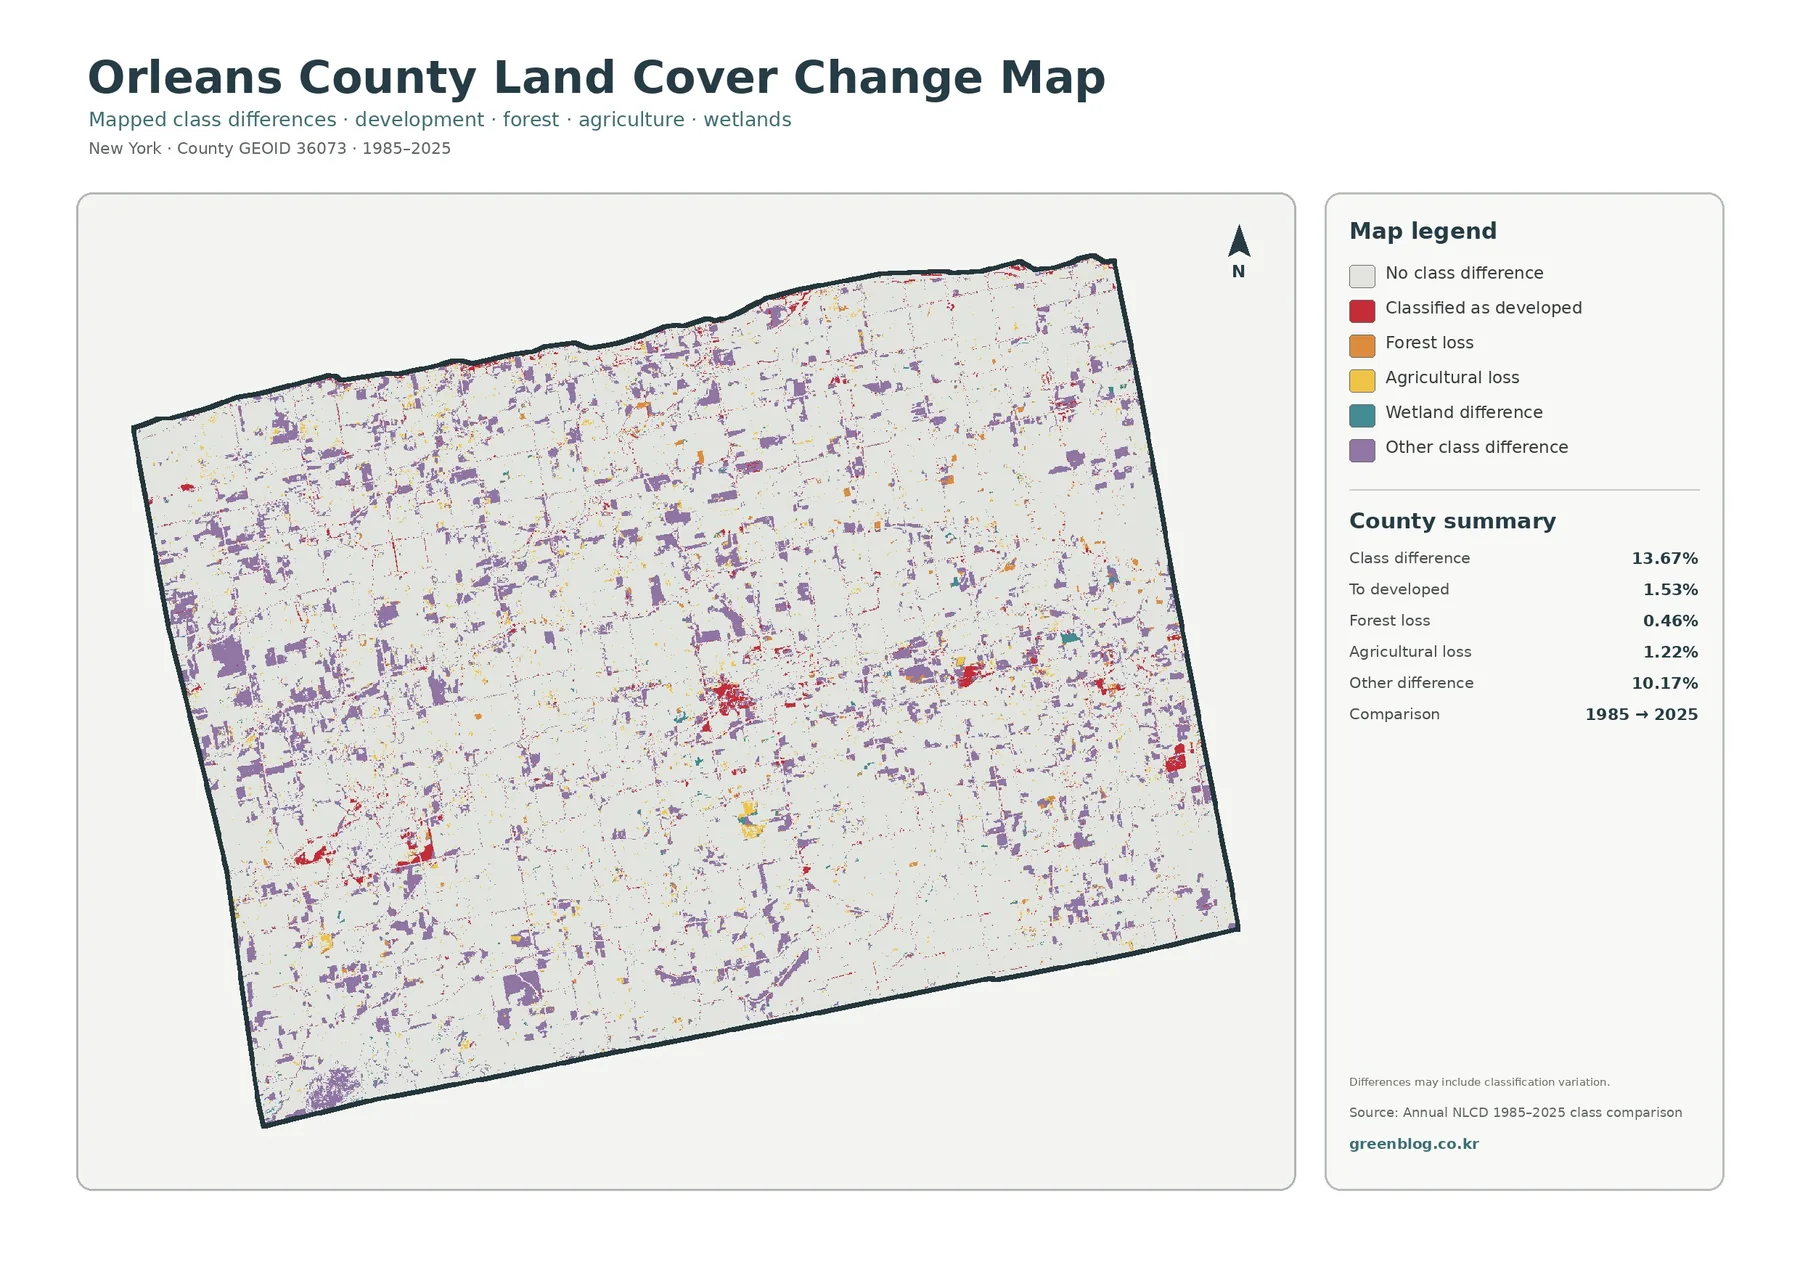
The 1985–2025 comparison reports a class difference across 13.67% of Orleans County. The summary identifies 1.53% as cells classified to developed, 0.46% as forest loss, 1.22% as agricultural loss, and 10.17% as other class differences. Most of the map remains in the light “no class difference” category, so the long-term comparison is better read as scattered change against a broadly stable background than as countywide replacement.
Red development-related differences appear near several current settlement clusters and along portions of the county’s east–west developed pattern. Agricultural-loss and forest-loss colors are more dispersed, while the large “other difference” category appears in many small patches. Looking at the current map first makes the change layer easier to interpret because the reader already knows where agriculture, forest, wetlands, and developed cover are concentrated today.
The “other difference” share is especially important because it is the largest item in the change summary. A changed map class can represent real surface change, but it can also include classification variation. Differences in imagery, mixed pixels, boundaries between similar classes, and classification methods can all create small patches that should not be treated as documented construction, clearing, or farm conversion without additional evidence.
For that reason, 13.67% should be described as the share with a mapped class difference in this comparison, not as the percentage of the county that definitely changed legal land use. A sound follow-up workflow is to identify a cluster on the change map and then compare period-appropriate aerial imagery, parcel information, local planning records, or field observations. Use this comparison as a screening tool rather than as a parcel-history record.
Lake Ontario, the Erie Canal, and Oak Orchard provide useful context without changing what the map measures
The state’s Orleans County profile places the county on the south shore of Lake Ontario and notes the Erie Canal through its middle. County tourism information adds that Medina, Albion, and Holley developed as canal communities. These facts help a reader orient the three most visible developed clusters, but they do not turn the land-cover product into a historic settlement map. The colors still represent classified surface cover for the stated observation period.
Wetland context works the same way. DEC’s description of Oak Orchard and nearby managed wetland habitat explains why large wet areas are regionally plausible along the southern part of the county. That raster classification, however, does not identify habitat quality, public ownership, hunting rules, or wetland jurisdiction. A teal cell says the surface was classified as wetland; it does not carry all of the legal or ecological information associated with a specific protected area.
Likewise, agriculture on this map is a surface class, not a land-use permit or farm-business inventory. Cornell’s local programs show that fruit, field crops, dairy, and vegetable production are all relevant to the county’s agricultural economy, yet the yellow agricultural class cannot distinguish among them. The broad pattern is reliable for county-scale comparison, while farm type and property-level questions require more specialized sources.
This separation between map evidence and outside context is useful for readers who want to avoid overinterpreting a colorful map. Countywide land-cover data tell where broad surface types are concentrated. Local and state sources explain why some of those patterns matter to people, farms, habitats, and communities. Keeping those roles separate produces a more accurate picture than asking one dataset to answer every geographic question.
Choosing the right view and downloading the four JPG maps
Start with the general 2025 map when the goal is to compare all major surface classes in one frame. Choose the forest-and-farmland map when agriculture, wooded cover, or wetlands are the main subject. The impervious map is better for comparing the intensity of built surfaces, and the change map is the appropriate starting point for a broad 1985–2025 review. Each view simplifies the county in a different way, which is why using the full set often prevents misinterpretation.
Keep each legend with its map whenever possible. Colors do not carry the same meaning from one view to another, and the change layer uses categories that describe differences rather than current land cover. A cropped image without its legend can make an accurate map confusing. For printing or presentation work, retaining the title, county outline, and legend preserves the context needed to read the graphic correctly.
The download contains four original JPG files: the 2025 land-cover map, forest-and-farmland map, impervious/developed-land map, and 1985–2025 land-cover change map. Saving the ZIP locally makes it easy to place two maps side by side, reuse a clean original in a document, or return to the same county view without relying on a browser screenshot.
Raster cells, mixed pixels, and other limits to keep in mind
Annual NLCD is a raster dataset rather than a parcel map. The landscape is divided into grid cells, and the commonly used land-cover resolution is 30 meters. A single cell can contain more than one real-world surface, such as a field edge, a tree line, a narrow road, a drainage ditch, and part of a building. The classification still assigns a representative category, so boundaries can look blocky at close scale.
A mixed pixel is a cell containing several surface types. Mixed pixels matter most around narrow features and transitions, including farm edges, small wetlands, wooded strips, and roads. If two time periods classify the same mixed area differently, the change map can show a difference even when the ground transition was subtle. Broad clusters are generally more meaningful for countywide interpretation than isolated individual cells.
Because the 2025 layer represents one observation period, it is a dated snapshot rather than a live view. Construction, tree removal, restoration, crop rotation, or other changes after the observation period may not appear. Anyone making a decision about present site conditions should consult more recent imagery or local records. These maps are strongest as broad reference graphics rather than as a substitute for current field inspection.
Finally, land cover is not zoning, ownership, tax status, or a legal wetland determination. A cell classified as agriculture does not prove enrollment in an agricultural district, and a wetland cell does not establish a regulatory boundary. Developed cover does not distinguish residential from commercial or industrial zoning. Parcel-level or regulatory work should use the appropriate authoritative datasets for those questions.
Within those limits, the four maps work well together. They show where agriculture dominates, where wetlands and forest interrupt the farm matrix, where built surfaces become dense, and where the mapped class differs over the long comparison period. The strongest use is comparative: choose the layer that matches the question, then bring in a more specialized source if the question moves from county pattern to individual property.
Frequently Asked Questions
What is the largest 2025 land-cover class in Orleans County?
Agriculture is the largest mapped class at 58.17%. Wetlands follow at 16.98%, forest at 14.16%, developed land at 9.79%, and water at 0.67%. Across the county, farming dominates the mapped surface while substantial wetlands and wooded areas remain concentrated in several areas.
Why is developed land 9.79% while mean impervious surface is only 2.49%?
Developed land is a broad cover category that can include lawns, trees, gardens, and other permeable ground around buildings and roads. Impervious surface measures the harder fraction occupied by pavement, rooftops, and similar materials. Because it is a narrower measurement, the countywide mean is lower; only 0.82% of the county is mapped at 50% impervious or greater.
Does the 13.67% class difference mean 13.67% of Orleans County definitely changed land use?
No. The 13.67% figure describes cells whose mapped land-cover class differs between the 1985 and 2025 comparison layers. Some differences can reflect real surface change, while others may include classification variation or mixed-pixel effects. Parcel-level change should be checked against imagery, records, or other site-specific evidence.
What files are included in the Orleans County download?
The ZIP contains four original JPG maps covering 2025 land cover, forest and farmland, impervious/developed surfaces, and mapped land-cover differences from 1985 to 2025. They can be used separately or compared as a set depending on whether the project focuses on current surface cover, rural land, built intensity, or long-term change.
Map File Information
Orleans County Land Cover Maps 4 original JPG maps in one ZIP file.
- Included Files: Use only the versions confirmed in the article and supplied images
- File Type: Use the confirmed download contents
- Intended Use: Printing, education, presentations, and map-based projects
Related Maps
- Albany County Land Cover Map
- Allegany County New York Land Cover Map
- Bronx County New York Land Cover Map
Sources and references
- MRLC Annual NLCD Data – access to Annual NLCD land-cover and related products
- USGS Annual NLCD Land Cover Classification – definitions for the land-cover classes used in Annual NLCD
- U.S. Census Bureau TIGER/Line Shapefiles – county boundary and geographic reference data
- Cornell Cooperative Extension Orleans County – Programs & Education – local agricultural programs and county farming context
- NYSDEC Oak Orchard and Tonawanda Wildlife Management Areas – official wetland and habitat context for the southern county area
- New York State – Orleans County – official county overview including Lake Ontario, the Erie Canal, and Albion
Green Map creates custom-edited map images using open geographic data sources such as geoBoundaries, Natural Earth, OpenStreetMap, and government open data.
These maps are edited visual materials, not raw data files, and are provided for education, documents, presentations, and graphic reference.