Orange County, New York, is a place where broad forest cover, concentrated development, working farmland, wetlands, and water all remain visible at county scale. In the 2025 summary, forest is the largest class at 50.29%, followed by developed land at 21.61%, agriculture at 14.86%, wetlands at 9.90%, and water at 2.49%. The four maps on this page separate those patterns so the county can be read as more than a single color or statistic.
The general land-cover map, forest-and-farmland map, impervious-surface map, and 1985–2025 change map are shown below, and the four original JPG files are available together in one ZIP download. They work well for county profiles, school projects, environmental presentations, watershed background, or side-by-side comparison of rural and developed areas.
Table of Contents
Forest covers half the county, but the pattern changes from one area to another
The countywide percentages immediately show that Orange County is not simply an extension of the New York metropolitan area. Forest occupies just over half of the mapped surface, while developed land represents a little more than one fifth. Agriculture is smaller in total area, yet it forms several conspicuous blocks in the central and southern interior. Wetlands are also widespread enough to influence the appearance of valleys and low-lying areas, especially where forest, farms, and water meet.
Orange County’s 2025 Open Space Plan describes the county’s open-space resources as a mixture of agriculture, forestry, water, biodiversity and natural areas, recreation, and the built environment. That planning framework is useful background for the maps because the same broad landscape elements appear side by side in the land-cover data. The map itself, however, classifies surface cover rather than zoning, ownership, conservation status, or permitted land use.
The eastern edge is marked by the Hudson River, while the interior includes the Wallkill River valley, settled transportation corridors, agricultural lowlands, and wooded uplands. Those settings create a more varied countywide pattern than the percentages alone suggest. A large forest share can coexist with strong development clusters because the built areas are concentrated rather than evenly spread across every town.
The 2025 land-cover map shows a strong forest base around several developed centers
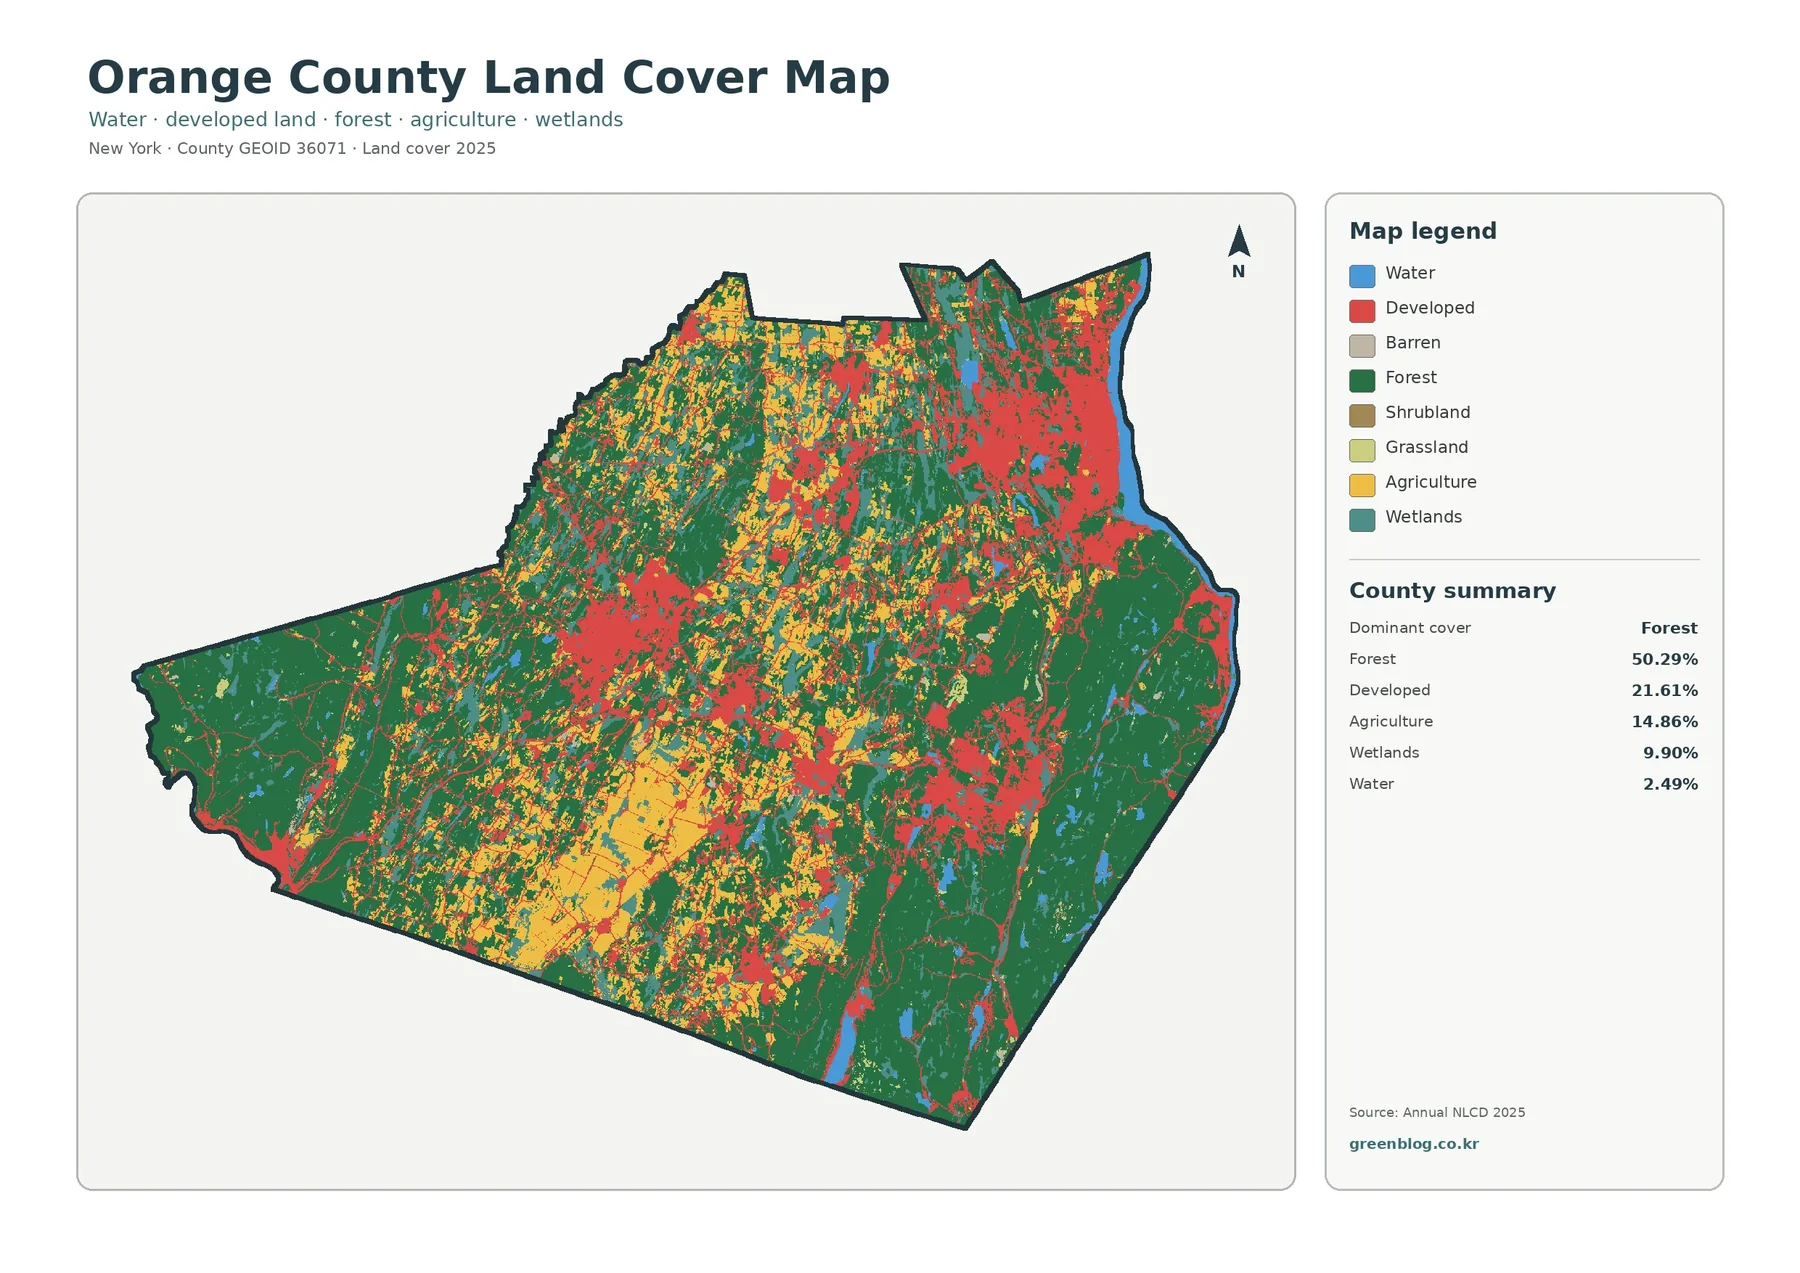
Dark green forest occupies broad parts of the western, southern, and southeastern county, with additional forest woven through the interior. Red developed cover is much more concentrated. The most prominent red areas occur in the northeast near the Hudson River, around the central-western developed area, and in the southeastern corridor. Smaller red lines and patches connect these centers through a landscape that otherwise contains forest, agriculture, and wetlands.
Yellow agricultural cover is especially noticeable through parts of the central and south-central county. It does not form one continuous rectangle; instead, farmed areas are interrupted by settlements, woods, wet ground, and transportation corridors. That broken pattern is important when reading the 14.86% agriculture figure. The percentage is countywide, while the actual map shows where agricultural cover is concentrated and where it gives way to other surfaces.
Wetlands account for 9.90%, a substantial share for a county with strong development and farming. Teal patches often sit between or alongside forest and agricultural areas rather than forming one simple band. Open water is only 2.49%, but it remains easy to identify along the Hudson River and in lakes and reservoirs. Together, water and wetlands help explain why the county’s surface pattern contains many narrow transitions instead of clean boundaries between large land-cover blocks.
Barren land, shrubland, and grassland are present but do not dominate the countywide picture. For most readers, the more useful first comparison is among forest, developed land, agriculture, wetlands, and water. That grouping makes it easier to see where the county is heavily wooded, where settlements are concentrated, and where the open agricultural landscape remains visible.
Forest and farmland reveal the Wallkill Valley and Black Dirt landscape more clearly
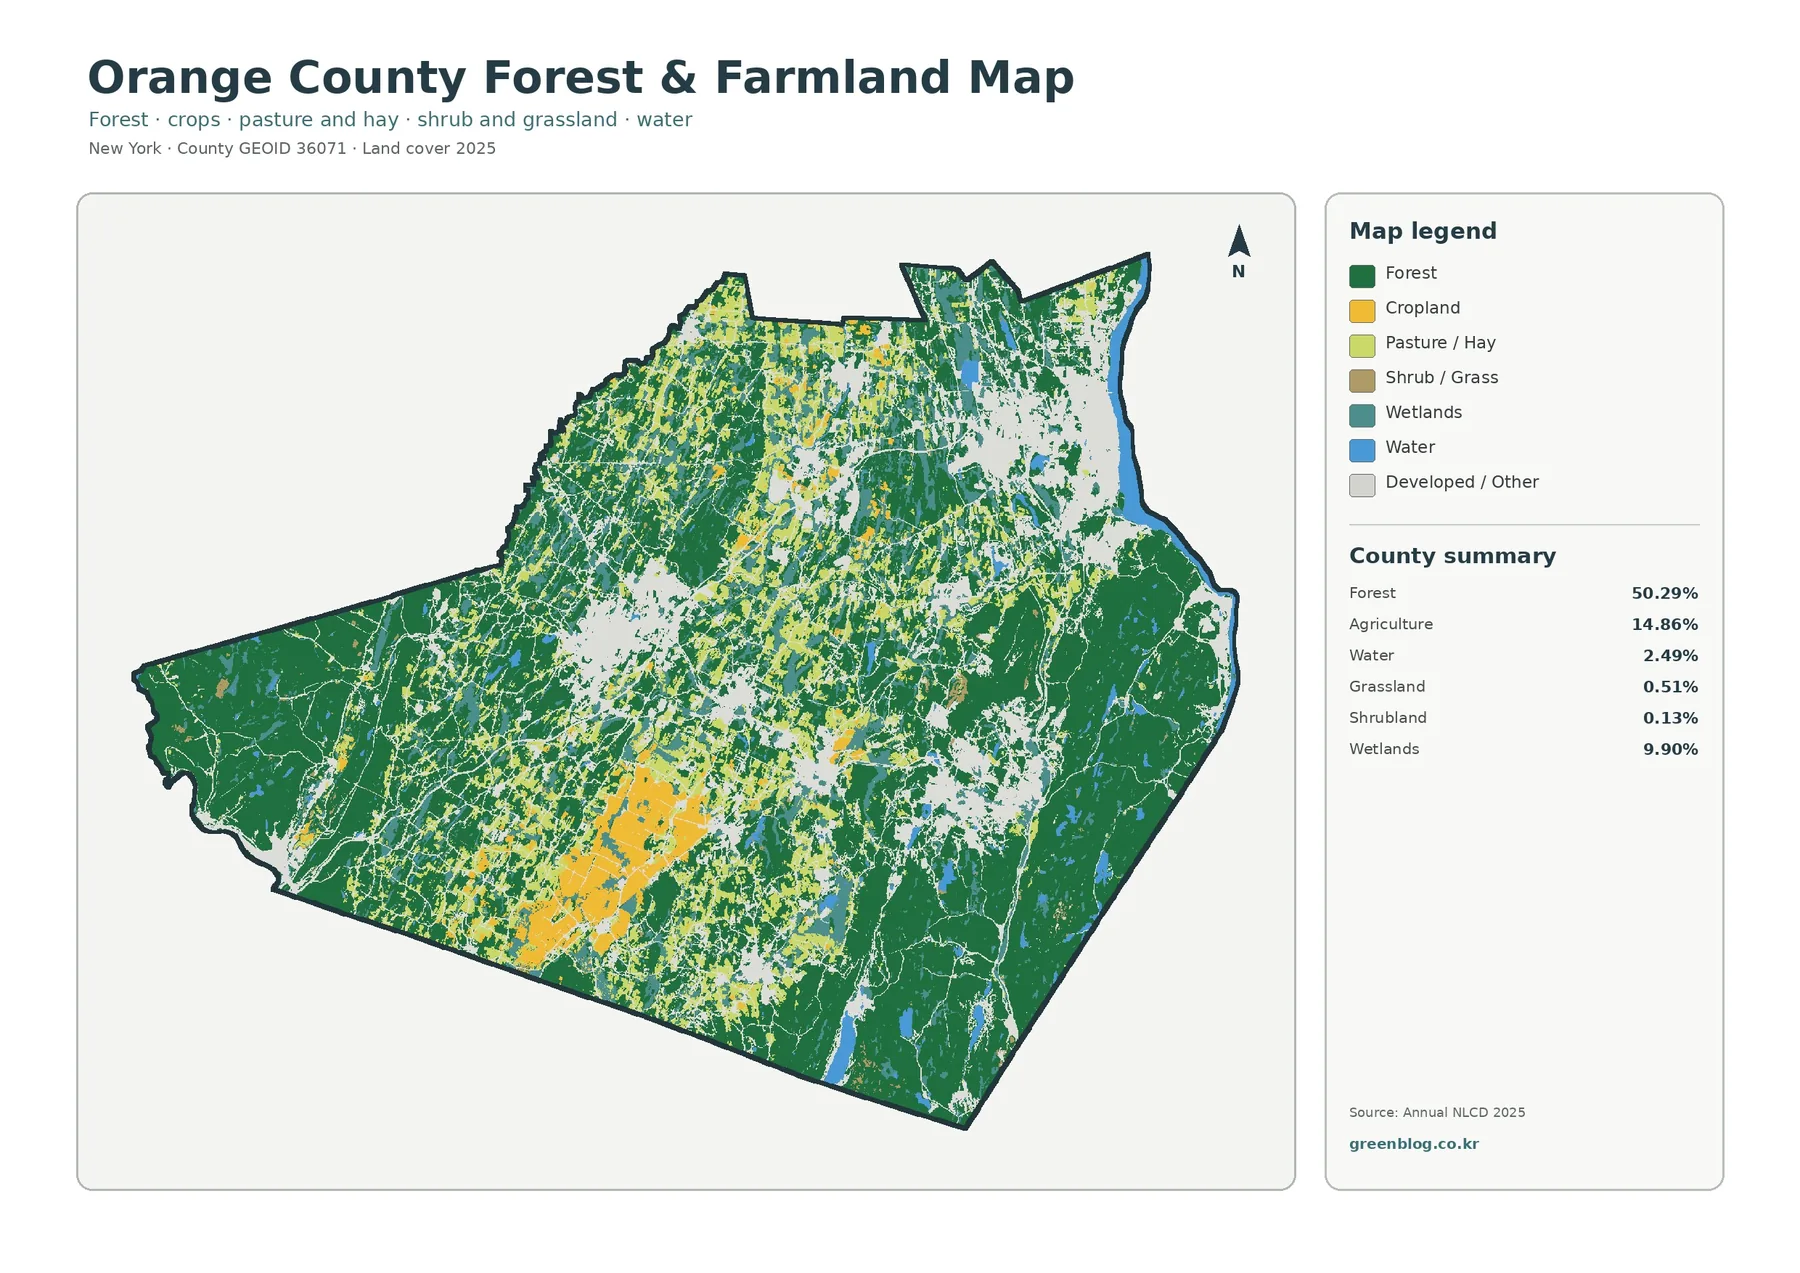
When developed and other cover is muted, the contrast between wooded country and agricultural land becomes easier to follow. Forest remains the dominant class at 50.29%. Agriculture totals 14.86%, while grassland is 0.51% and shrubland 0.13%. Wetlands at 9.90% and water at 2.49% continue to break up the rural pattern, so the map is not simply a two-color comparison between green forest and yellow farmland.
The county’s current Open Space Plan gives useful context for the concentrated farm areas. It notes that eight towns in a central north-south corridor account for about 80% of Orange County’s agricultural land and identifies the Wallkill River Valley as the setting for much of the well-known Black Dirt region. The plan also lists 613 farms in 2022, with an average farm size of 107 acres. Those planning and agricultural figures describe farms as an economic and land-management system; the NLCD map separately classifies what the ground surface looked like in 2025.
That distinction matters in places such as Warwick, Goshen, Wawayanda, and nearby parts of the central-southern county. The official county material describes productive Black Dirt soils in this broader agricultural area, while the map shows where cropland or pasture-like classes are actually mapped. An agricultural district, a preserved farm, and an agricultural land-cover cell are related ideas, but they are not interchangeable boundaries.
The forest pattern is equally important. Large green areas in the west and southeast provide a strong visual contrast with the agricultural interior. Green cells represent mapped tree cover, not a statement that the land is public forest, permanently protected open space, or managed for forestry. A project about ownership or conservation easements needs separate parcel and protection data even when the land-cover layer is a useful starting point.
Impervious surfaces concentrate around settlements and transportation corridors
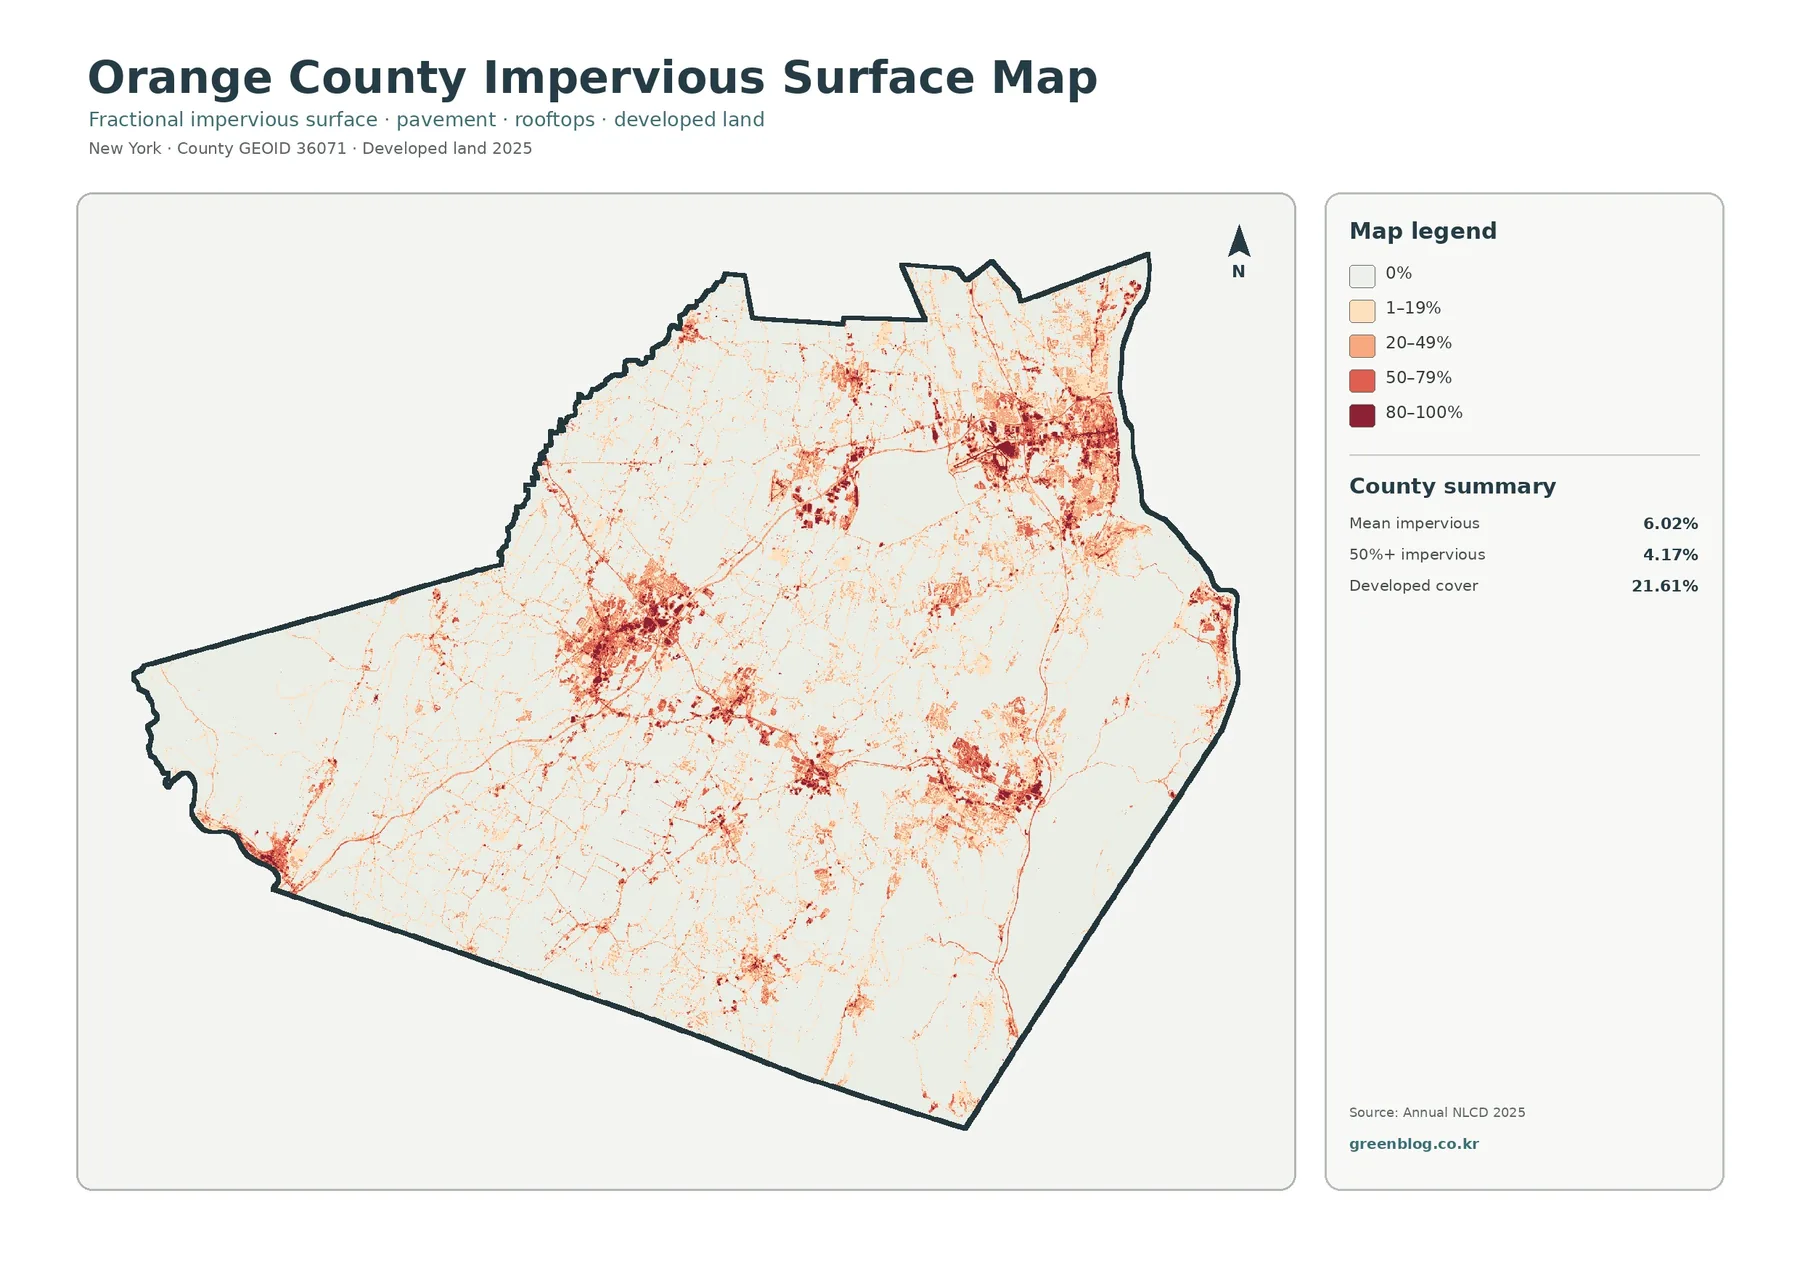
Impervious surface means ground covered by materials such as pavement and rooftops that do not readily absorb water. The countywide mean is 6.02%, and 4.17% of the county is mapped at 50% impervious surface or greater. These numbers are lower than the 21.61% developed-land share because a developed land-cover class can include lawns, trees, roadside vegetation, yards, and other permeable ground surrounding buildings and roads.
The darkest tones form compact clusters rather than a uniform blanket. A major concentration is visible in the northeast, with additional dense areas in the central-western and southeastern parts of the county. Thin linear features connect many of these clusters. At county scale, that pattern is useful for locating where hard surfaces and development are most concentrated without implying that every pale cell is undeveloped or that every dark line represents a specific named road.
For watershed or stormwater context, the impervious layer adds information that the general land-cover map cannot show as directly. Two areas may both be classified as developed, yet one can contain much more pavement and roof area than the other. Comparing the red developed class with impervious percentages helps distinguish a compact built center from lower-intensity residential or mixed landscapes.
This layer is still generalized. It estimates the fraction of hard surface within raster cells rather than tracing each driveway, parking lot, roof, or sidewalk as a surveyed outline. It is therefore appropriate for countywide comparison and presentation, but not for calculating the exact impervious area of a parcel or deciding whether a site meets a local stormwater threshold.
The 1985–2025 comparison highlights where mapped classes differ
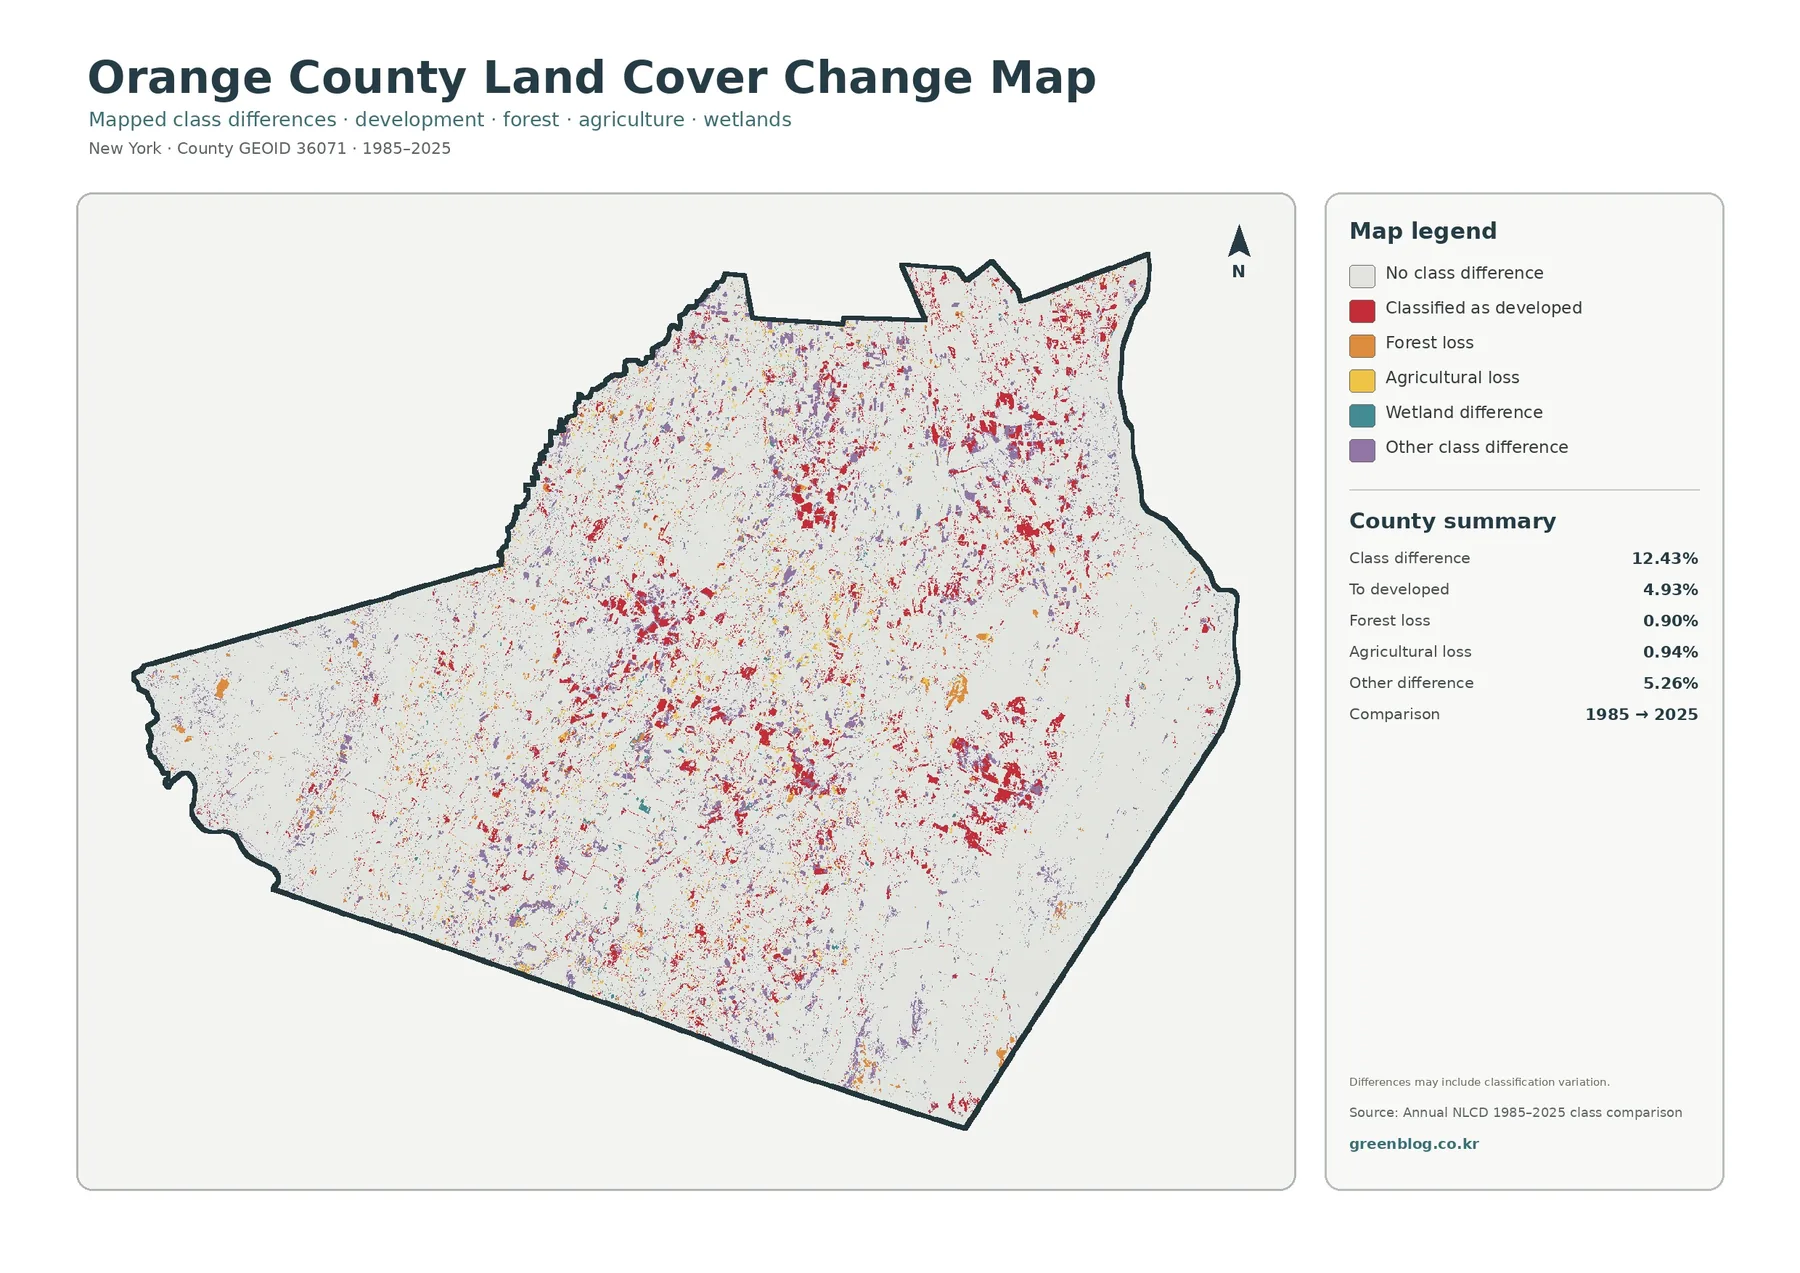
The change map reports a countywide class difference of 12.43% between 1985 and 2025. Of the county, 4.93% is shown in the category classified as developed, 0.90% as forest loss, 0.94% as agricultural loss, and 5.26% as other class difference. Most of the county remains light on this view, meaning no class difference is shown for those cells in the comparison.
Red change patches frequently appear near the same built areas that stand out on the current land-cover and impervious maps. That visual overlap makes the four-map set useful: the present-day map identifies the existing developed footprint, the impervious layer shows the intensity of hard surfaces, and the change layer indicates where the mapped class differs from the 1985 comparison. None of those layers alone gives a complete development history.
The legend itself cautions that differences may include classification variation. A changed color should therefore be treated as a signal to investigate, not automatic proof that a specific parcel was cleared, paved, farmed, restored, or developed in a particular year. Sensor differences, class definitions, mixed pixels, and classification uncertainty can contribute to small patches. Large, coherent patterns are generally more useful for broad interpretation than isolated single-cell changes.
For a local site, the safest approach is to use this map to locate a possible area of interest and then compare period-appropriate aerial imagery, parcel records, planning documents, or other compatible sources. At county scale, the 12.43% figure is best understood as the share with a mapped class difference in this comparison, not as a direct measurement of every physical land-use change over forty years.
Orange County’s farm-and-forest balance is part of an active planning question
The county’s planning documents repeatedly address the need to balance working farms, forests, waterways, and other natural resources with housing, transportation, and other development. That context fits the visible land-cover pattern particularly well. The maps show substantial forest, recognizable farm areas, and concentrated built centers existing within the same county rather than occupying separate regions with no overlap.
The Black Dirt agricultural area is especially useful as an example of why surface cover should be read with local context. County documents describe rich organic soils and a long-standing farming landscape in the Wallkill River Valley, including parts of Warwick, Goshen, and Wawayanda. On the map, agricultural cover is visible in that broader central-southern zone, but the NLCD layer does not draw the legal boundary of the Black Dirt region or identify individual farms.
Likewise, broad forest cover does not mean all wooded land has the same ecological condition or management status. A county-scale raster layer combines many forest settings into a small number of classes. Field conditions can differ because of tree species, age, fragmentation, slope, recent disturbance, or ownership. For a general map page, the strength of the land-cover layer is its ability to show the distribution of major surface types consistently across the entire county.
How to choose a map and download the four JPG files
Use the general 2025 map first when a project needs the full county mix in one view. The forest-and-farmland version is better when the question centers on rural landscapes or the relationship between wooded and agricultural areas. Choose the impervious map to compare built-surface intensity, and use the change map when the project needs a broad 1985–2025 comparison. Moving between the four views helps prevent one map from being asked to answer a question outside its purpose.
For presentations, reports, and classroom work, keep the legend visible whenever possible. The same color family can mean different things on different maps, especially on the change layer. Cropping out the legend can turn a clear comparison into an ambiguous graphic. When printing, also keep the county outline and enough surrounding white space to preserve the shape of Orange County and the location of its major pattern changes.
The ZIP download contains four original JPG files: the 2025 land-cover map, forest-and-farmland map, impervious/developed-land map, and 1985–2025 land-cover change map. Saving the set locally makes it easier to place the views side by side, use one map in a document, or return to the same county at a consistent scale without relying on screenshots from the page.
Scale, raster cells, and classification limits
Annual NLCD is a raster product, meaning the landscape is divided into grid cells rather than mapped as parcel polygons. At the commonly used 30-meter land-cover resolution, a cell can contain more than one real-world surface. A narrow road, tree line, drainage ditch, small building, and field edge may all fall within or across nearby cells, while the classification still assigns a representative category.
A mixed pixel is simply a cell that contains several surface types. This is one reason small edges can look blocky or change class between time periods even when the ground transition is gradual. The same caution applies to wetlands and small water features. A countywide map can show where these classes are concentrated, but it should not be used to establish a legal wetland boundary or the exact shoreline position for regulatory work.
The 2025 layer is also a dated snapshot. New construction, tree clearing, restoration, crop rotation, or other changes after the observation period may not be represented. If a decision depends on current site conditions, check recent imagery and local records. The land-cover maps are most reliable as broad reference graphics for patterns that remain meaningful at county scale.
Used within those limits, the four views answer several practical questions clearly: where forest dominates, where farm cover is concentrated, where hard surfaces form dense clusters, where wetlands and water interrupt the landscape, and where the mapped class differs over the long comparison period. They do not answer parcel ownership, zoning, tax status, permit eligibility, or exact site acreage.
Frequently Asked Questions
What is the largest 2025 land-cover class in Orange County?
Forest is the largest mapped class at 50.29%. Developed land follows at 21.61%, agriculture at 14.86%, wetlands at 9.90%, and water at 2.49%. The map shows that the forest share is spread broadly through several parts of the county, while developed and agricultural cover is more concentrated.
Why is developed land 21.61% when mean impervious surface is only 6.02%?
Developed land is a broader land-cover category that can include vegetation and other permeable ground around homes, businesses, roads, and institutions. Impervious surface measures the fraction occupied by harder materials such as pavement and rooftops. That narrower definition produces a lower countywide average, while 4.17% of the county is mapped at 50% impervious or greater.
Does 12.43% class difference mean 12.43% of the county was definitely converted to a new land use?
No. The 12.43% figure describes cells whose mapped class differs in the 1985–2025 comparison. Some differences can represent real change, while others may include classification variation or mixed-pixel effects. The change map is best used to identify broad areas for closer review rather than to prove a parcel-level history.
What is included in the Orange County map download?
The ZIP contains four original JPG maps covering current land cover, forest and farmland, impervious/developed surfaces, and mapped land-cover change from 1985 to 2025. The files are designed to be used together or separately depending on whether a project needs an overall landscape view, a rural comparison, a built-surface layer, or a long-term comparison.
Map File Information
Orange County Land Cover Maps 4 original JPG maps in one ZIP file.
- Included Files: Use only the versions confirmed in the article and supplied images
- File Type: Use the confirmed download contents
- Intended Use: Printing, education, presentations, and map-based projects
Related Maps
- Albany County Land Cover Map
- Allegany County New York Land Cover Map
- Bronx County New York Land Cover Map
Sources and references
- MRLC Annual NLCD Data – access to Annual NLCD land-cover and related products
- USGS Annual NLCD Land Cover Classification – definitions for the mapped land-cover classes
- USGS Annual NLCD Spatial Resolution – official confirmation that Annual NLCD raster data use 30-meter resolution
- Orange County Open Space Plan – county planning context for farms, forests, waterways, natural areas, and development
- Orange County Agricultural and Farmland Protection Plan – official county information on agriculture and farmland protection
- U.S. Census Bureau TIGER/Line Shapefiles – county boundary and geographic reference data
Green Map creates custom-edited map images using open geographic data sources such as geoBoundaries, Natural Earth, OpenStreetMap, and government open data.
These maps are edited visual materials, not raw data files, and are provided for education, documents, presentations, and graphic reference.