Lauderdale County occupies Alabama’s northwestern corner, where broad farm country, large forest blocks, the Tennessee River, and the developed area around Florence create several distinct land-cover settings within one county. Agriculture is the largest 2025 class at 42.45%, but the county does not look uniformly agricultural. Forest is much more prominent in the west, the main developed concentration lies around Florence, and wide Tennessee River water is a defining feature along the south.
The page uses four views to separate those patterns: general land cover, forest and farmland, impervious surface and developed land, and mapped class differences between 1985 and 2025. Lightweight WebP previews appear in the article, and the four corresponding original JPG files are available together in one ZIP download. The set is useful for county reference, classroom work, presentations, and broad landscape comparison, but it is not a parcel survey, zoning map, ownership record, or legal wetland determination.
Table of Contents
Agriculture leads the county total, but the 2025 pattern changes from west to east
The county summary places agriculture at 42.45% and forest at 31.37%, so those two classes account for most of the mapped landscape. Developed land contributes another 12.40%, water 6.85%, and wetlands 4.69%, while grassland and shrubland are much smaller at 1.15% and 1.08%. Those percentages are useful as a starting point, yet the spatial pattern matters just as much. Agricultural colors cover much of the central and eastern county, while western Lauderdale contains broader and more continuous forest. The southern edge adds large water areas, and Florence introduces a compact concentration of developed cover.
| Map basis | Annual NLCD 2025 |
|---|---|
| Agriculture | 42.45% |
| Forest | 31.37% |
| Developed | 12.40% |
| Water | 6.85% |
| Wetlands | 4.69% |
| Grassland | 1.15% |
| Shrubland | 1.08% |
| Mean impervious | 2.51% |
| 50%+ impervious | 1.23% |
| 1985→2025 class difference | 21.38% |
Land cover is a classification of what appears on the ground surface. It is different from legal land use, zoning, ownership, or a parcel boundary. An agricultural cell may represent cropland or another mapped agricultural surface, but it does not prove how a parcel is legally recorded. Developed classes may include vegetation mixed with homes or businesses, while narrow roads, small buildings, and small streams can be generalized when they share a raster cell with surrounding cover. For that reason, these maps are best used to compare broad county patterns rather than to make decisions about an individual property.
Florence and the Tennessee River provide the clearest reference points in the south
The general land-cover view makes the southern part of Lauderdale County especially easy to orient. A broad red developed cluster surrounds Florence, immediately north of a wide blue Tennessee River corridor. Moving away from Florence, the red area breaks into thinner lines and smaller patches while agriculture and forest quickly become more prominent. Smaller developed marks continue toward other communities, but they do not form another cluster of comparable size. This makes the Florence area a useful benchmark for comparing the county’s urban and rural settings.
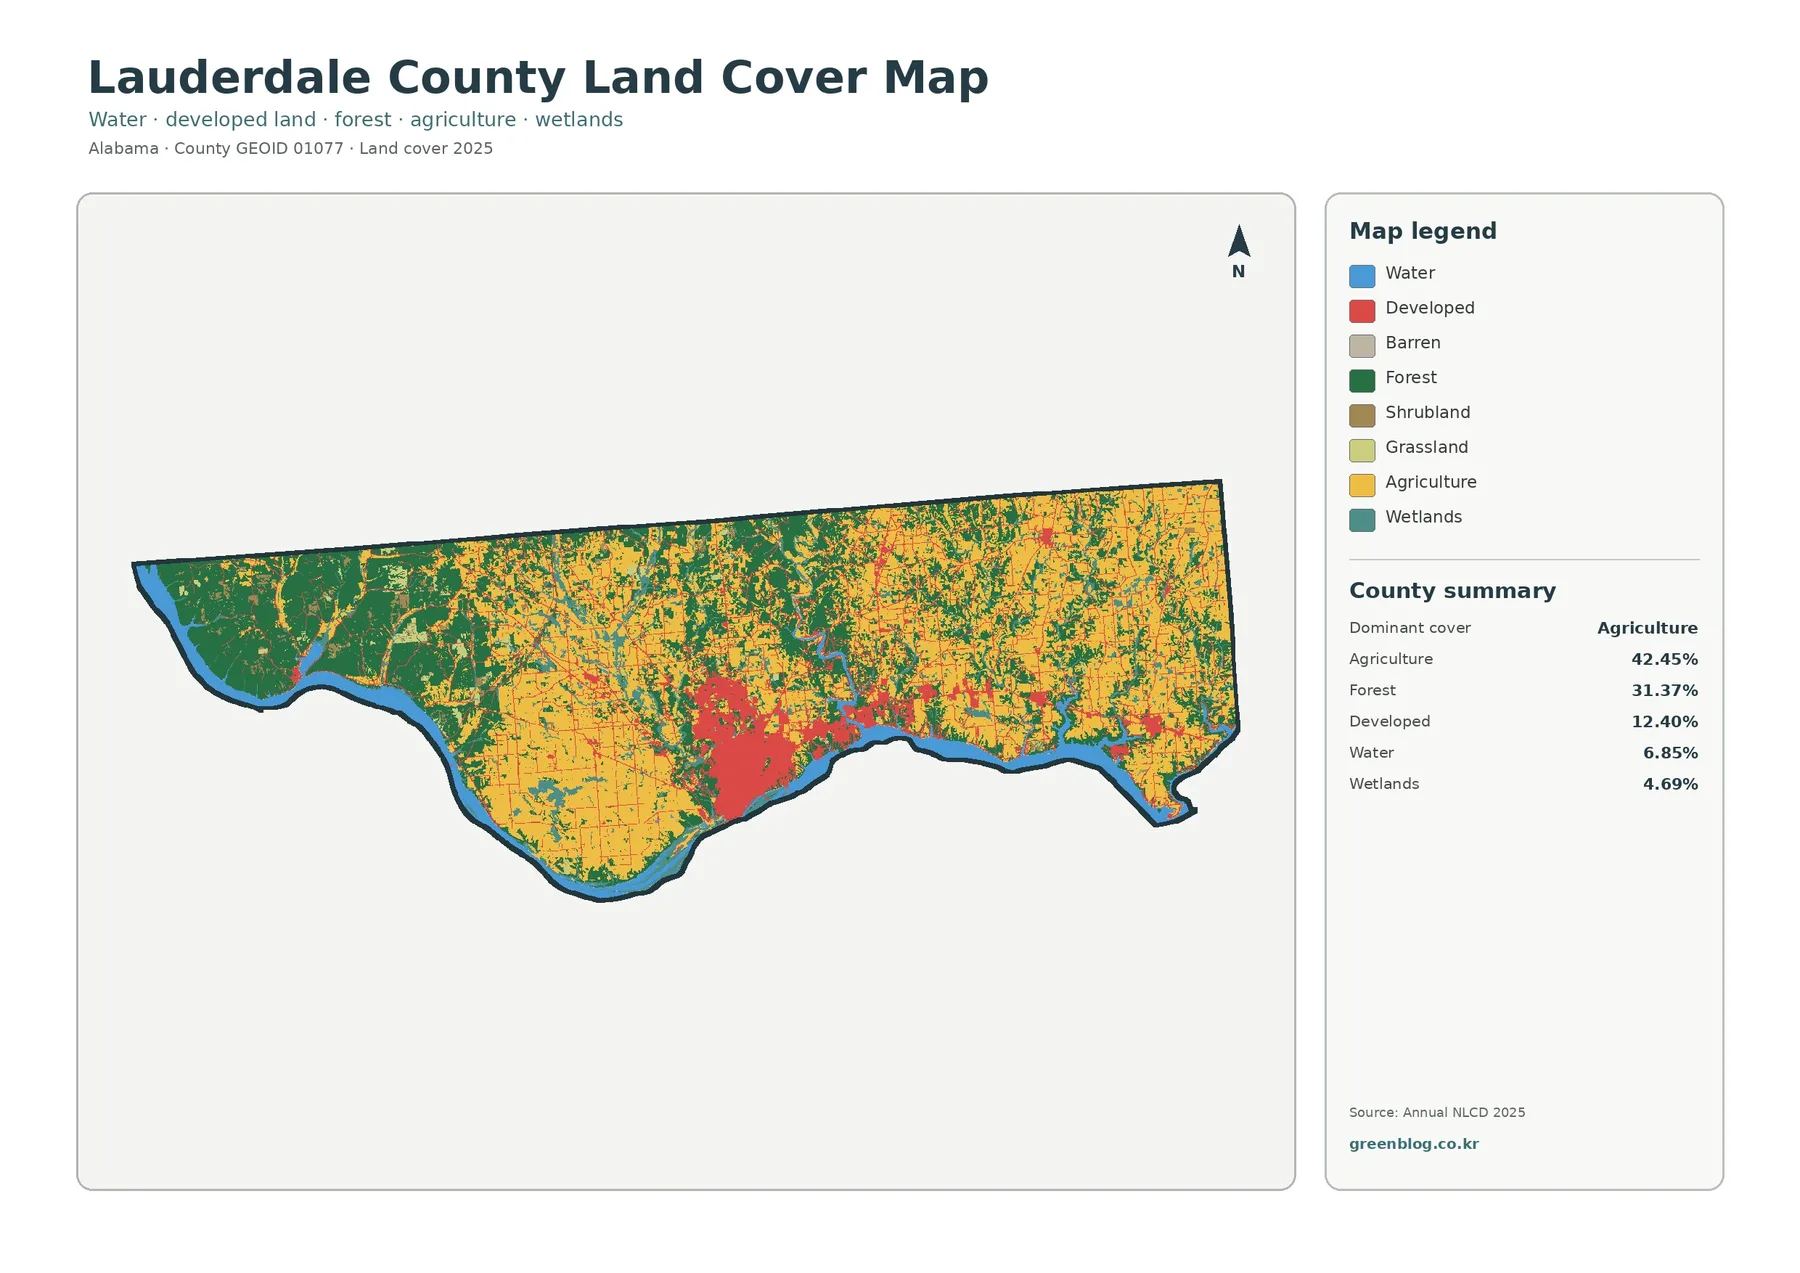
Water accounts for 6.85% of the 2025 summary, a substantial share that is visually obvious along the southern boundary. Wetlands add 4.69%, appearing as narrower and more irregular features around water and low-lying corridors. Treating those two classes separately is important. Open water and wetlands often occur near one another, but they represent different mapped conditions and do not occupy the same footprint. A regional description of Lauderdale County therefore becomes more accurate when the river, wetland patches, agricultural interior, and developed Florence area are discussed together rather than reduced to one dominant class.
County sources identify Florence as the principal city and also list communities including Killen, Rogersville, Lexington, Waterloo, Anderson, and St. Florian. These names help provide geographic context for the scattered developed marks outside Florence. They should not be used to assign a specific land-cover cell to a municipal boundary, because this map is about surface cover rather than city limits. The practical value is in seeing that development is concentrated in several places but reaches its strongest intensity near Florence.
Western forest gives way to a more agricultural center and east without a sharp boundary
The forest-and-farmland view makes the rural landscape easier to compare because it emphasizes forest, cropland, pasture and hay, shrub and grassland, wetlands, and water. Western Lauderdale County contains broad dark-green forest blocks, especially toward the narrow western end. Agricultural colors become much more frequent through the center and across the east. The transition is not a straight dividing line. Forest patches remain inside farm country, and agricultural openings appear within more forested areas, producing a mosaic rather than two separate zones.
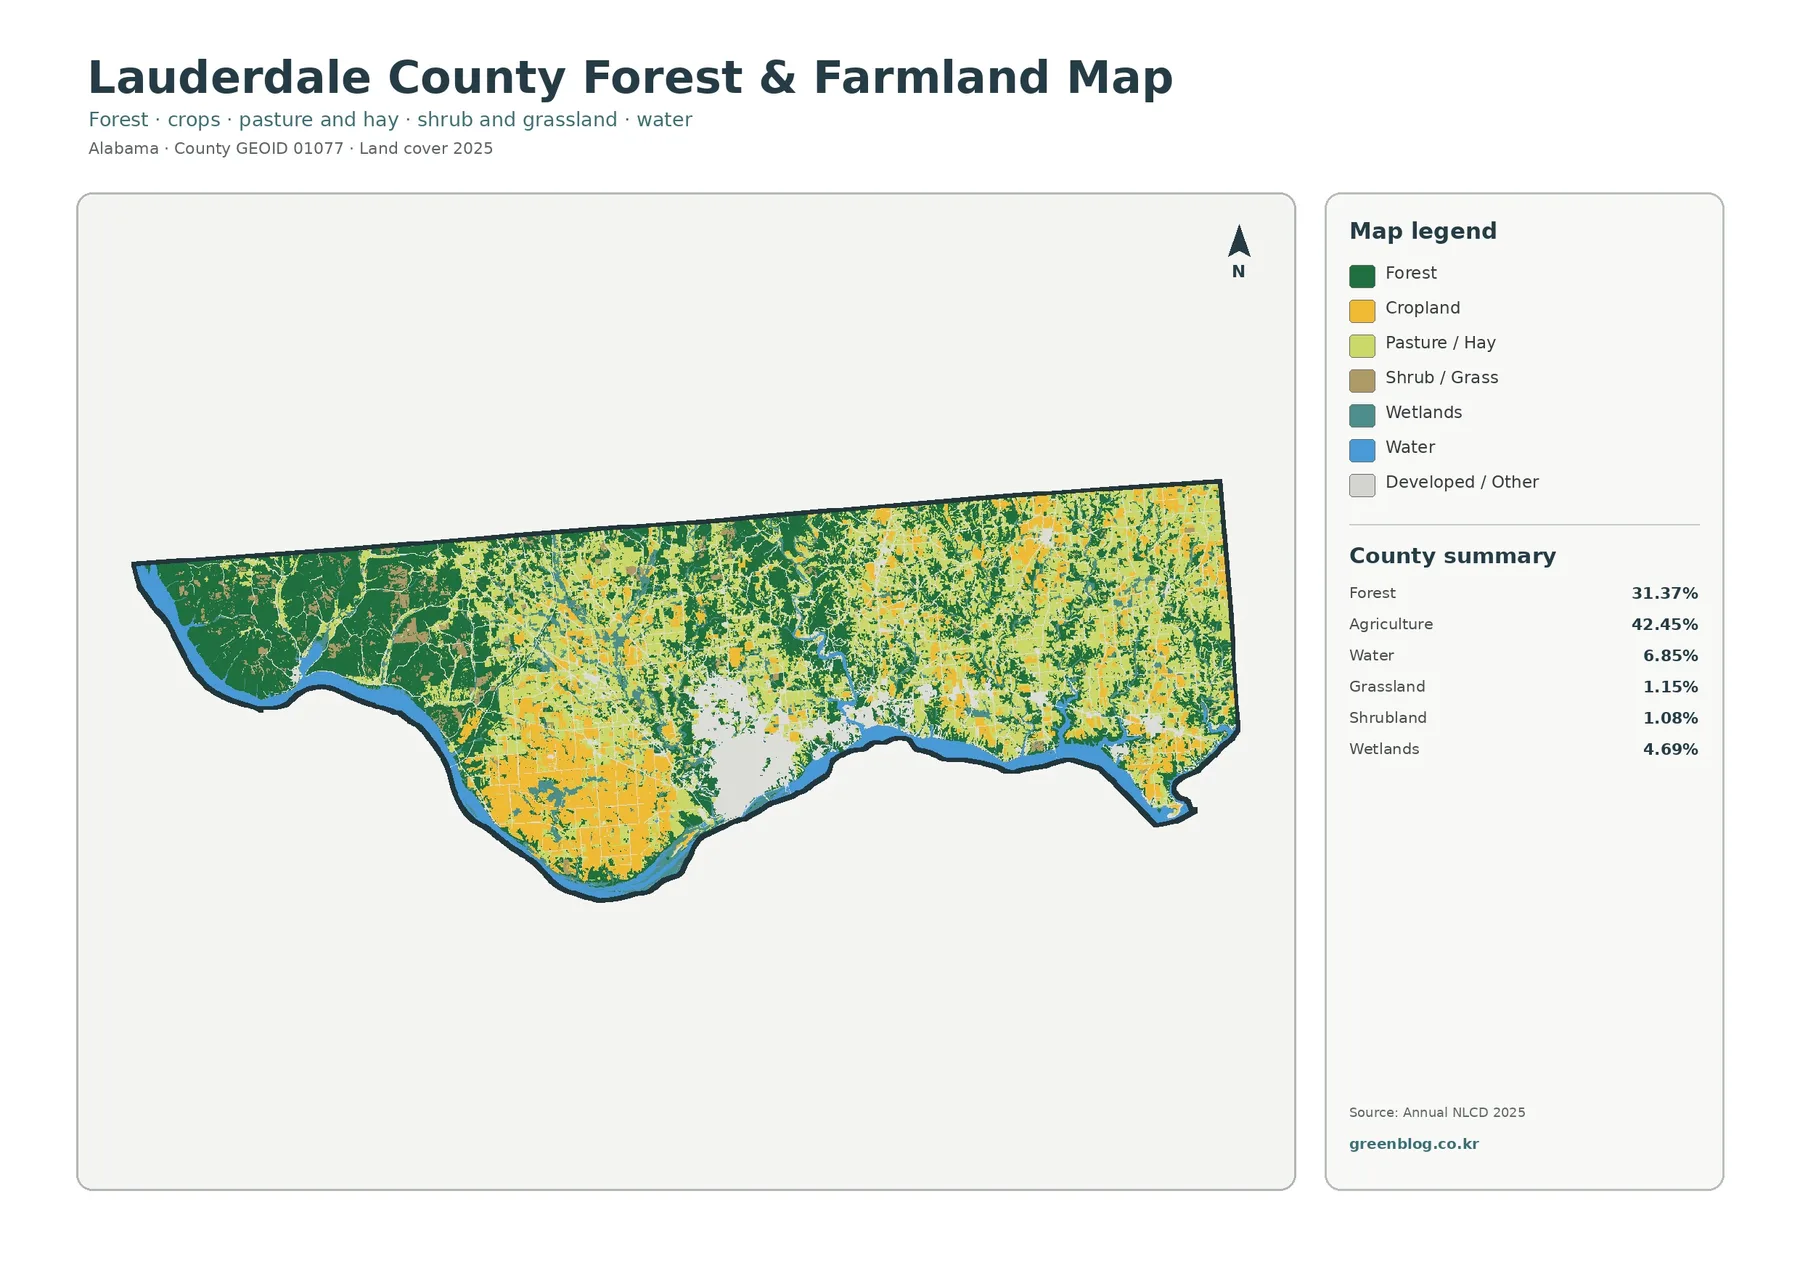
The percentages reinforce that comparison without replacing it. Agriculture covers 42.45% of the county and forest 31.37%, yet their locations differ enough that the local landscape can look very different from one side of the county to the other. Grassland at 1.15% and shrubland at 1.08% are small countywide categories, but they help explain lighter open patches between the two dominant covers. Wetlands and water interrupt both agricultural and forested areas, especially toward the river and drainage corridors.
This view works well for classroom discussions about rural landscapes because it avoids a common mistake: describing the county simply as “mostly farmland.” That statement is true at the county-total level, but it misses the large western forest presence and the smaller covers woven through the agricultural interior. The map does not identify crop species, farm ownership, forest type, or timber management, so those questions require separate agricultural or forestry data.
Impervious cover is strongly concentrated near Florence rather than spread across the county
Impervious surface means hard ground cover such as rooftops, pavement, parking areas, and other surfaces that allow little water to soak into the soil. Lauderdale County’s mean impervious value is 2.51%, while areas at 50% or more impervious cover account for 1.23%. Those countywide numbers are low because agriculture and forest occupy most of the land area. The local pattern is much more concentrated, with the strongest impervious values around Florence and only smaller clusters elsewhere.
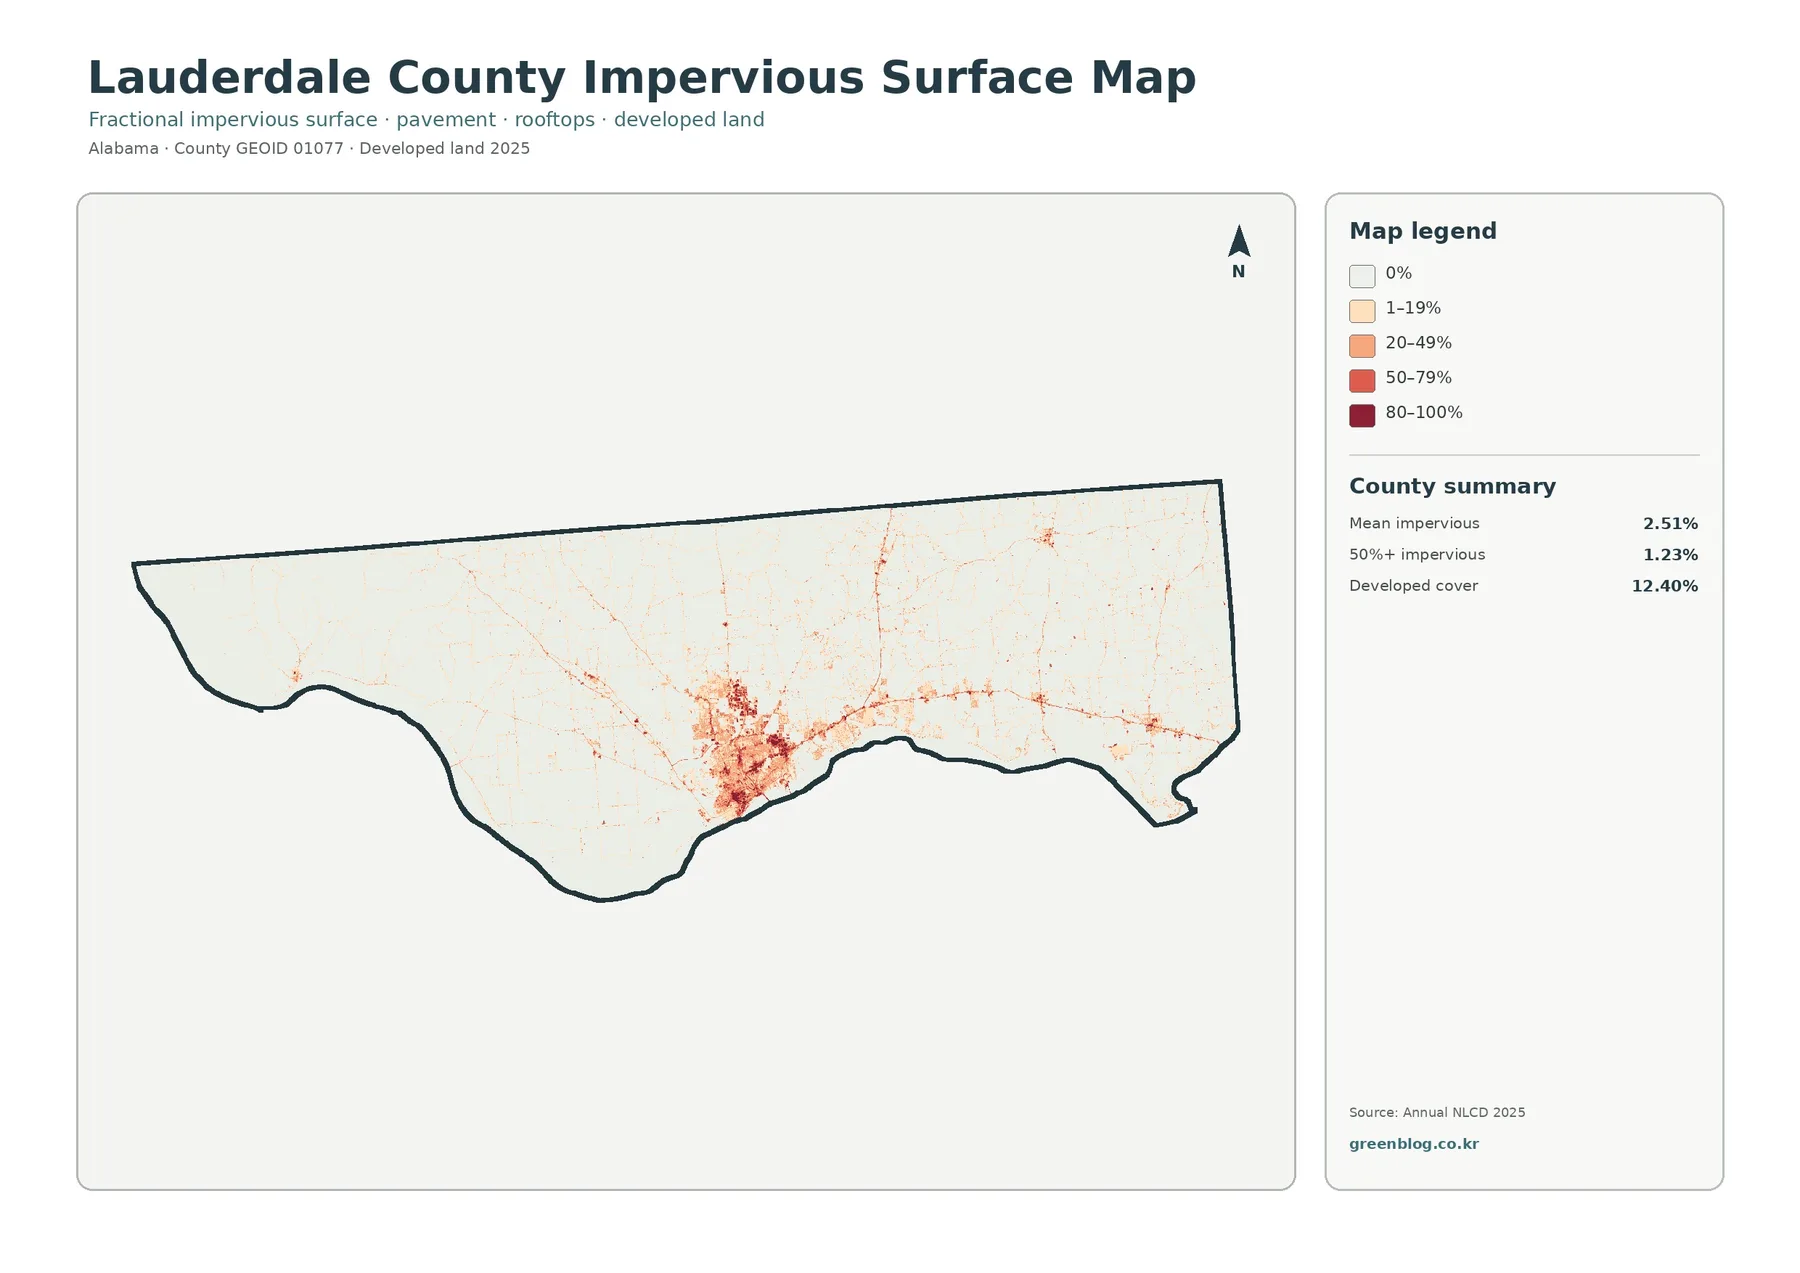
The map shows a dense group of orange and red values in the south-central county, with thinner traces extending outward along developed corridors. Farther into agricultural and forested areas, most cells are very light. This helps explain why developed land is 12.40% while the mean impervious percentage is only 2.51%. A developed class can include lawns, trees, and other permeable surfaces mixed with buildings and pavement, whereas the impervious layer focuses more directly on the hard portion of those places.
For broad planning context, environmental education, or a presentation about urban concentration, this view is more informative than the developed class alone. It should not be used to measure a roadway, calculate runoff for a specific site, or estimate building coverage for a parcel. Small features can be generalized, and any change after the observation period will not appear until a newer classification is available.
River water and wetland patches add a second pattern beyond farming and forest
The Tennessee River is not merely a boundary cue. Its wide water surface and nearby wetland areas account for a meaningful part of the county’s 2025 cover and create a landscape that differs from the inland farm and forest mosaic. Water reaches 6.85% and wetlands 4.69%, so together they are too large to treat as minor background categories. The river is most obvious along the southern edge, while wetland colors appear in smaller, branching or patchy forms around low areas and drainage features.
Comparing the general cover and forest-and-farmland views is useful here because the same river provides a stable visual reference while surrounding classes are emphasized differently. The general view helps place developed Florence beside the water, while the rural view makes forest, agriculture, wetlands, and water easier to compare. Neither map defines a regulatory wetland boundary, flood zone, or navigational condition. Those are separate questions that require specialized official sources.
The 21.38% class-difference total is much broader than newly developed land
The 1985–2025 comparison reports class difference across 21.38% of the county. That figure is not a development rate. The supplied summary separates change classified as developed at 2.77%, forest loss at 3.96%, agricultural loss at 1.42%, and other class difference at 12.81%. Because the comparison includes several types of difference, a colored cell indicates that the two classifications do not match, not that one specific event or cause has been proven.
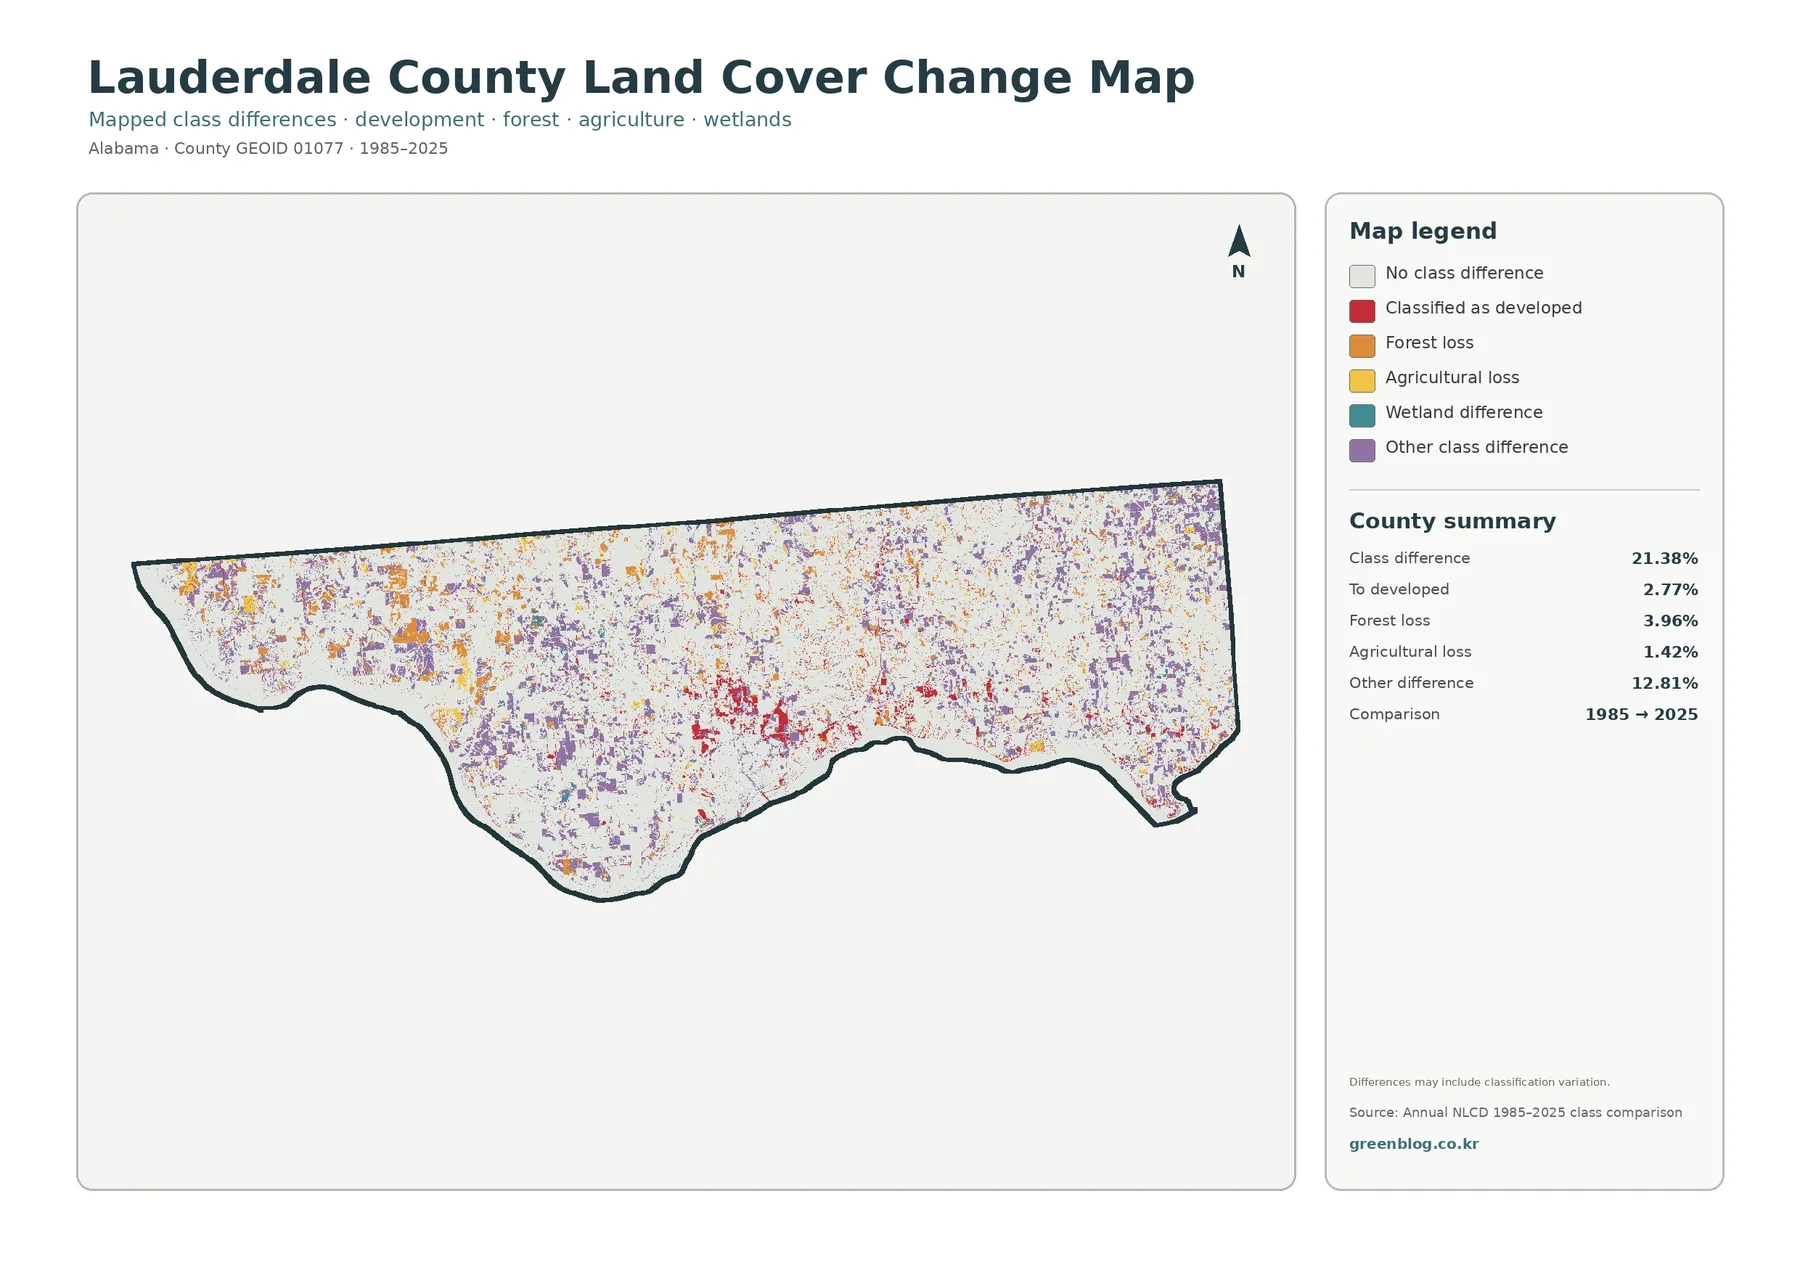
Red developed-change cells are most noticeable around the Florence area, but orange, yellow, teal, and purple differences occur across a much larger area. The map itself warns that differences may include classification variation. That limitation matters because the large “other class difference” category means that the comparison should be treated as a screening view for where classes changed, not as a complete history of why the landscape changed. Confirming a specific location would require historical imagery, local records, or another time-series source.
Used carefully, the comparison is still valuable. It can help a student or researcher choose areas for closer inspection, show that long-term change is not confined to the urban core, and separate mapped development from forest or agricultural losses. The strongest conclusion is therefore about the distribution of class differences, not a single countywide story about growth or decline.
Use the four views together when one classification does not answer the whole question
Each view is most useful for a different task. The general land-cover map gives the broadest overview and is a good choice for a county introduction. The forest-and-farmland version is clearer when the goal is to compare rural areas. The impervious layer is better for locating concentrated hard surfaces and distinguishing an urban center from surrounding low-density areas. The change comparison is the logical fourth step when the question shifts from present-day pattern to differences between 1985 and 2025.
Looking at the same location across the set prevents several common misreadings. Florence may appear as one broad developed area in the general classification, but the impervious view reveals which parts have the strongest hard-surface values. Western Lauderdale looks forest-heavy in both present-day views, while the forest-and-farmland version provides more detail about agricultural openings and wet areas inside that landscape. Along the Tennessee River, the water body can be used as a reference point while the surrounding cover changes from urban to rural.
For printed handouts or presentation slides, the best choice depends on the message. Use the general view for a simple county overview, the rural view for agricultural and forest comparison, the impervious view for developed concentration, and the change view for a time comparison. Keeping the legend visible and stating the observation year will make the image easier for a non-specialist audience to understand.
Important limits before using the data for a specific site
These are generalized raster classifications, so a cell can contain more than one real-world surface even though only one class is displayed. Narrow streams, small roads, individual buildings, tree cover around homes, and field edges may be simplified. The 2025 layer also represents a particular observation period; newer construction, clearing, or vegetation change will not appear until a later dataset is produced.
Mapped wetlands are not legal wetland boundaries, developed cover is not zoning, and agricultural cover is not proof of legal land use or ownership. The maps are appropriate for regional orientation, education, visual comparison, and choosing places for further study. They should be paired with parcel records, engineering data, regulatory sources, or current imagery when a decision depends on exact conditions at one location.
Download the four Lauderdale County JPG files
The ZIP below contains the four original JPG files corresponding to the WebP previews in this article: general land cover, forest and farmland, impervious surface and developed land, and 1985–2025 class difference. Each JPG is 2480×1754 pixels. The files are convenient for classroom handouts, printed reference sheets, slide decks, and personal map projects when the smaller on-page preview is not sufficient.
Frequently Asked Questions
What is the largest land-cover class in Lauderdale County in 2025?
Agriculture is the largest class at 42.45%, followed by forest at 31.37%. The agricultural cover is more extensive across the center and east, while the western part of the county contains larger forest blocks.
Why is developed land 12.40% while mean impervious cover is only 2.51%?
Developed classifications can include lawns, trees, and other permeable surfaces mixed with buildings and pavement. Impervious cover measures the hard surface portion more directly, so its countywide mean is lower than the broader developed-land percentage.
Does the 21.38% class difference mean that much of the county was newly developed?
No. The 21.38% value combines several kinds of class difference between 1985 and 2025. Change classified as developed is listed separately at 2.77%, and the comparison can also include classification variation.
What is included in the download?
The ZIP contains four 2480×1754 JPG files: general land cover, forest and farmland, impervious/developed land, and the 1985–2025 class-difference view. The article displays WebP previews of the same four products.
Map File Information
Lauderdale County Land Cover — 4 JPG Files
- Printable Size: 2480×1754 pixels each
Related Maps
- Autauga County Alabama Land Cover Map
- Baldwin County Alabama Land Cover Map
- Barbour County Alabama Land Cover Map
Data and reference sources
The percentages and change values discussed here come from the supplied Annual NLCD 2025 and 1985–2025 comparison materials. The official sources below provide additional context for land-cover classification, county boundaries, local government, and agricultural outreach in Lauderdale County.
- MRLC Annual NLCD Data
- USGS Annual NLCD Land Cover Classification
- U.S. Census Bureau TIGER/Line Shapefiles
- Lauderdale County Government
- Alabama Cooperative Extension System — Lauderdale County
Green Map creates custom-edited map images using open geographic data sources such as geoBoundaries, Natural Earth, OpenStreetMap, and government open data.
These maps are edited visual materials, not raw data files, and are provided for education, documents, presentations, and graphic reference.