Lamar County in western Alabama is mostly forested, but the 2025 land-cover map shows much more than one continuous block of trees. Wetland bands cross wooded areas, agriculture appears in scattered openings, and developed land is concentrated around a few small population centers. Forest accounts for 53.89 percent of the county and wetlands for 17.83 percent, while the clearest developed clusters align broadly with Sulligent in the north, Vernon in the center, and Millport in the south.
This page compares four supplied products: general land cover, forest and farmland, impervious surface, and class differences from 1985 to 2025. The WebP images are page previews, and the four original JPG maps are available together in one ZIP below. They are useful for teaching, county reference, and printed comparisons, but they are not parcel, zoning, ownership, flood, or survey maps.
Table of Contents
Lamar County land-cover percentages and overall pattern
The supplied 2025 summary lists forest at 53.89 percent, wetlands at 17.83 percent, agriculture at 9.93 percent, developed land at 6.61 percent, and shrubland at 6.61 percent. The forest-and-farmland version also reports grassland at 4.89 percent and water at 0.20 percent. Forest is clearly dominant, yet the map remains visually varied because wetlands form long branching bands and agricultural openings are distributed through several parts of the county.
| Reference | Annual NLCD 2025 |
|---|---|
| Forest | 53.89% |
| Wetlands | 17.83% |
| Agriculture | 9.93% |
| Developed | 6.61% |
| Shrubland | 6.61% |
| Grassland | 4.89% |
| Water | 0.20% |
| Change comparison | 1985 → 2025 |
Land cover describes the surface class mapped from remotely sensed data. A forest class is not a timber-ownership record, agriculture is not a zoning designation, and a wetland class is not a regulatory wetland determination. Raster cells generalize the landscape, so small roads, ponds, yards, and trees can be mixed. These maps are strongest for countywide comparison rather than property-level decisions.
Forest dominates, but wetlands cross much of the county
The general map is the clearest overview. Dark green forest reaches almost every part of Lamar County. Teal wetland classes form wide and narrow bands that bend and branch across the north, center, and south. Yellow agricultural cover appears in separate blocks and strips instead of one continuous farming zone. Blue open water is limited at 0.20 percent, while the much larger wetland share adds a strong water-related pattern.
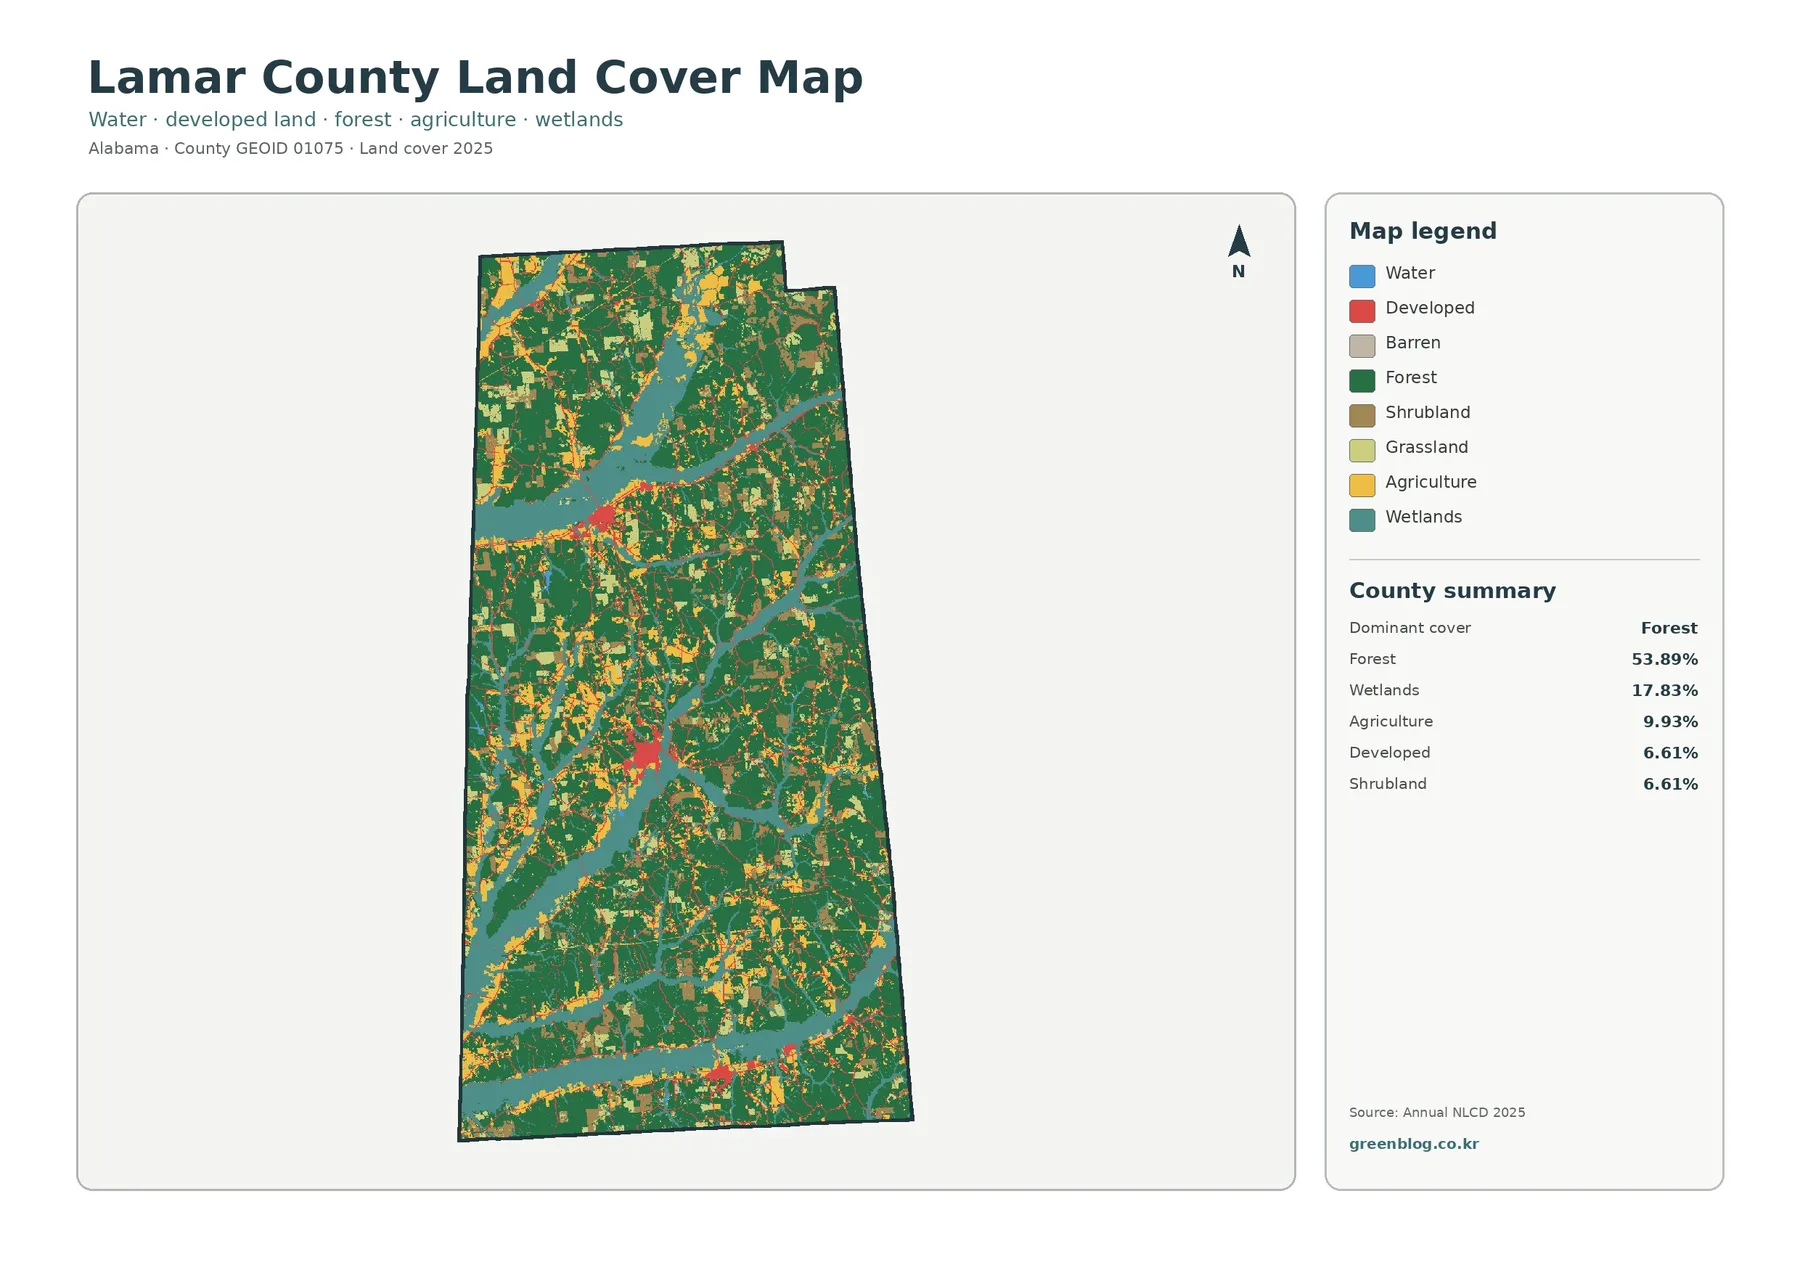
Developed land is only 6.61 percent, yet its red color makes several centers easy to locate. The northern cluster matches Sulligent, the central cluster matches the Vernon area, and the southern cluster aligns with Millport when the map is compared with official place locations. Between those centers, developed colors become sparse and forest, wetlands, agriculture, and other rural cover return quickly. The result is a set of compact small-town footprints separated by broad nonurban areas.
The forest and farmland map makes the rural mosaic easier to read
The forest-and-farmland view simplifies the legend so wooded ground, cropland, pasture or hay, shrub and grassland, wetlands, and water can be compared more directly. Forest remains the large dark-green background. Cropland and pasture or hay appear as scattered openings of different sizes, often beside forest or wetland bands. That distribution gives more useful context than the 9.93 percent agriculture total alone because it shows where open land interrupts the wooded landscape.
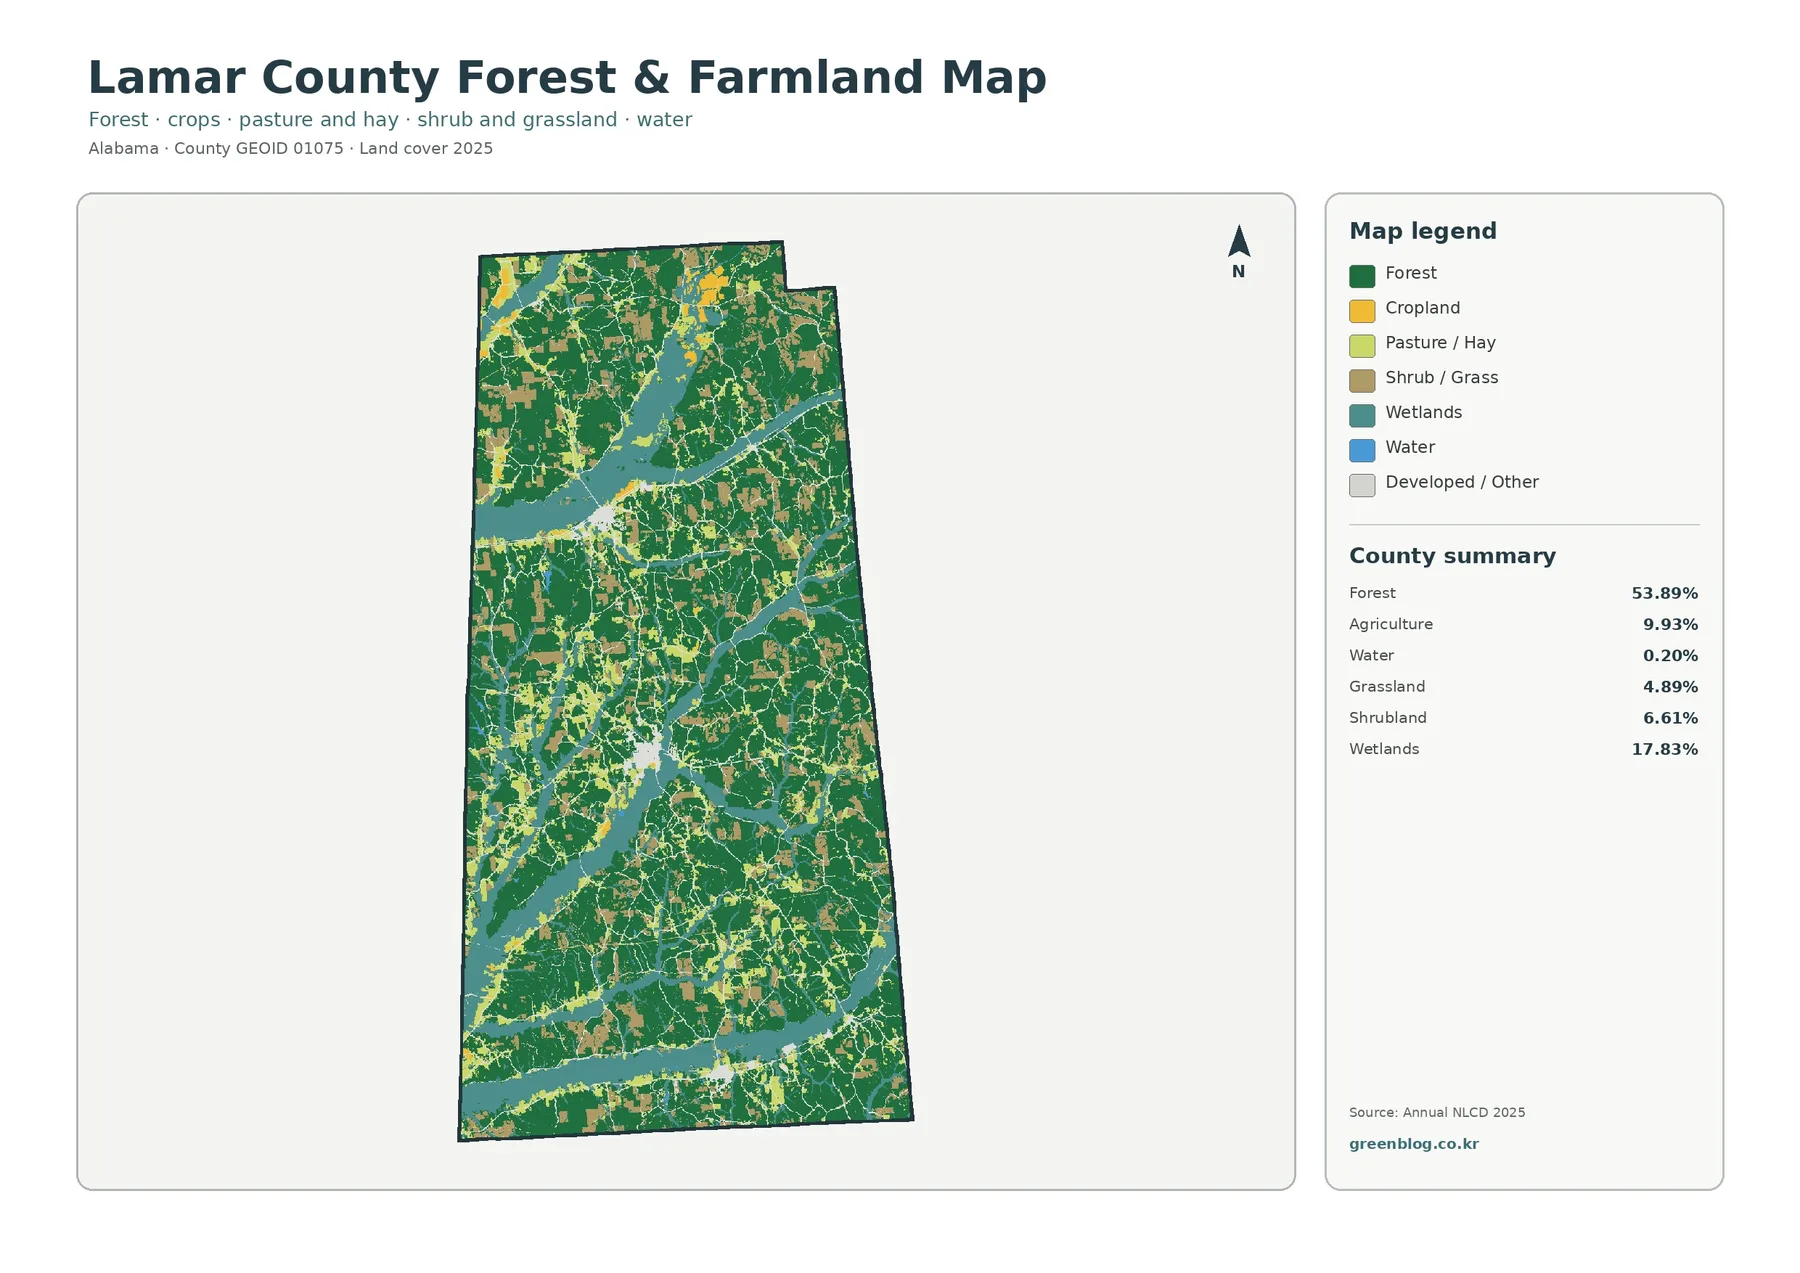
This map can support forestry, farming, and rural-landscape discussions, but it does not identify tree species, crop type, farm ownership, or production. A classroom description should therefore stay with what the image supports: forest covers broad connected areas, agricultural land is broken into many openings, and wetlands repeatedly meet both wooded and open land.
Impervious surface is low and concentrated around small towns
Impervious surface means rooftops, pavement, parking areas, and other surfaces that do not readily absorb rainfall. Lamar County has a mean impervious value of 0.95 percent, and only 0.20 percent of the county is mapped at 50 percent impervious or higher. Most of the image is very light, while orange and red pixels form three main clusters and thin connecting traces.
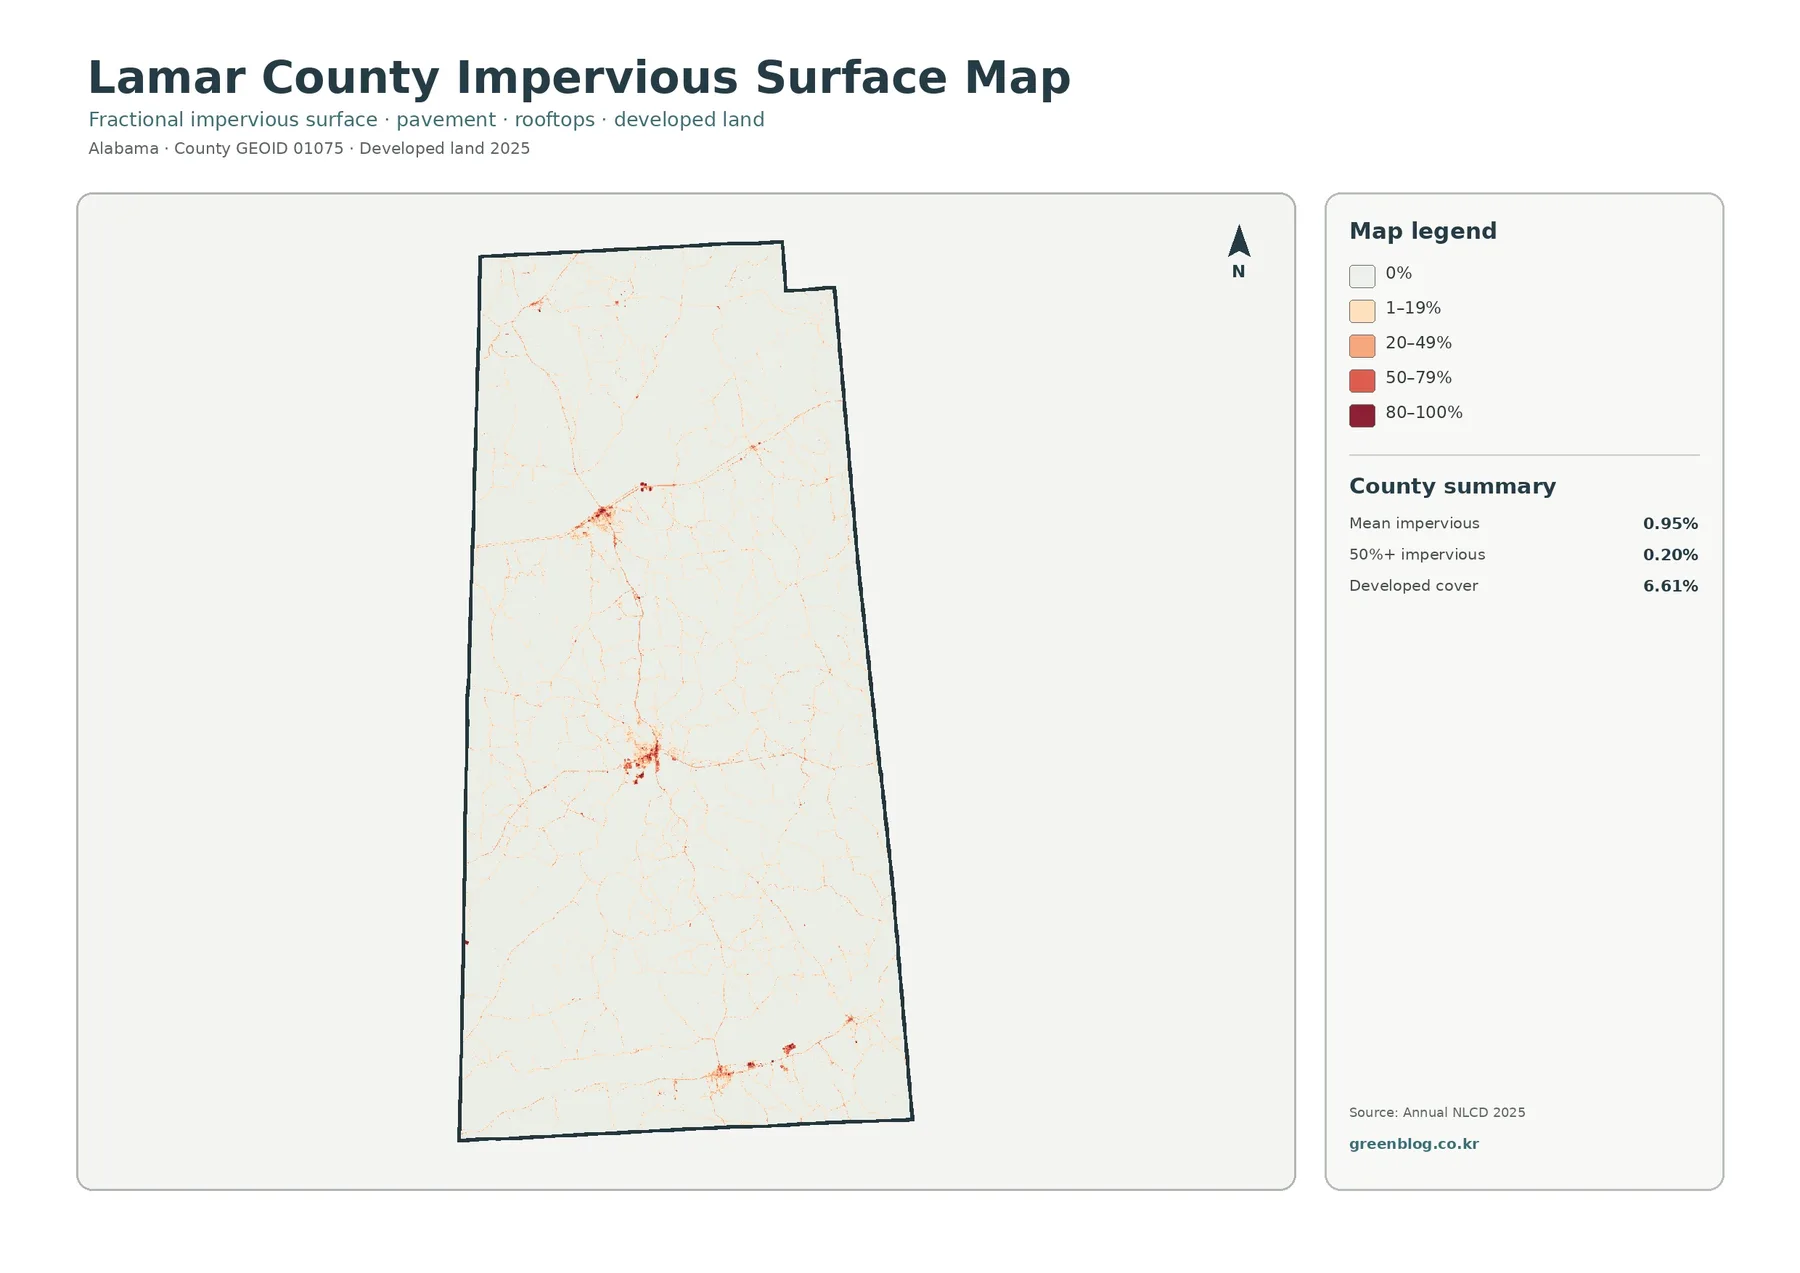
The three strongest clusters correspond broadly with Sulligent, Vernon, and Millport. Developed land at 6.61 percent and mean impervious surface at 0.95 percent are not competing statistics: low-intensity developed areas can contain houses and roads mixed with lawns, trees, and other vegetation. The impervious map isolates the hard-surface fraction and shows settlement concentration, but it cannot identify roads, calculate runoff, or determine flood risk.
The 1985–2025 map shows class differences, not a single development trend
The supplied change map compares 1985 and 2025 classifications. It reports class differences across 43.10 percent of Lamar County, including 1.20 percent mapped as change to developed, 10.49 percent as forest loss, 4.02 percent as agricultural loss, and 26.91 percent as other class difference. The map also warns that differences may include classification variation, so the 43.10 percent total should not be described as land development or one type of physical conversion.
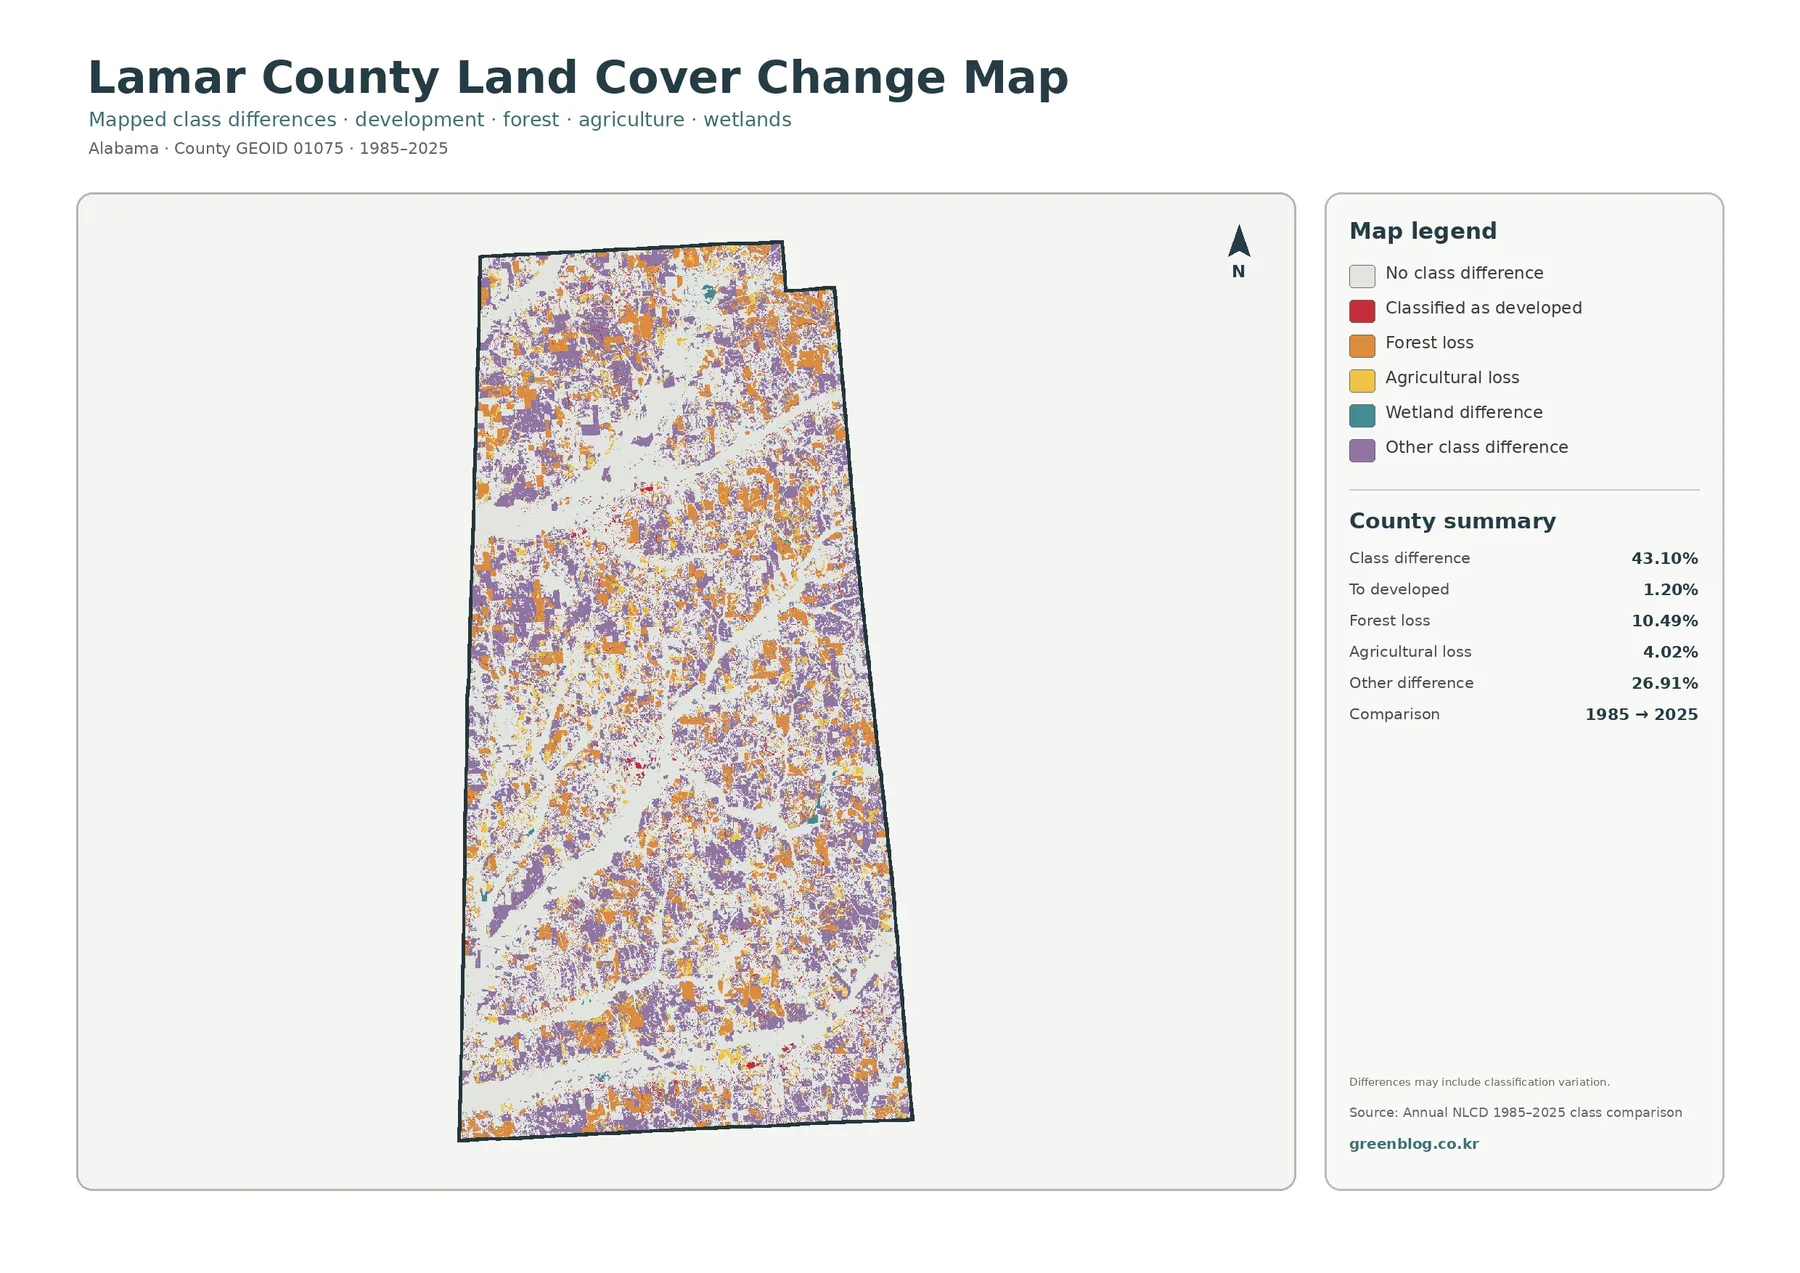
Orange forest-loss and purple other-difference cells are scattered widely, while red change-to-developed cells are much less extensive. The 10.49 percent forest-loss value also does not automatically mean present forest area is exactly 10.49 percentage points lower than in 1985. It compares endpoint classes rather than every event between those years. Detailed trend work should use additional NLCD years, historical imagery, forestry records, or field information.
Choosing the right map and reading it at the right scale
Use the general map for a countywide overview, the forest-and-farmland view for wooded versus open rural land, the impervious map for built-surface concentration, and the 1985–2025 map for locating long-term class differences. Because all four share the same county outline, an area found in one view is easy to compare with the others.
- Overall cover: compare forest, wetlands, agriculture, development, and other classes on the general 2025 map.
- Rural landscape: compare forest, cropland, pasture or hay, grassland, wetlands, and water on the simplified map.
- Built surface: use the impervious map to see where rooftops and pavement are concentrated around community centers.
- Long-term screening: locate class differences on the 1985–2025 map, then return to the current map and other dated sources.
- Printing: use the JPG files in the ZIP when a larger source image is more convenient than the WebP preview.
These are generalized county-scale maps. Small features can disappear or mix with neighboring cover, and wetland, developed, or impervious colors do not establish legal boundaries, zoning, flood risk, or engineering values. For property or permitting decisions, use current local, state, and federal records.
Download the four Lamar County land-cover JPG maps
The ZIP below contains the four original JPG maps, each 2480×1754 pixels, for printing, slides, classroom materials, or offline reference.
Frequently Asked Questions
What is the dominant land cover in Lamar County?
Forest is the largest 2025 class at 53.89 percent. Wetlands are next at 17.83 percent, followed by agriculture at 9.93 percent. Forest is widespread, but wetland corridors and agricultural openings make the county’s mapped landscape more varied than the forest percentage alone suggests.
Why is developed land 6.61 percent when mean impervious surface is only 0.95 percent?
Developed land can include low-intensity areas where houses, roads, lawns, and trees are mixed. Impervious surface measures the hard fraction such as pavement and rooftops. A place can therefore be classified as developed while most of the ground within that area still absorbs water or supports vegetation.
Does 43.10 percent class difference mean 43.10 percent of the county was developed?
No. The 43.10 percent value includes all mapped class differences between 1985 and 2025. Change to developed is listed separately at 1.20 percent, while forest loss, agricultural loss, other differences, and possible classification variation contribute to the larger total.
What files are included in the ZIP?
The download contains four original JPG maps: general land cover, forest and farmland, impervious/developed surface, and the 1985–2025 class-difference map. Each JPG is 2480×1754 pixels, while the article uses WebP previews of the same map set.
Map File Information
Lamar County Land Cover — Four JPG Maps
- Printable Size: 2480×1754 pixels each
Related Maps
- Autauga County Alabama Land Cover Map
- Baldwin County Alabama Land Cover Map
- Barbour County Alabama Land Cover Map
Data sources and local references
The map percentages and observations come from the supplied Annual NLCD 2025 map set and the supplied 1985→2025 comparison. The official sources below provide classification documentation, boundary data, and Lamar County local context.
- MRLC Annual NLCD Data
- USGS Annual NLCD Land Cover Classification
- U.S. Census Bureau TIGER/Line Shapefiles
- Lamar County Government
- Alabama Cooperative Extension System – Lamar County
Green Map creates custom-edited map images using open geographic data sources such as geoBoundaries, Natural Earth, OpenStreetMap, and government open data.
These maps are edited visual materials, not raw data files, and are provided for education, documents, presentations, and graphic reference.