This page compares four land-cover maps for Lawrence County, Alabama, and provides the four matching original JPG files in one ZIP download. The 2025 summary is led by agriculture at 43.03 percent, followed by forest at 33.95 percent, wetlands at 10.40 percent, developed land at 7.82 percent, and water at 3.36 percent. The clearest countywide contrast is between the Tennessee River water along the north, broad agricultural areas across much of the northern and central county, and extensive forest toward the south.
The WebP images in the article are quick previews of general land cover, forest and farmland, impervious surface and developed land, and class differences from 1985 to 2025. The download section contains the corresponding 2480×1754-pixel JPG originals for classroom work, presentations, county comparisons, and personal reference. These products are not parcel surveys, zoning records, ownership maps, wetland jurisdiction determinations, or site-specific development guidance.
Table of Contents
A county divided among farms, forest, wetlands, and river water
Lawrence County does not have one land-cover type spread evenly from boundary to boundary. Water forms a strong visual edge along the north and northeast. Agriculture occupies broad areas immediately south of that river corridor and across much of the northern half, while forest becomes more prominent through the middle and dominates large areas near the southern end. Wetlands appear as repeated bands and patches rather than one isolated block. That arrangement matters because the countywide percentages alone cannot show where each class is concentrated.
| Reference | Annual NLCD 2025 |
|---|---|
| Agriculture | 43.03% |
| Forest | 33.95% |
| Wetlands | 10.40% |
| Developed land | 7.82% |
| Water | 3.36% |
| Grassland | 0.88% |
| Shrubland | 0.52% |
| Mean impervious surface | 1.61% |
| 1985→2025 class difference | 18.84% |
Land cover describes what the surface is classified as, not what a parcel is legally allowed to be used for. A cell may be labeled as agriculture, forest, water, wetland, or developed land based on remotely sensed characteristics, but that label does not establish property ownership, zoning, tax status, or a permit condition. The products on this page are therefore best used to compare broad county patterns. Parcel boundaries, regulatory wetlands, and local development decisions require different records and usually much finer detail.
The Lawrence County Commission highlights both the Tennessee River and Bankhead National Forest when describing the county’s natural setting. Those references help place two large patterns in context: the prominent water along the north and the strong forest signal in the south. The land-cover image does not show federal ownership boundaries, so the entire southern green area should not be treated as a National Forest boundary. It simply shows that forest cover is extensive in that part of the county.
The Tennessee River edge and the heavily forested south
The easiest feature to use as an orientation point is the broad water band across the northern edge. Lawrence County’s official website identifies the Tennessee River as a major local natural feature, and the supplied 2025 product shows a matching blue corridor along the county boundary. Water is only 3.36 percent of the county summary, yet its continuous position makes it visually more prominent than that percentage may suggest. Wetlands occur near the river corridor and in other low-lying areas, adding a second water-related class that should not be confused with open water.
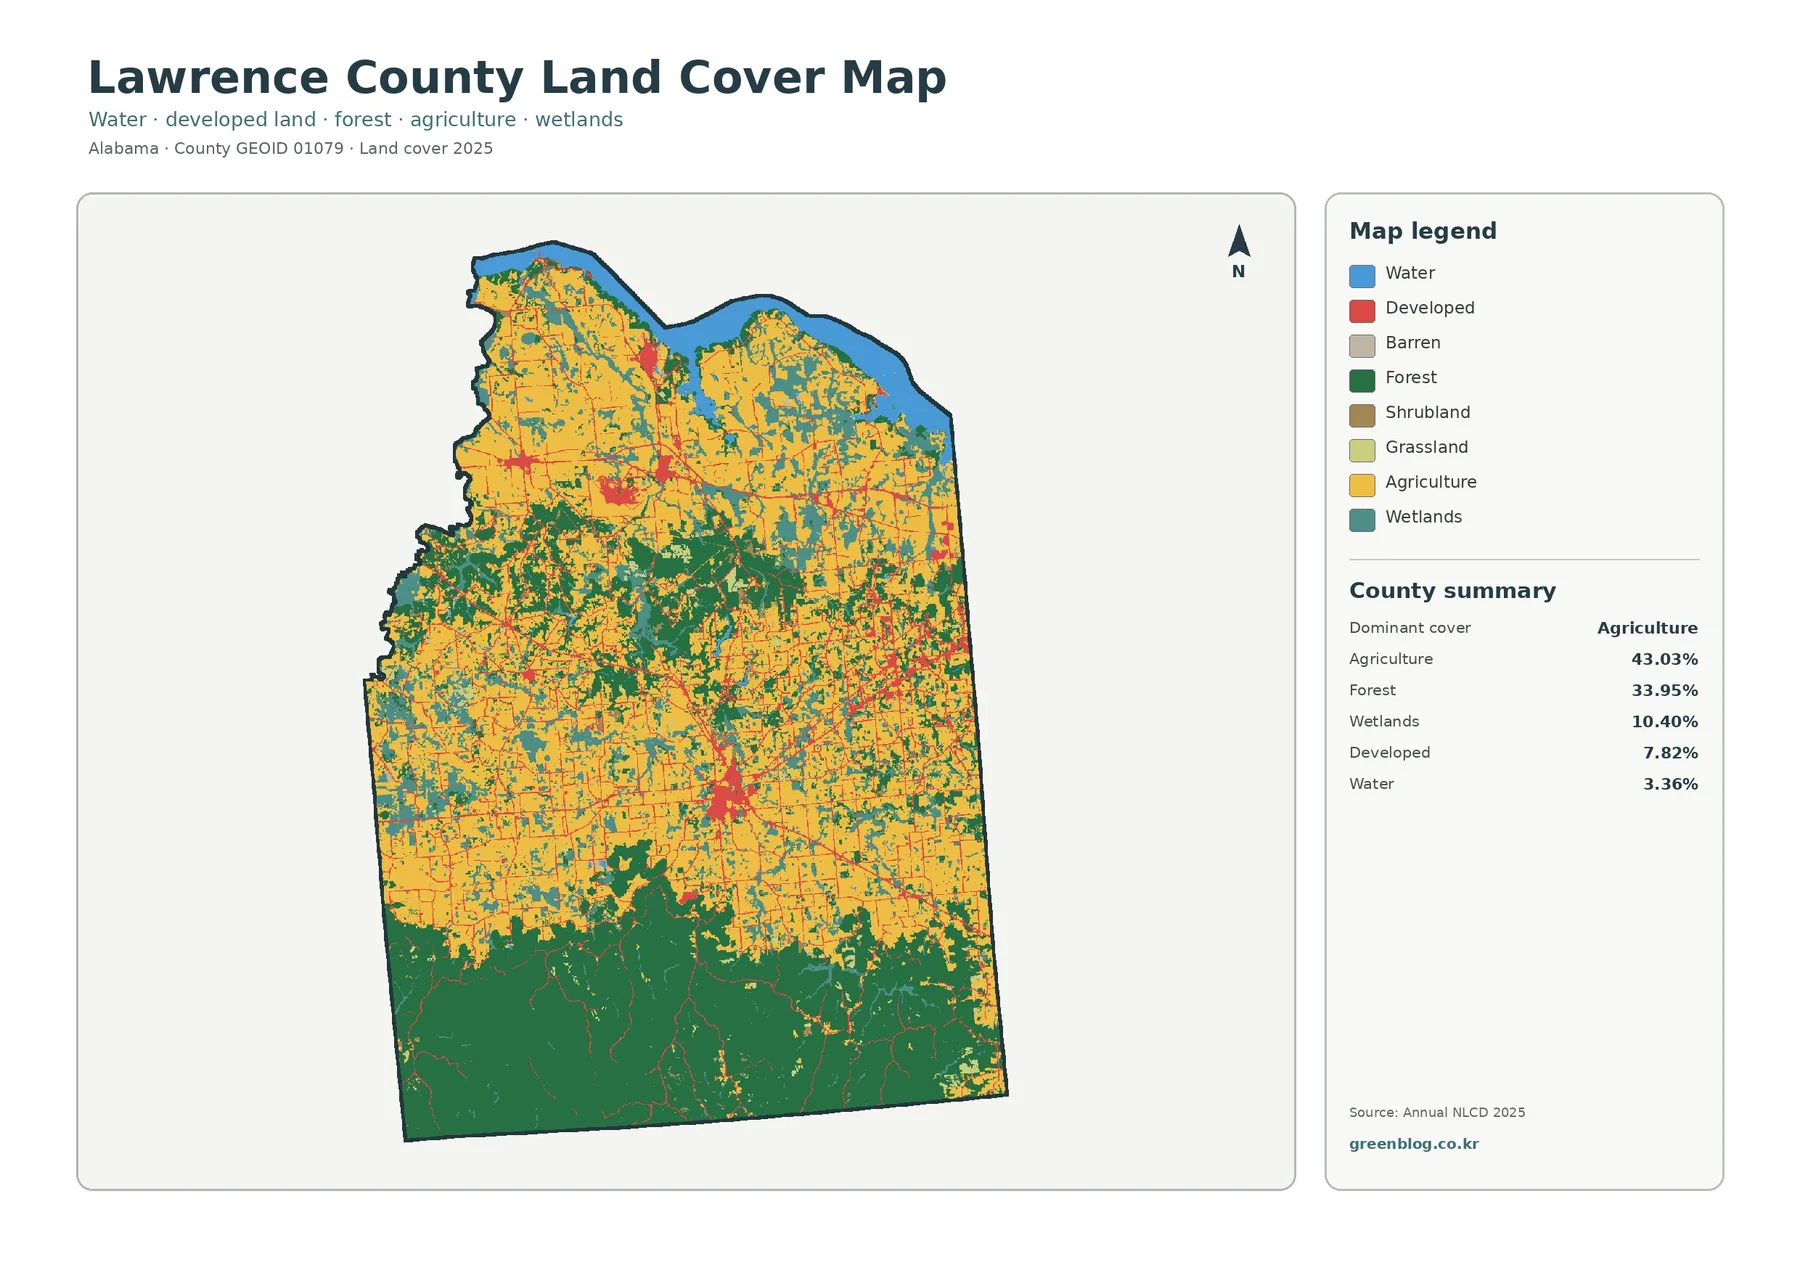
Southward, the palette changes sharply. Large forest blocks become more common while agricultural color decreases, particularly near the southern boundary. Bankhead National Forest is one of the natural places identified by Lawrence County government, which provides useful regional context for the forested character of the county’s south. Still, this image is a land-cover classification rather than a public-land ownership product. A green cell indicates forest cover; it does not tell the reader whether that particular location is federal, state, county, or private property.
Wetlands account for 10.40 percent, a substantial share compared with many of the smaller classes. They are visible as repeated patches and corridors around water and between agricultural and forest areas. Their distribution prevents the county from being reduced to a simple north-farm and south-forest split. Open water and wetlands also need to remain separate in interpretation: blue water represents surface water, while the wetland class represents land with wetland vegetation or conditions as classified by the dataset.
Where broad farmland gives way to mixed woodland
The forest-and-farmland view removes much of the visual competition from developed classes and makes the rural pattern easier to compare. Cropland and other agricultural cover are widespread across the north and central parts of Lawrence County. Forest is more continuous across the south, with another noticeable wooded band through the middle. Between those larger areas, forest and agriculture interlock in smaller pieces rather than meeting at a clean line. This is why the 43.03 percent agriculture and 33.95 percent forest figures are most useful when paired with location.
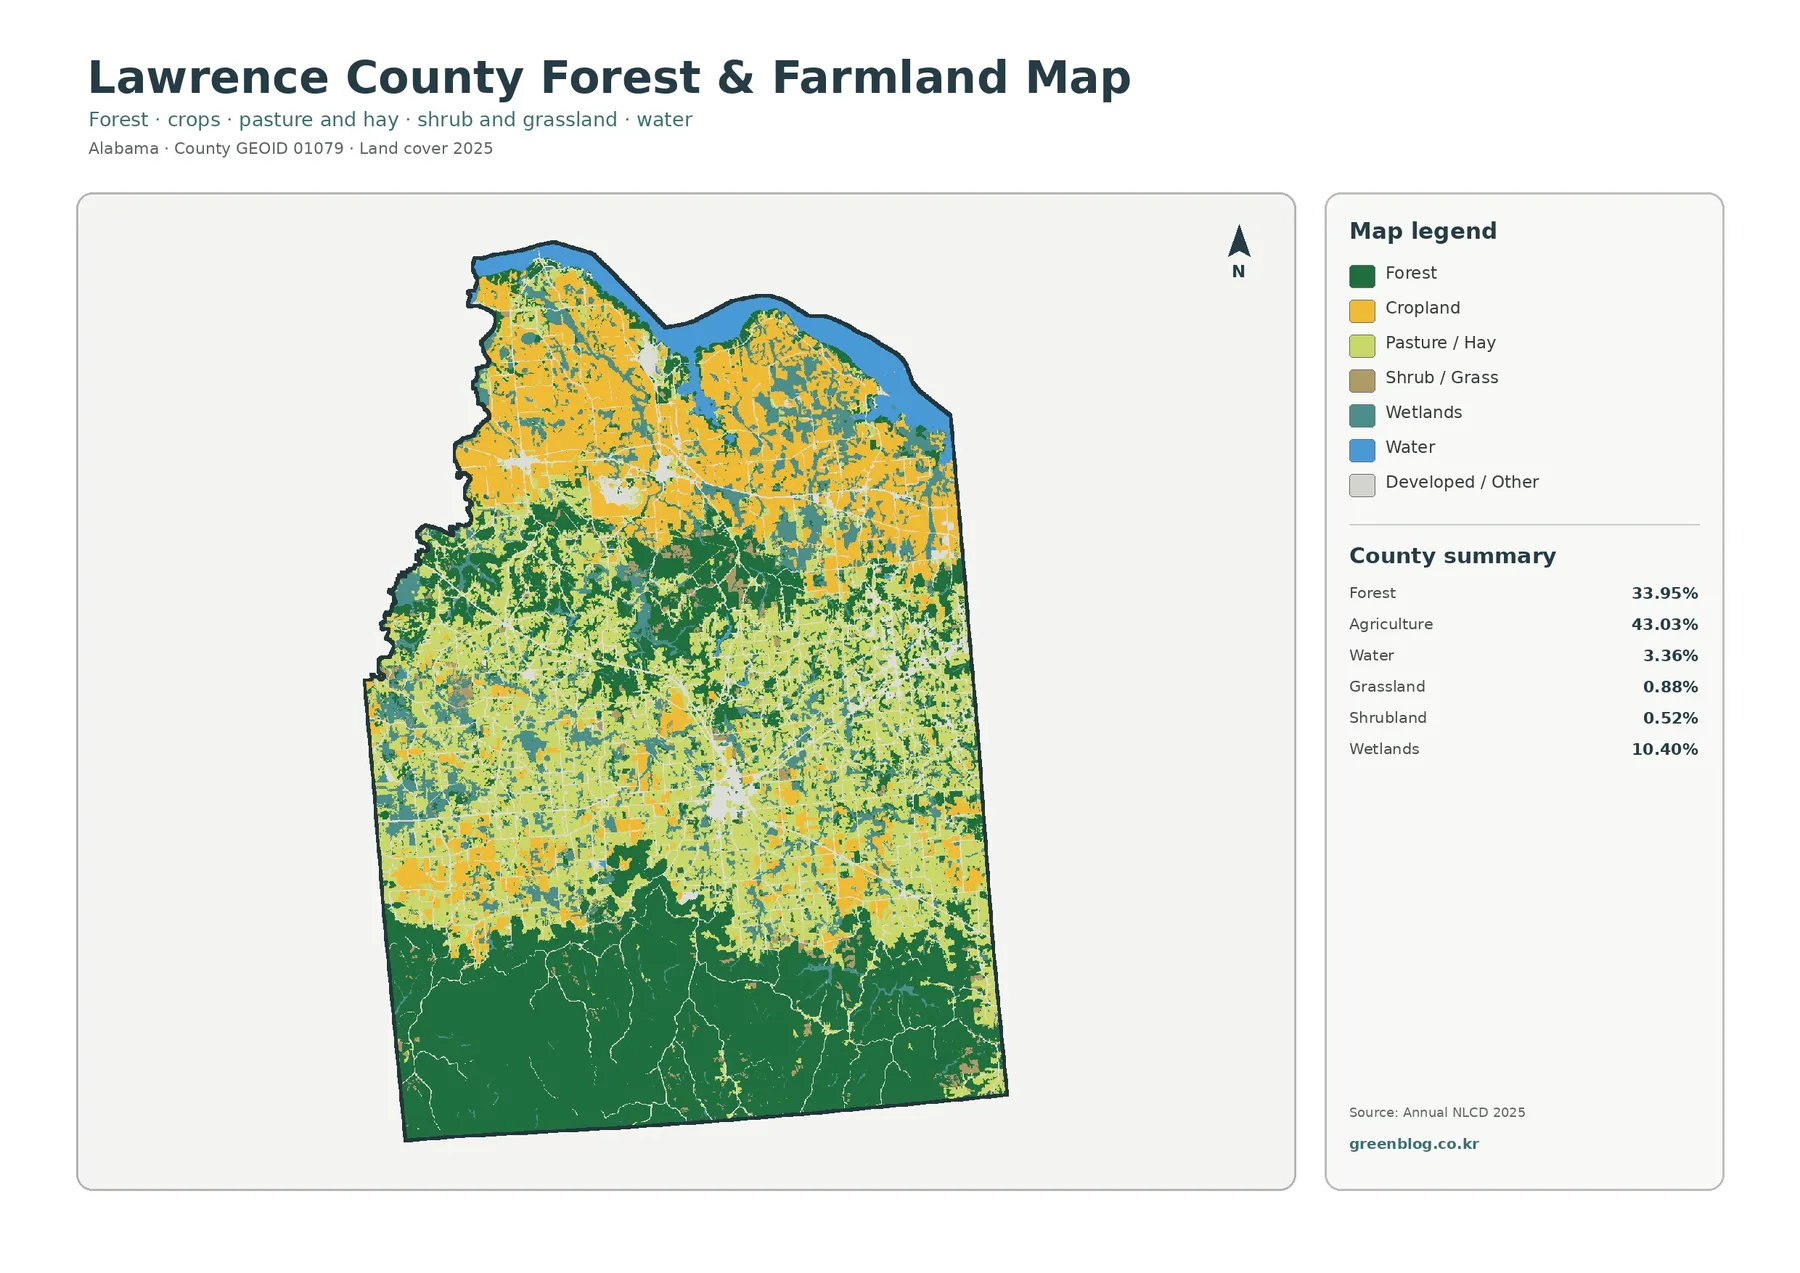
The agriculture category should not be read as a map of one crop. The supplied legend separates cropland from pasture and hay while also retaining shrub and grass classes. Grassland is 0.88 percent and shrubland 0.52 percent in the county summary, so neither is a dominant countywide class, but both help explain open areas that are not simply cropland or forest. Identifying a specific crop, grazing system, or farm boundary would require agricultural statistics or local records beyond this land-cover product.
The Alabama Cooperative Extension System maintains a Lawrence County office and lists expertise that includes agronomic crops, animal sciences and forages, and forestry, wildlife, and natural resources. That local resource is useful when a land-cover observation needs to be followed by information about farming or land management. The image answers where broad agricultural and forest classes occur; Extension and other local sources are more appropriate for questions about actual production practices, management decisions, or current programs.
Small impervious concentrations stand out in an otherwise rural county
Impervious surface means pavement, rooftops, and similar surfaces that do not readily absorb rainfall. Lawrence County’s mean impervious value is 1.61 percent, and only 0.72 percent of the county is summarized at 50 percent impervious or higher. Those values are much lower than the 7.82 percent developed-land share because developed classes can include lawns, trees, bare ground, and other permeable surfaces around homes, businesses, and roads. The two measures describe related but different things.
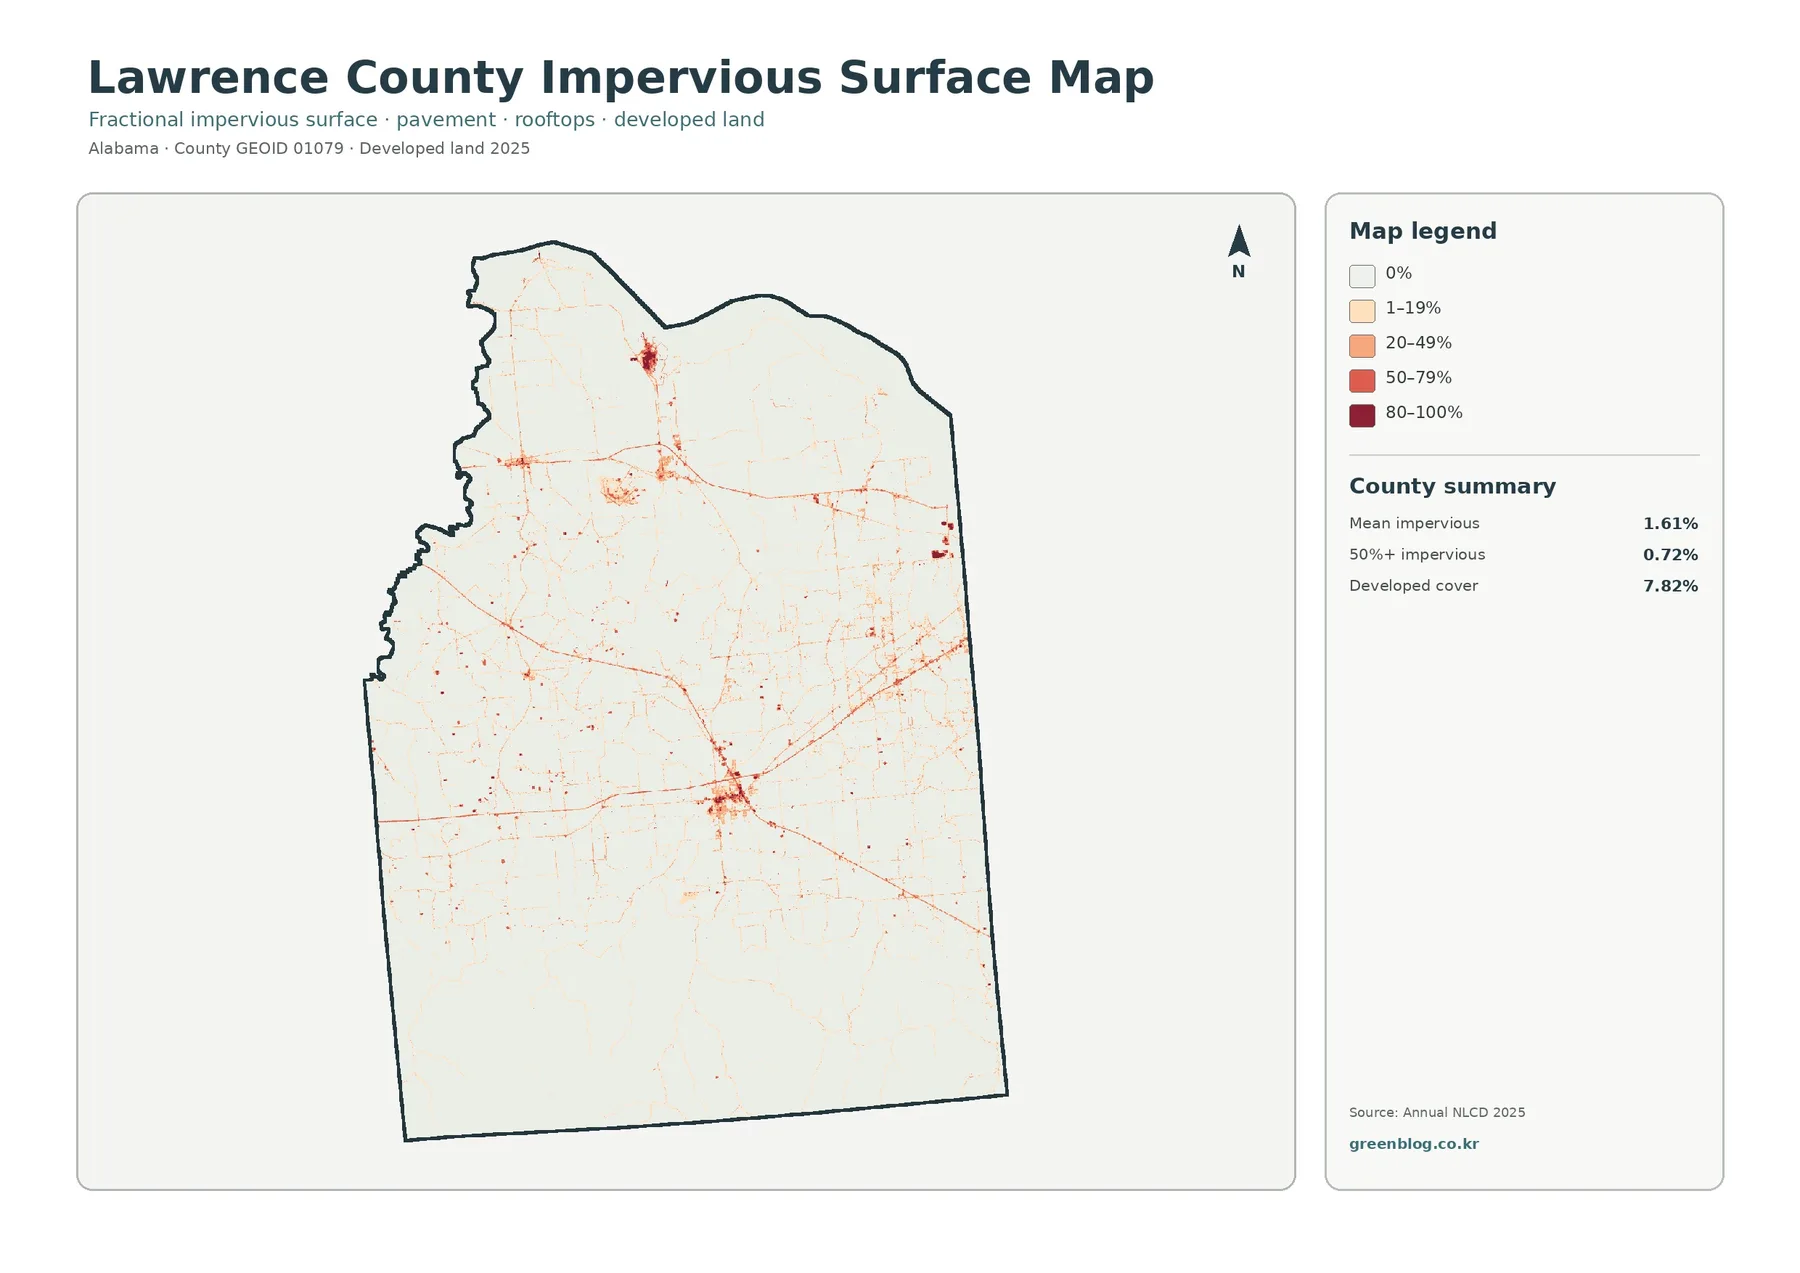
The strongest central cluster falls in the Moulton area, where Lawrence County government and the county Extension office are based. Smaller concentrations appear toward the northwest and east, connected by thin linear features that resemble major travel corridors. That co-location should be described carefully. The product supports the observation that roads, buildings, and developed surfaces are concentrated in the same areas; it does not establish that a particular road caused later development or that every line represents a specific named highway.
This view is particularly useful after looking at the general land-cover classification. A red developed cell in the general product does not necessarily contain a high percentage of pavement or roofs. Low-density residential areas can remain mostly permeable, while commercial or transportation surfaces may have much higher impervious values. Using the two products together separates the question of where developed land is classified from the question of where hard surfaces are most concentrated.
What the 1985–2025 comparison does and does not measure
The long-term comparison marks cells whose land-cover class differs between 1985 and 2025. The county summary reports an overall class difference of 18.84 percent. That number is not the same as the share converted to development and should not be presented as a forty-year development rate. The supplied summary separately identifies 1.73 percent classified as a transition to developed land, 2.62 percent as forest loss, 1.43 percent as agricultural loss, and 12.07 percent as other class differences. The legend also includes a distinct wetland-difference category.
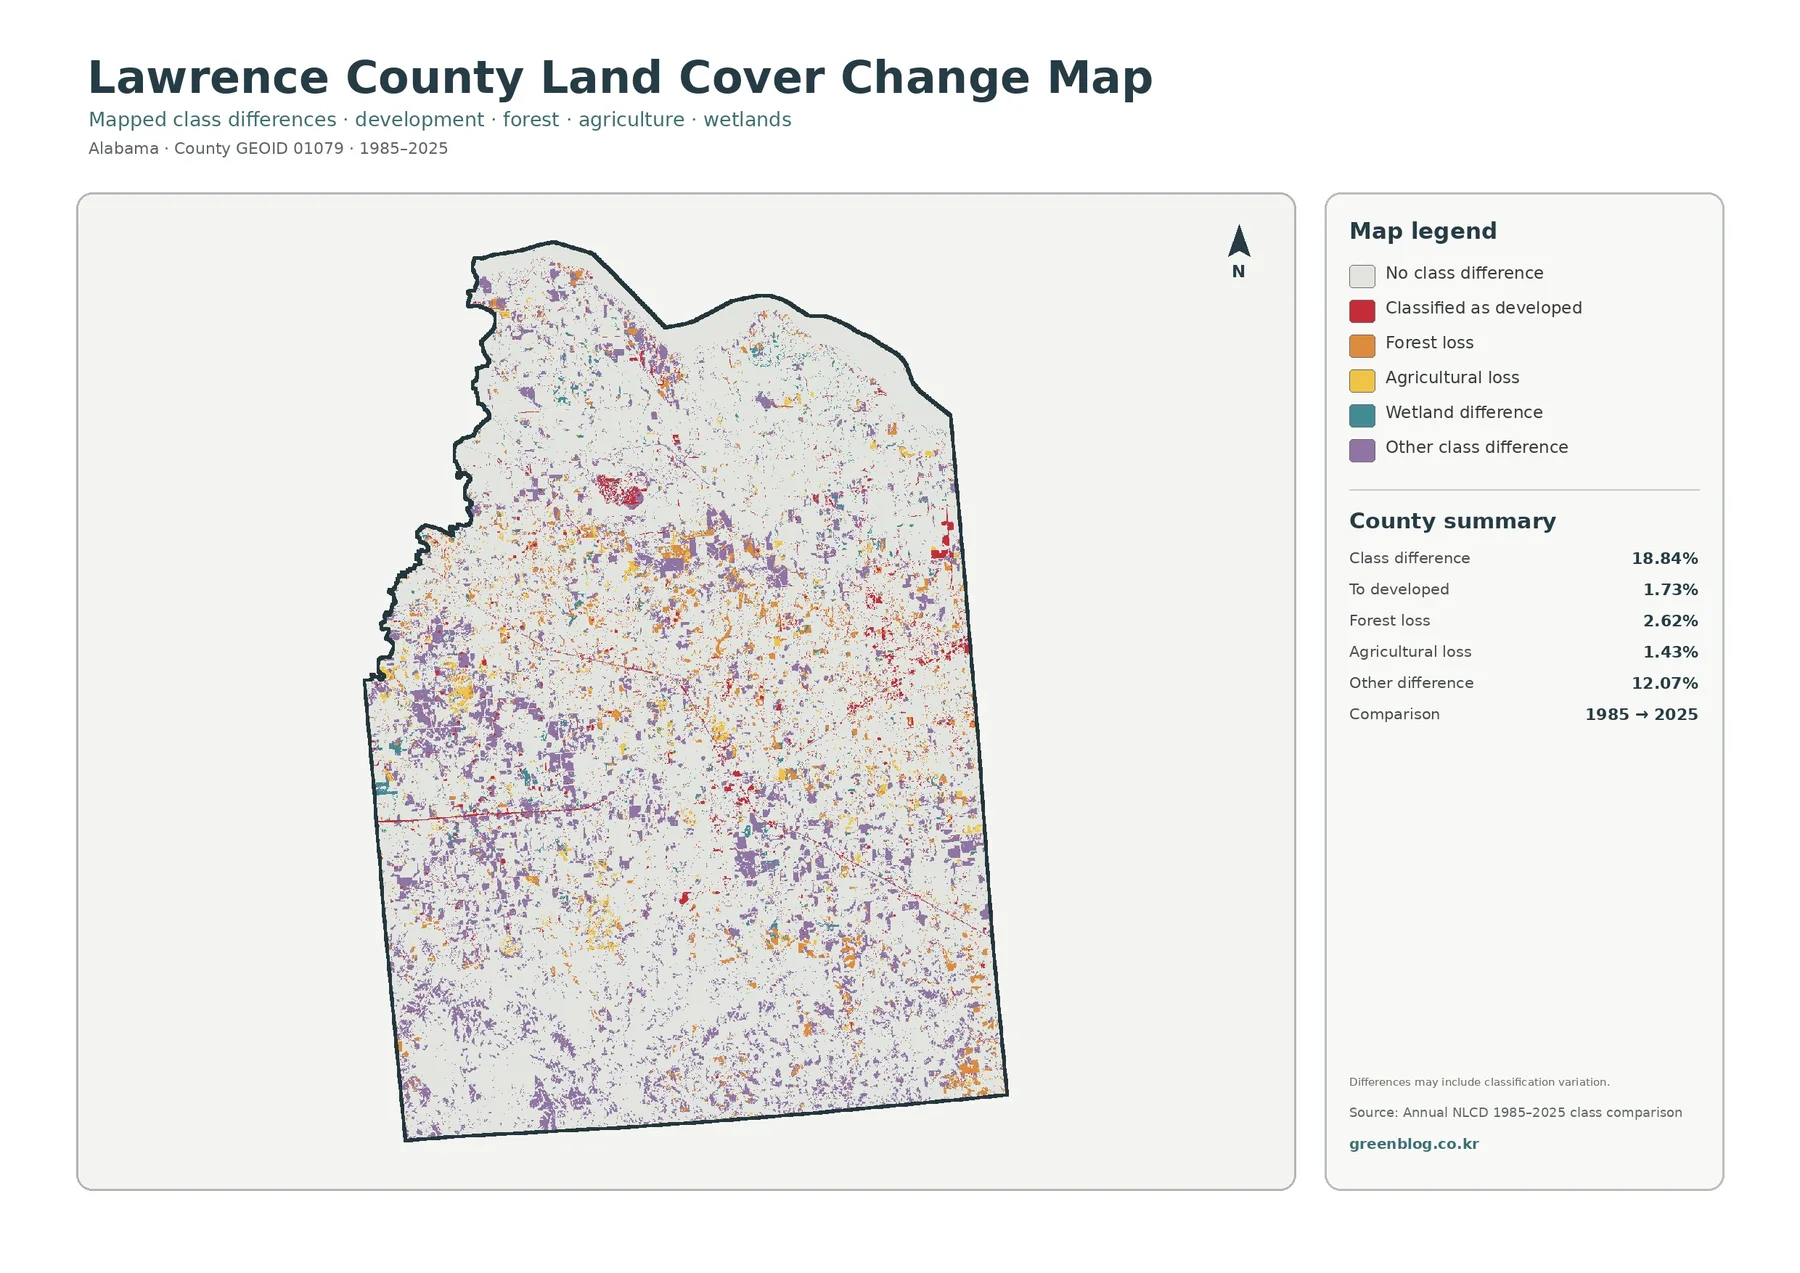
Colored cells occur across the county rather than forming one continuous front. Differences appear in agricultural areas, mixed central landscapes, and around forest edges. That pattern makes simple narratives risky. A reader cannot conclude from this product alone that forest steadily retreated in one direction or that development spread outward at a constant pace. The best use is to identify places where the two classifications differ and then consult annual data, aerial imagery, or local records when the timing and cause of a change matter.
The change product also warns that differences may include classification variation. Annual NLCD is based on raster cells, meaning the landscape is represented as a grid. A 30-meter-scale cell can contain more than one real-world surface, such as trees beside a road or wetland vegetation next to open water. Changes in imagery, classification, or which surface dominates a mixed cell can alter the class label even when the ground change is subtle. Small real changes can also be generalized by the cell size.
Choosing the right view for teaching, printing, and comparison
For a general county introduction, the full land-cover view is the most efficient starting point because it places agriculture, forest, water, wetlands, and development in one frame. A lesson focused on rural landscape differences can move to the forest-and-farmland view, where the north-to-south contrast is easier to see. The impervious product is better when the question concerns concentrated pavement and rooftops. The 1985–2025 comparison should be reserved for questions about where class labels differ over time.
A useful classroom exercise is to compare the percentages with their spatial distribution. Agriculture ranks first at 43.03 percent, yet the southern end of Lawrence County is visually dominated by forest. Students can then compare the 7.82 percent developed share with the much lower 1.61 percent mean impervious surface and discuss why a developed classification can still contain grass, trees, and other permeable surfaces. The Tennessee River edge also provides a clear reference feature for orienting each image.
County-to-county comparisons work best when the same data year and class definitions are used. A 2025 Lawrence County product should not be compared casually with a different county’s older classification and treated as if the difference were entirely geographic. River counties, heavily forested counties, and counties with larger urban centers can also have similar percentages arranged in very different patterns. Location, continuity, and clustering often add more meaning than a ranked list of percentages alone.
Reading the classes without turning them into parcel facts
Annual NLCD is valuable because it applies a consistent national classification across large areas, but it is not a field survey of every tree, building, ditch, or property line. Raster cells generalize fine detail, and mixed pixels can contain several real surfaces even though one class is assigned to the cell. Narrow streams, small structures, scattered trees, and field edges may therefore appear simplified. The products are strongest for county-scale patterns rather than exact measurements at a house or parcel.
The 10.40 percent wetland figure is also a land-cover classification, not a legal wetland determination. Regulatory decisions require separate official delineation and agency procedures. The same distinction applies to agricultural and forest classes: 43.03 percent agriculture does not establish farm ownership or tax classification, and 33.95 percent forest does not specify tree species, stand age, timber value, or harvest restrictions. Those questions require specialized records or field information.
Keep the reference year visible when reusing an image. The general distribution, forest-and-farmland, and impervious products are labeled for 2025, while the comparison spans 1985 to 2025. If more recent construction, clearing, flooding, or vegetation change has occurred after the observation year, it will not automatically appear in these files. For current site decisions, the land-cover images should be treated as background context and checked against newer local or agency information.
Download the four original JPG files
The ZIP below contains the original JPG versions corresponding to the four WebP previews in the article: general land cover, forest and farmland, impervious surface and developed land, and the 1985–2025 class comparison. Each JPG is 2480×1754 pixels. Use the ZIP when you need a larger file for printing, slides, a classroom handout, or a side-by-side county comparison rather than the lighter page preview.
Frequently Asked Questions
What is the largest land-cover category in Lawrence County?
Agriculture is the largest 2025 category at 43.03 percent, followed by forest at 33.95 percent. Agriculture is especially broad across the north and central county, while forest becomes much more prominent toward the south, so the countywide ranking should be read together with location.
What is the broad blue feature along the northern edge?
It corresponds to the Tennessee River water corridor, a natural feature also highlighted by Lawrence County government. The blue class indicates open water in the land-cover product; it does not show depth, navigation conditions, flood risk, or water quality.
Does the 18.84% class difference mean that much land was developed?
No. The 18.84 percent figure is the share of cells whose class differs between 1985 and 2025. Transition to developed land is separately reported at 1.73 percent, while forest loss is 2.62 percent, agricultural loss 1.43 percent, and other class differences 12.07 percent. Classification variation can also contribute to the comparison.
What files are included in the download?
The ZIP contains four 2480×1754-pixel JPG files: general land cover, forest and farmland, impervious surface and developed land, and the 1985–2025 class comparison. The article uses lighter WebP previews of the same four products.
Map File Information
Lawrence County Land Cover – 4 JPG Files
- Included Files: Use only the versions confirmed in the article and supplied images
- File Type: Use the confirmed download contents
- Intended Use: Printing, education, presentations, and map-based projects
Related Maps
- Autauga County Alabama Land Cover Map
- Baldwin County Alabama Land Cover Map
- Barbour County Alabama Land Cover Map
Data and reference sources
The percentages and change values discussed above come from the supplied Annual NLCD 2025 products and the 1985–2025 class comparison. The following official sources provide classification documentation, boundary data, and county-specific context for Lawrence County’s landscape and land-management information.
- MRLC Annual NLCD Data
- USGS Annual NLCD Land Cover Classification
- U.S. Census Bureau TIGER/Line Shapefiles
- Lawrence County Commission
- Alabama Cooperative Extension System – Lawrence County
Green Map creates custom-edited map images using open geographic data sources such as geoBoundaries, Natural Earth, OpenStreetMap, and government open data.
These maps are edited visual materials, not raw data files, and are provided for education, documents, presentations, and graphic reference.