This page provides four Lee County Alabama land cover maps for comparing general land cover, forest and farmland, impervious surface and developed land, and change from 1985 to 2025. Forest is the largest 2025 class at 51.56 percent, while the clearest developed concentration sits near the center of the county and smaller agricultural areas are scattered across several sections.
The four original JPG maps are available together in one ZIP download. The lighter WebP previews below are for quick on-page viewing, while the JPG set is useful for printing, classroom work, presentations, and county-to-county reference. These maps show broad land-cover patterns rather than parcel ownership, zoning, survey boundaries, building rights, or regulatory wetland limits.
Table of Contents
The 2025 pattern at a glance
Forest provides the largest visual background in Lee County. At 51.56 percent, it covers more than half of the county and remains extensive around many of the outer and eastern sections. That majority does not mean the county is an unbroken woodland. Developed areas, agricultural patches, wetlands, grassland, and shrubland interrupt the forest in different ways, creating a much more varied surface pattern than the headline percentage suggests.
| Measure | Annual NLCD 2025 |
|---|---|
| Forest | 51.56% |
| Developed | 18.66% |
| Agriculture | 12.77% |
| Wetlands | 6.03% |
| Grassland | 4.65% |
| Shrubland | 4.26% |
| Water | 1.60% |
| Mean impervious surface | 4.98% |
| Area at 50%+ impervious | 2.79% |
| 1985→2025 class difference | 40.33% |
Land cover is a description of what is physically covering the ground, not a legal land-use designation. The classification groups raster cells into categories such as forest, agriculture, water, wetland, and developed land. A developed cell is not the same thing as a zoning district, and an agricultural cell is not proof that a particular parcel is legally classified as farmland. The product is most useful for broad landscape comparison rather than parcel-level decisions.
Regional context helps explain one of the strongest visual patterns. The City of Opelika describes Auburn and Opelika as contiguous cities within the one-county Auburn–Opelika metropolitan area, and identifies Opelika as the Lee County seat. The broad central concentration of developed cover in the supplied image is consistent with that urban setting. The image itself does not draw municipal boundaries, however, so the colored area should not be treated as an exact city-limit outline.
Forest dominates, but agriculture remains widely scattered
The general 2025 product shows deep green forest across much of the county, especially beyond the largest developed concentration. Agriculture accounts for 12.77 percent, yet its visual reach is broader than that number may imply because fields appear as many separate patches rather than one compact block. Agricultural colors are especially noticeable through southern and western sections and in smaller openings elsewhere. The result is a patchwork in which forest, farms, and developed land often sit close to one another.
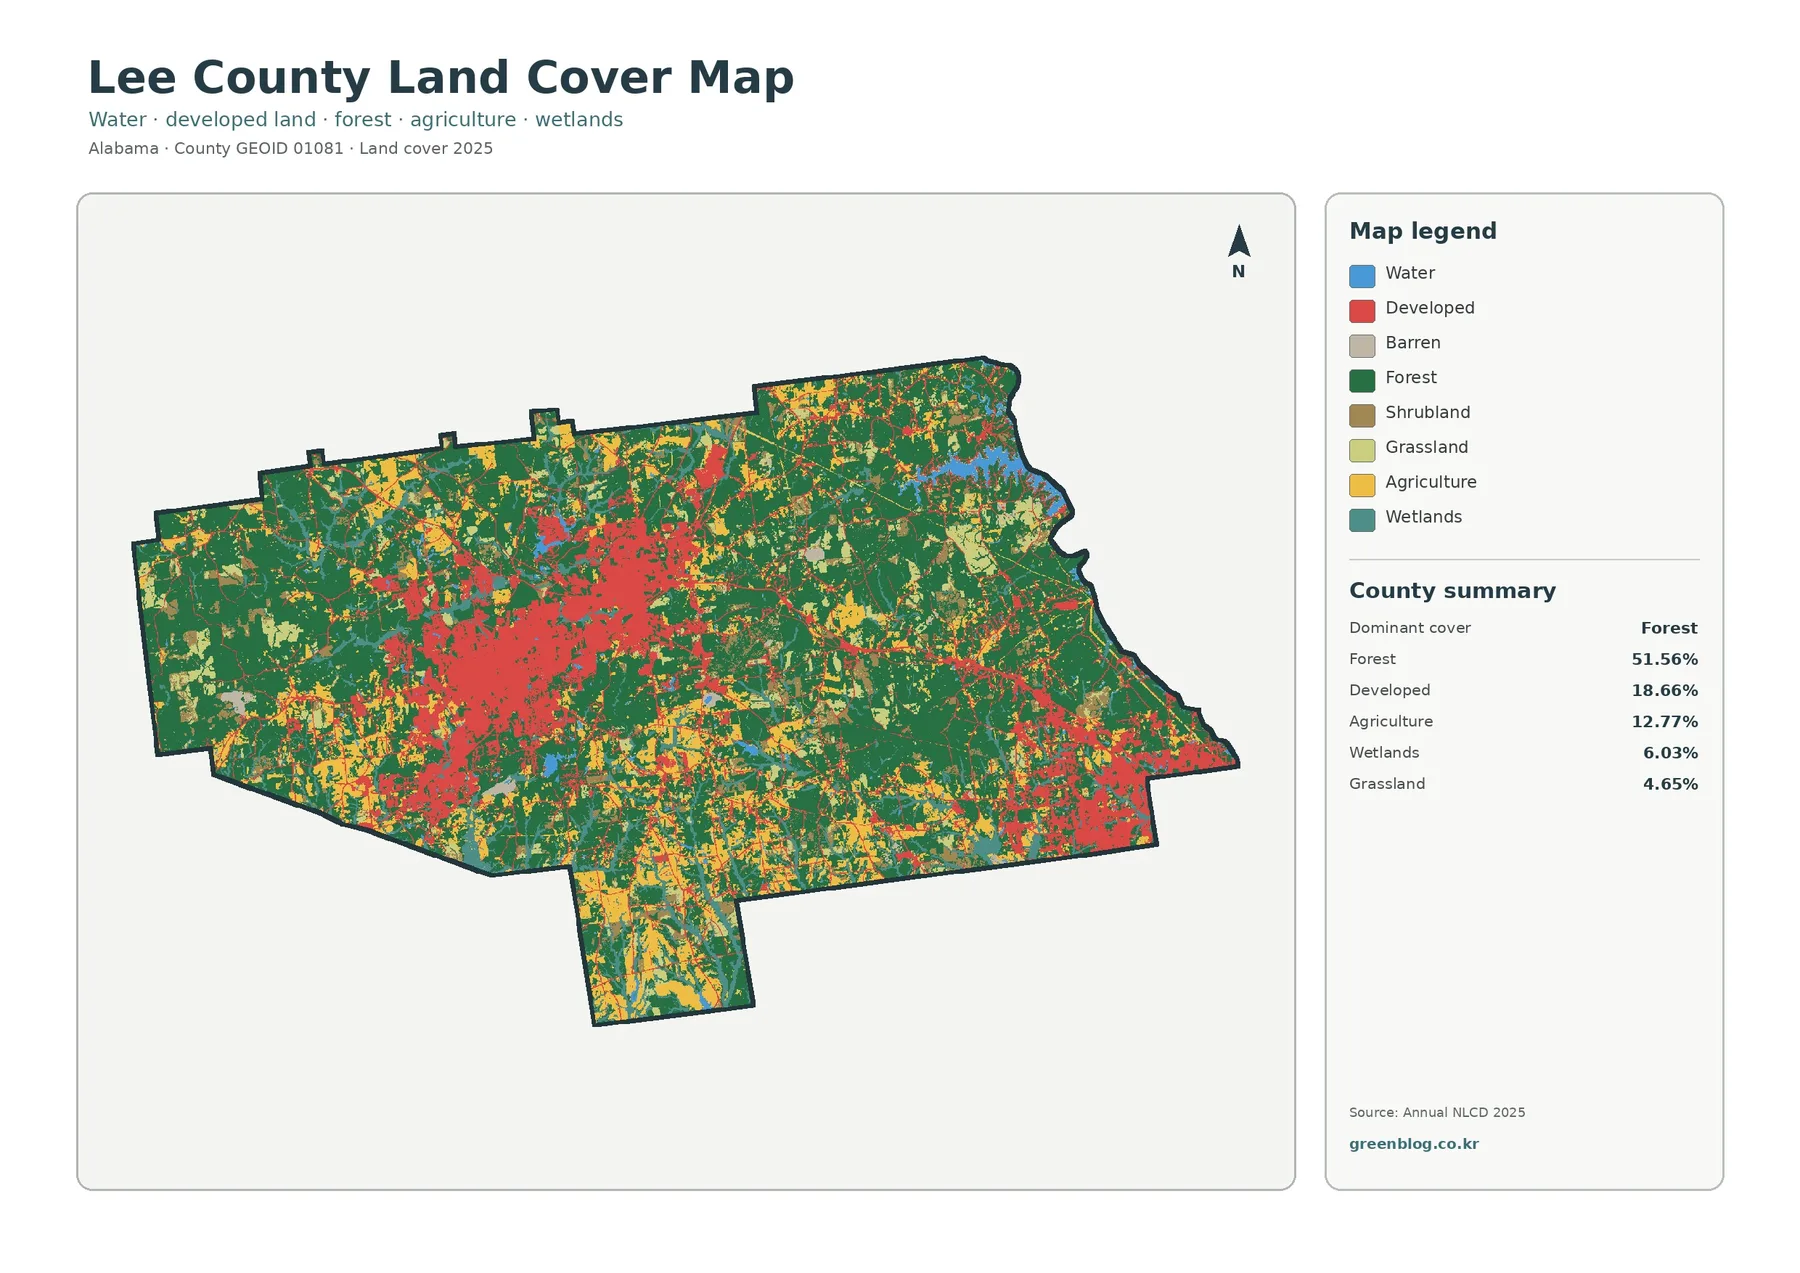
Wetlands make up 6.03 percent of the summary. They appear in narrow and irregular pieces among forest and agricultural areas rather than as one large block. Open water is only 1.60 percent, but small water bodies and drainage-related features still help break up the interior pattern. Grassland at 4.65 percent and shrubland at 4.26 percent add another layer of open or transitional cover. Those smaller categories matter because they explain areas that would otherwise be oversimplified as either forest or farmland.
A closer view of woodland and farm cover
The forest-and-farmland product removes much of the visual competition from the developed classes and makes rural cover easier to compare. Forest still forms the dominant dark-green network, while cropland and pasture or hay appear as brighter openings of different sizes. The largest developed center becomes a pale area surrounded by forest and agricultural land, making the transition from the urbanized core to the county’s rural surroundings easier to follow.
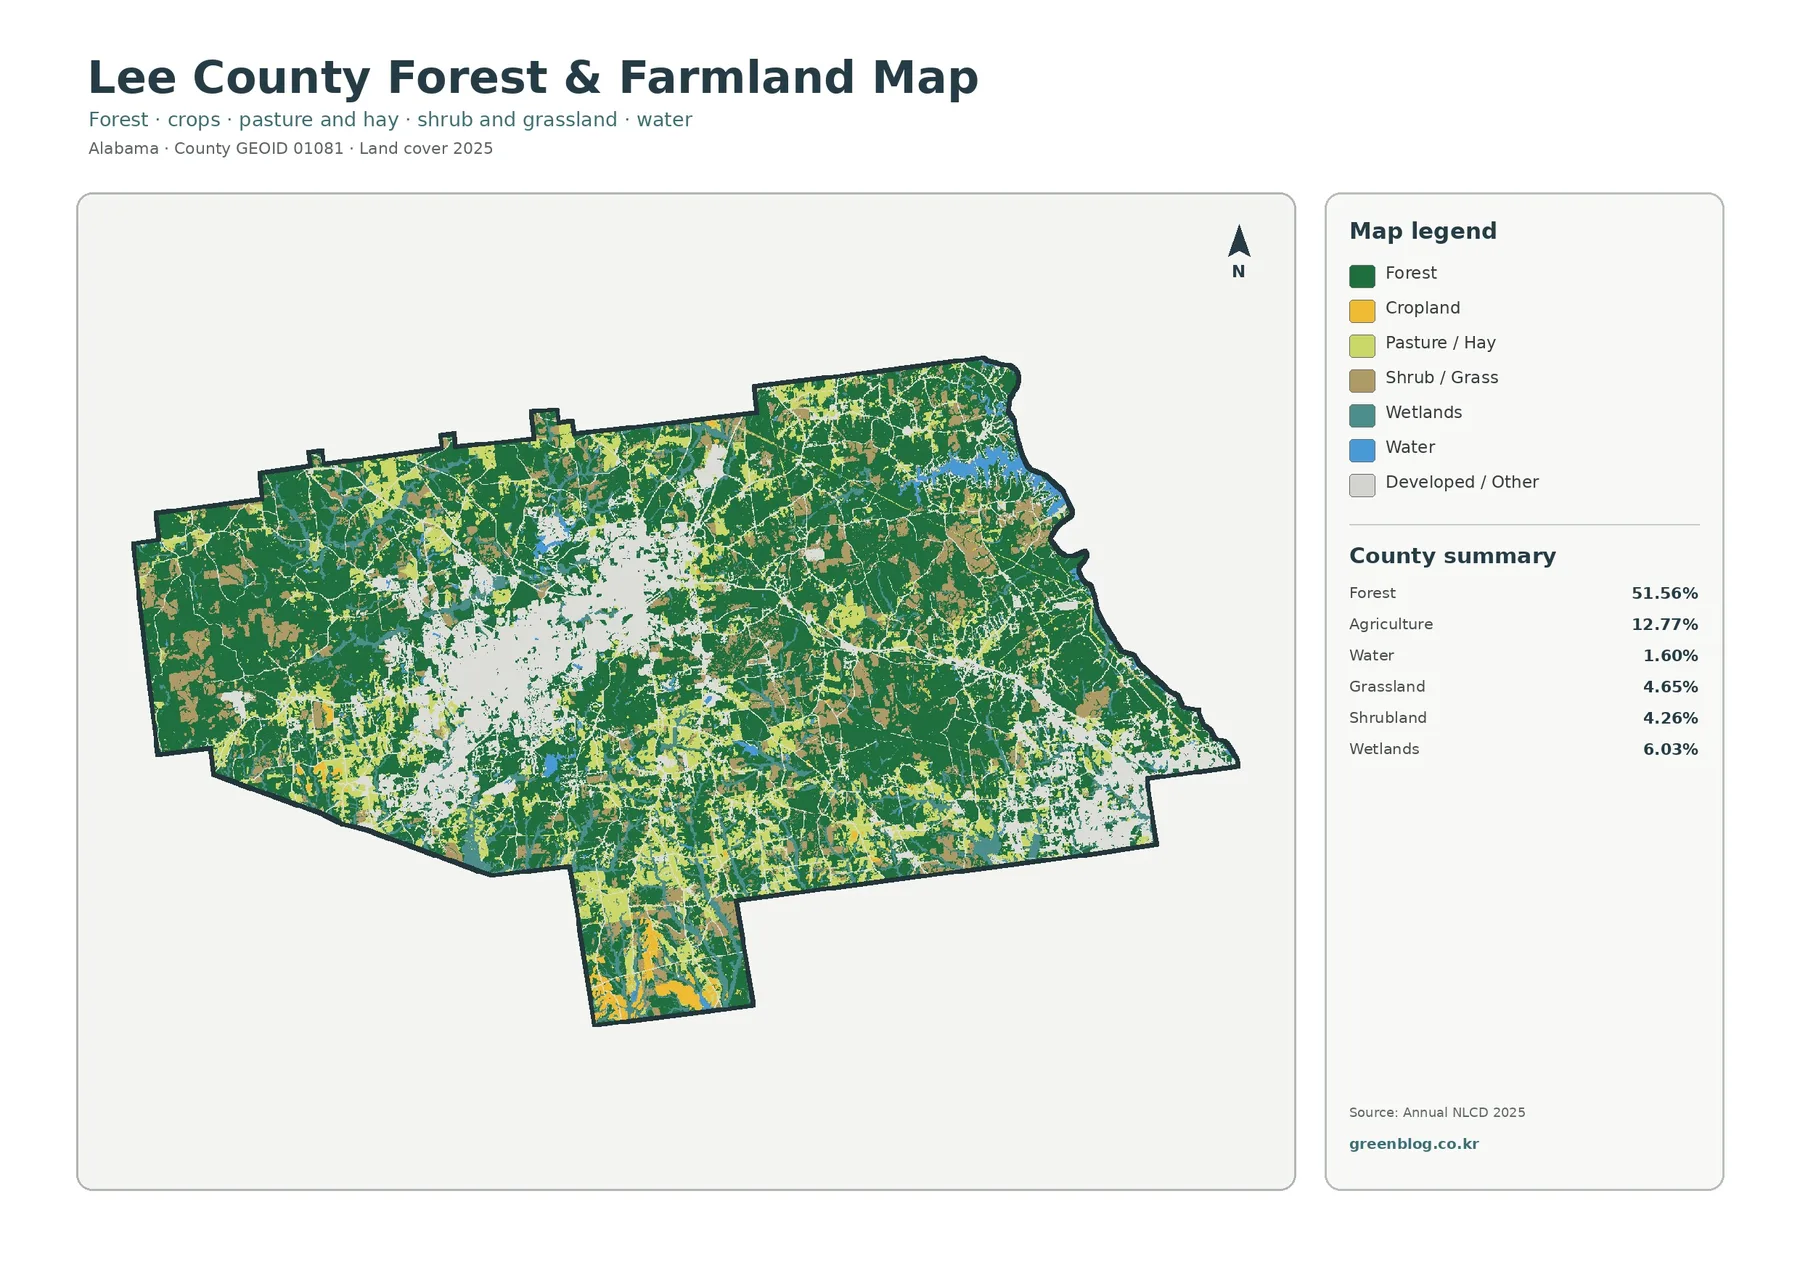
Agriculture on this product should not be read as a single crop. The legend separates cropland from pasture and hay, while the county summary reports agriculture as a broader 12.77 percent category. The image can show where agricultural cover is concentrated, but it cannot identify a crop variety, farm operator, ownership pattern, or annual production level. Those questions require agricultural statistics or local records rather than a land-cover classification.
County-specific extension resources provide useful context without changing what the image itself says. Alabama Cooperative Extension’s Lee County material lists agronomic crops, livestock and forages, forestry, wildlife, and pond management among local program areas. That combination reflects the practical importance of both working lands and natural resources in the county. For research, it is helpful to use the image for location and pattern, then turn to Extension or another specialist source for management practices and current local conditions.
Developed cover is concentrated rather than evenly spread
Developed land is the second-largest reported class at 18.66 percent. Its distribution is very different from the forest majority. A broad concentration occupies the central part of the county, with many smaller developed traces extending outward. A separate concentration appears near the southeastern edge. Large sections farther from those centers remain much less developed, which is why the countywide percentage should not be interpreted as if nearly one-fifth of every local area has the same built character.
Opelika’s official location information identifies the city as the county seat and notes that it lies along Interstate 85 with U.S. 29, U.S. 280, and U.S. 431 serving the city. It also describes Auburn and Opelika as contiguous. That context is useful when considering the large central developed concentration, but the supplied land-cover product does not label individual roads. The safest interpretation is that development and transportation surfaces are concentrated through the central urban area, not that every thin developed line can be assigned to a named highway from this image alone.
What the impervious percentages mean
Impervious surface refers to pavement, rooftops, parking areas, and similar surfaces that do not readily absorb rainfall. Lee County’s mean impervious value is 4.98 percent, while 2.79 percent of the county is summarized as having at least 50 percent impervious cover within the mapped cells. Those numbers are much lower than the 18.66 percent developed-cover figure because developed classes can include lawns, trees, soil, and other surfaces that still allow water to infiltrate.
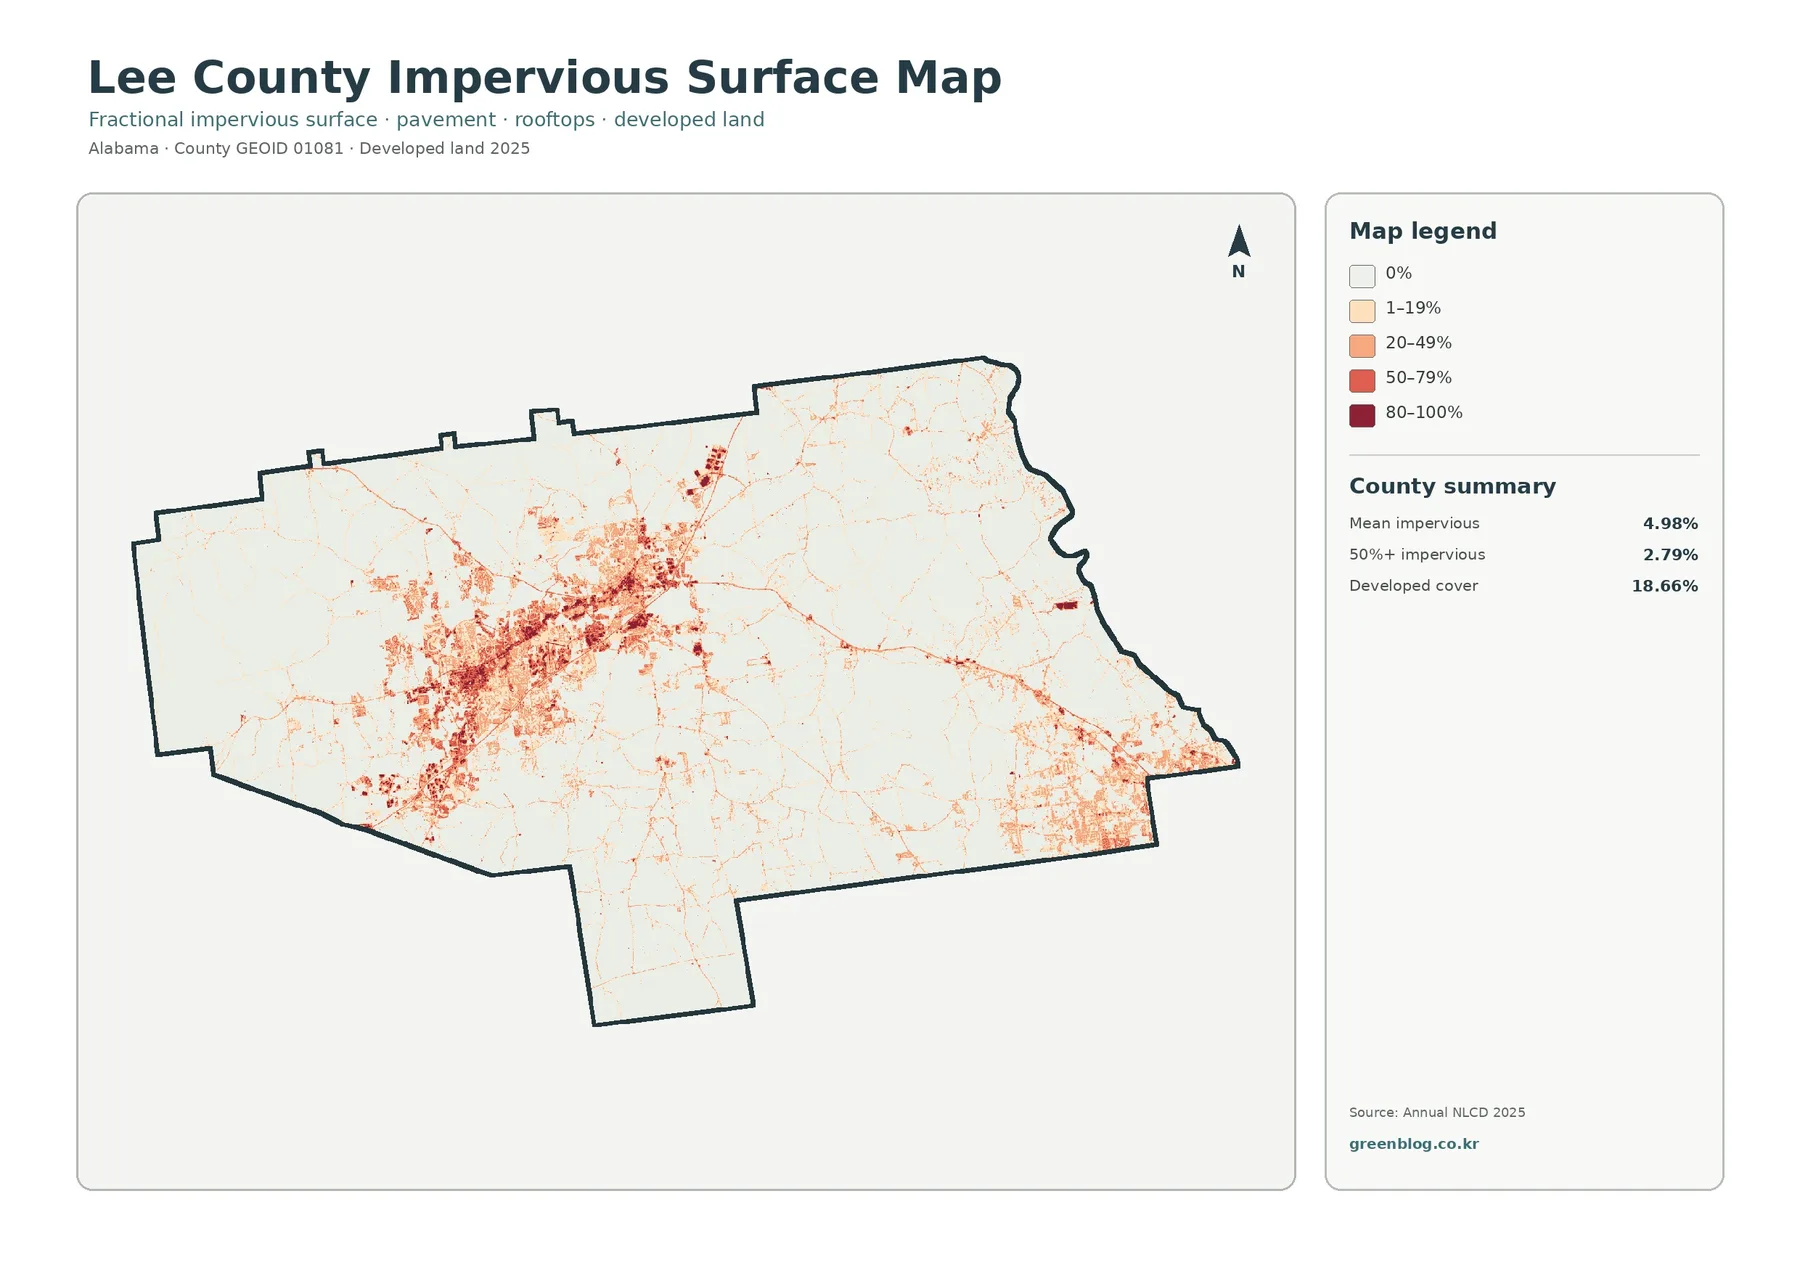
The central area contains the largest and darkest concentration of impervious surface. Thin lines and smaller clusters extend beyond it, and another group is visible toward the southeast. Most of the county outside those areas is very light on this product. That contrast is useful when discussing runoff, urban surface cover, or the difference between a broadly developed class and heavily paved cells. It is not, by itself, a flood-risk or drainage-capacity analysis.
The 2.79 percent figure for cells above 50 percent impervious should also be read carefully. It does not mean that 2.79 percent of Lee County is completely covered by concrete or asphalt. It means those cells cross a specified fractional-impervious threshold. Because each raster cell can contain more than one surface type, a cell can be categorized above 50 percent while still containing vegetation or soil. Keeping the threshold definition visible prevents the impervious product from being overstated.
Reading the 1985–2025 comparison without overstating change
The long-term comparison reports a 40.33 percent class difference between 1985 and 2025. That is a large share of cells, but it is not a 40.33 percent development rate. The change product separates cells classified as developed, forest loss, agricultural loss, wetland difference, and other class difference. A note on the image also warns that differences may include classification variation, which is important when comparing products separated by four decades.
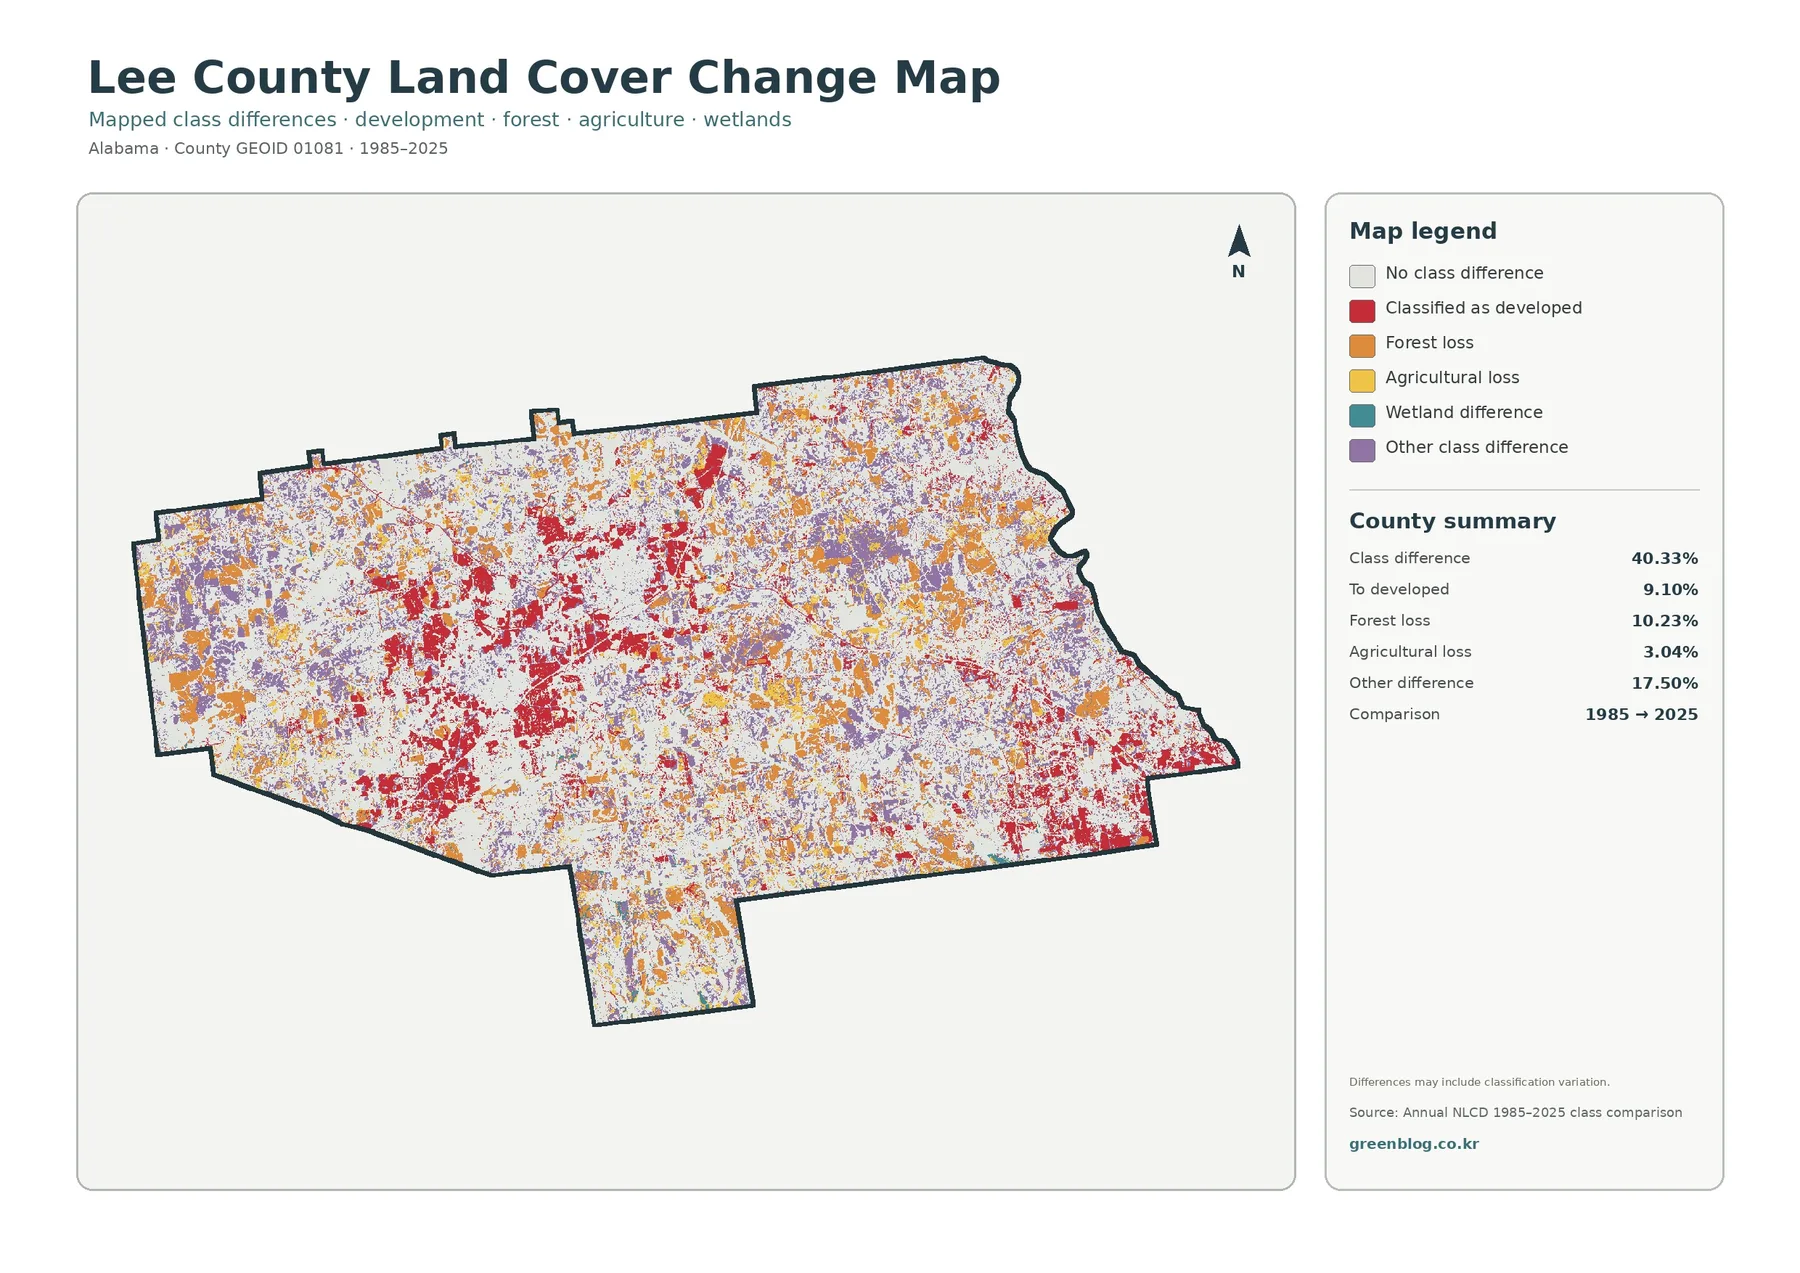
The visible summary lists 9.10 percent as transition to developed, 10.23 percent as forest loss, 3.04 percent as agricultural loss, and 17.50 percent as other difference. These categories answer different questions and should not be combined into a single claim about urban growth. Forest loss, for example, does not automatically mean conversion to buildings. A cell may have changed to another nonforest class, and some differences can reflect classification behavior rather than a single on-the-ground cause.
Spatially, the red developed-change class is most noticeable around the main central concentration and in the southeastern developed area, while forest-loss and other-difference colors are spread much more widely. That overlap with present-day developed cover is useful for orientation, but it still does not identify the cause, date, or project behind a particular change. Local planning records, historical aerial imagery, or field information would be needed to answer those questions.
Practical use for printing, teaching, and county comparison
The general 2025 view works best when the goal is to explain the whole county in one image. It quickly establishes the forest majority, the scale of the central developed area, and the scattered agricultural and wetland cover. The forest-and-farmland version is better when urban classes would distract from a lesson about rural land cover. The impervious product adds detail inside developed areas, while the long-term comparison is the appropriate choice when the topic is how classification differs between 1985 and 2025.
For county-to-county comparison, use the same sequence each time. Start with the category percentages, then examine where those categories are concentrated. Next compare developed cover with the impervious measures, because the two are related but not interchangeable. Finally, look at the long-term class comparison and keep its separate change categories visible. In Lee County, the contrast between 18.66 percent developed cover and 4.98 percent mean impervious surface is a particularly useful example of why one built-land indicator cannot stand in for another.
For printed handouts or presentation slides, the original JPGs are preferable to the smaller WebP page previews. Each file is 2480×1754 pixels and includes its legend and summary panel. If the legend text becomes too small on a slide, place the image on one slide and repeat only the key percentages as text on the next. When citing the products, keep the reference year visible: the current-cover products are labeled 2025, while the comparison spans 1985 through 2025.
Limits to keep in mind
County-scale land-cover classifications generalize the ground into raster cells. A single cell can contain trees, pavement, lawns, water, or soil in different proportions, so the classification may simplify a mixed surface. Edges between forest and development or between farmland and wetland can therefore appear less precise than parcel lines. The product is designed for broad pattern recognition, not for surveying a property boundary or measuring a small site.
Time matters as well. The general cover, forest-and-farmland, and impervious products are labeled for 2025, and the change comparison uses 1985 and 2025. Construction, clearing, vegetation recovery, or water changes after the observation year will not automatically appear. A current site decision should be checked against newer aerial imagery, local government information, and field conditions.
Wetlands deserve a separate caution. The 6.03 percent wetland class describes mapped surface cover; it is not a regulatory wetland determination. Likewise, the developed class does not grant development rights, and the impervious product does not replace stormwater, drainage, or flood studies. Used within those limits, the four products are still valuable for understanding the county’s broad relationship among forest, working land, built areas, water-related cover, and long-term class differences.
Download the four original JPG files
The ZIP below contains the original JPG versions corresponding to the four WebP previews in the article: general land cover, forest and farmland, impervious surface and developed land, and the 1985–2025 class comparison. Each JPG is 2480×1754 pixels. Use the ZIP when you need a larger file for printing, slides, classroom materials, or a consistent set for comparing Lee County with another county.
Frequently Asked Questions
What is the largest 2025 land-cover category in Lee County?
Forest is the largest category at 51.56 percent. Developed cover follows at 18.66 percent and agriculture at 12.77 percent. Forest is widespread, while developed cover is much more concentrated in the central county and another southeastern area.
Why is developed cover 18.66% while mean impervious surface is only 4.98%?
Developed land is a land-cover class that can include vegetation and soil around homes, businesses, and roads. Impervious surface measures the fraction covered by pavement, rooftops, and similar materials. Because developed areas are not completely paved, the two percentages are expected to differ.
Does the 40.33% class difference mean that much of the county was developed?
No. The 40.33 percent figure is the overall share of cells whose classification differs between 1985 and 2025. The product separately reports 9.10 percent classified to developed, 10.23 percent forest loss, 3.04 percent agricultural loss, and 17.50 percent other difference, and it notes that classification variation may contribute.
What is included in the download?
The ZIP contains four 2480×1754-pixel JPG files: general land cover, forest and farmland, impervious surface and developed land, and the 1985–2025 class comparison. The article uses lighter WebP previews of those same four products.
Map File Information
Lee County Land Cover – 4 JPG Files
- Included Files: Use only the versions confirmed in the article and supplied images
- File Type: Use the confirmed download contents
- Intended Use: Printing, education, presentations, and map-based projects
Related Maps
- Autauga County Alabama Land Cover Map
- Baldwin County Alabama Land Cover Map
- Barbour County Alabama Land Cover Map
Data and reference sources
The percentages and change values discussed above come from the supplied Annual NLCD 2025 products and the 1985–2025 class comparison. The official sources below provide classification documentation, boundary data, and county-specific context for agriculture, natural resources, and the Auburn–Opelika area.
- MRLC Annual NLCD Data
- USGS Annual NLCD Land Cover Classification
- U.S. Census Bureau TIGER/Line Shapefiles
- Alabama Cooperative Extension System – Lee County
- Lee County Annual Report – Alabama Cooperative Extension System
- City of Opelika – Location & Transportation
Green Map creates custom-edited map images using open geographic data sources such as geoBoundaries, Natural Earth, OpenStreetMap, and government open data.
These maps are edited visual materials, not raw data files, and are provided for education, documents, presentations, and graphic reference.