The El Dorado County California Land Cover Map captures an unusual countywide contrast: a developed western edge, a broad Sierra Nevada interior, and Lake Tahoe at the far east. In the 2025 summary, forest is the largest class at 47.51%, followed by shrubland at 24.95% and grassland at 14.50%. Developed cover accounts for 7.44% and water for 4.27%, so the map is not simply a forest sheet. The eastern lake, open mountain cover, and two clusters of development are essential parts of the pattern.
Four map views are provided here: general land cover, forest and farmland, impervious surface and developed land, and change between 1985 and 2025. The WebP versions are meant for on-page comparison, while the four original JPG maps are available together in one download for printing, slides, classroom work, or offline reference. These are land-cover maps—classifications of what is physically on the ground—not zoning, parcel ownership, or permission to develop a property.
Table of Contents
A county with development at both ends and mountain cover in between
The broad 2025 land-cover sheet is easiest to understand by locating three anchors. The first is the developed area along the western county edge. The second is the long interior band of forest, shrub, and grass cover across the Sierra Nevada. The third is Lake Tahoe, the large blue water body at the eastern edge. Once those three features are located, smaller classes such as wetlands, barren ground, and scattered water become much easier to interpret without losing the countywide picture.
Forest covers 47.51% of the county and forms the largest continuous background across much of the west-central and central mountain area. It also appears around portions of the Tahoe side, although it is broken by extensive shrubland and grassland. The U.S. Forest Service describes Eldorado National Forest as terrain that rises from oak foothills in the west to high Sierra country, with forests, lakes, rivers, and streams throughout. Most of that national forest lies in El Dorado County, which provides useful regional context for the large forest presence on the land-cover map. The green pixels, however, are not ownership boundaries and should not all be labeled national forest.
Shrubland at 24.95% and grassland at 14.50% are large enough to shape the map rather than appearing as minor accents. Brown shrub cover expands across parts of the central and eastern interior, while lighter grass cover is especially noticeable in the southeast and in patches elsewhere. These classes interrupt the forest and create a more varied mountain landscape than the headline forest percentage alone suggests. The map tells us where those surface classes were mapped in 2025; it does not by itself explain whether a particular patch reflects elevation, fire history, management, soils, or another cause.
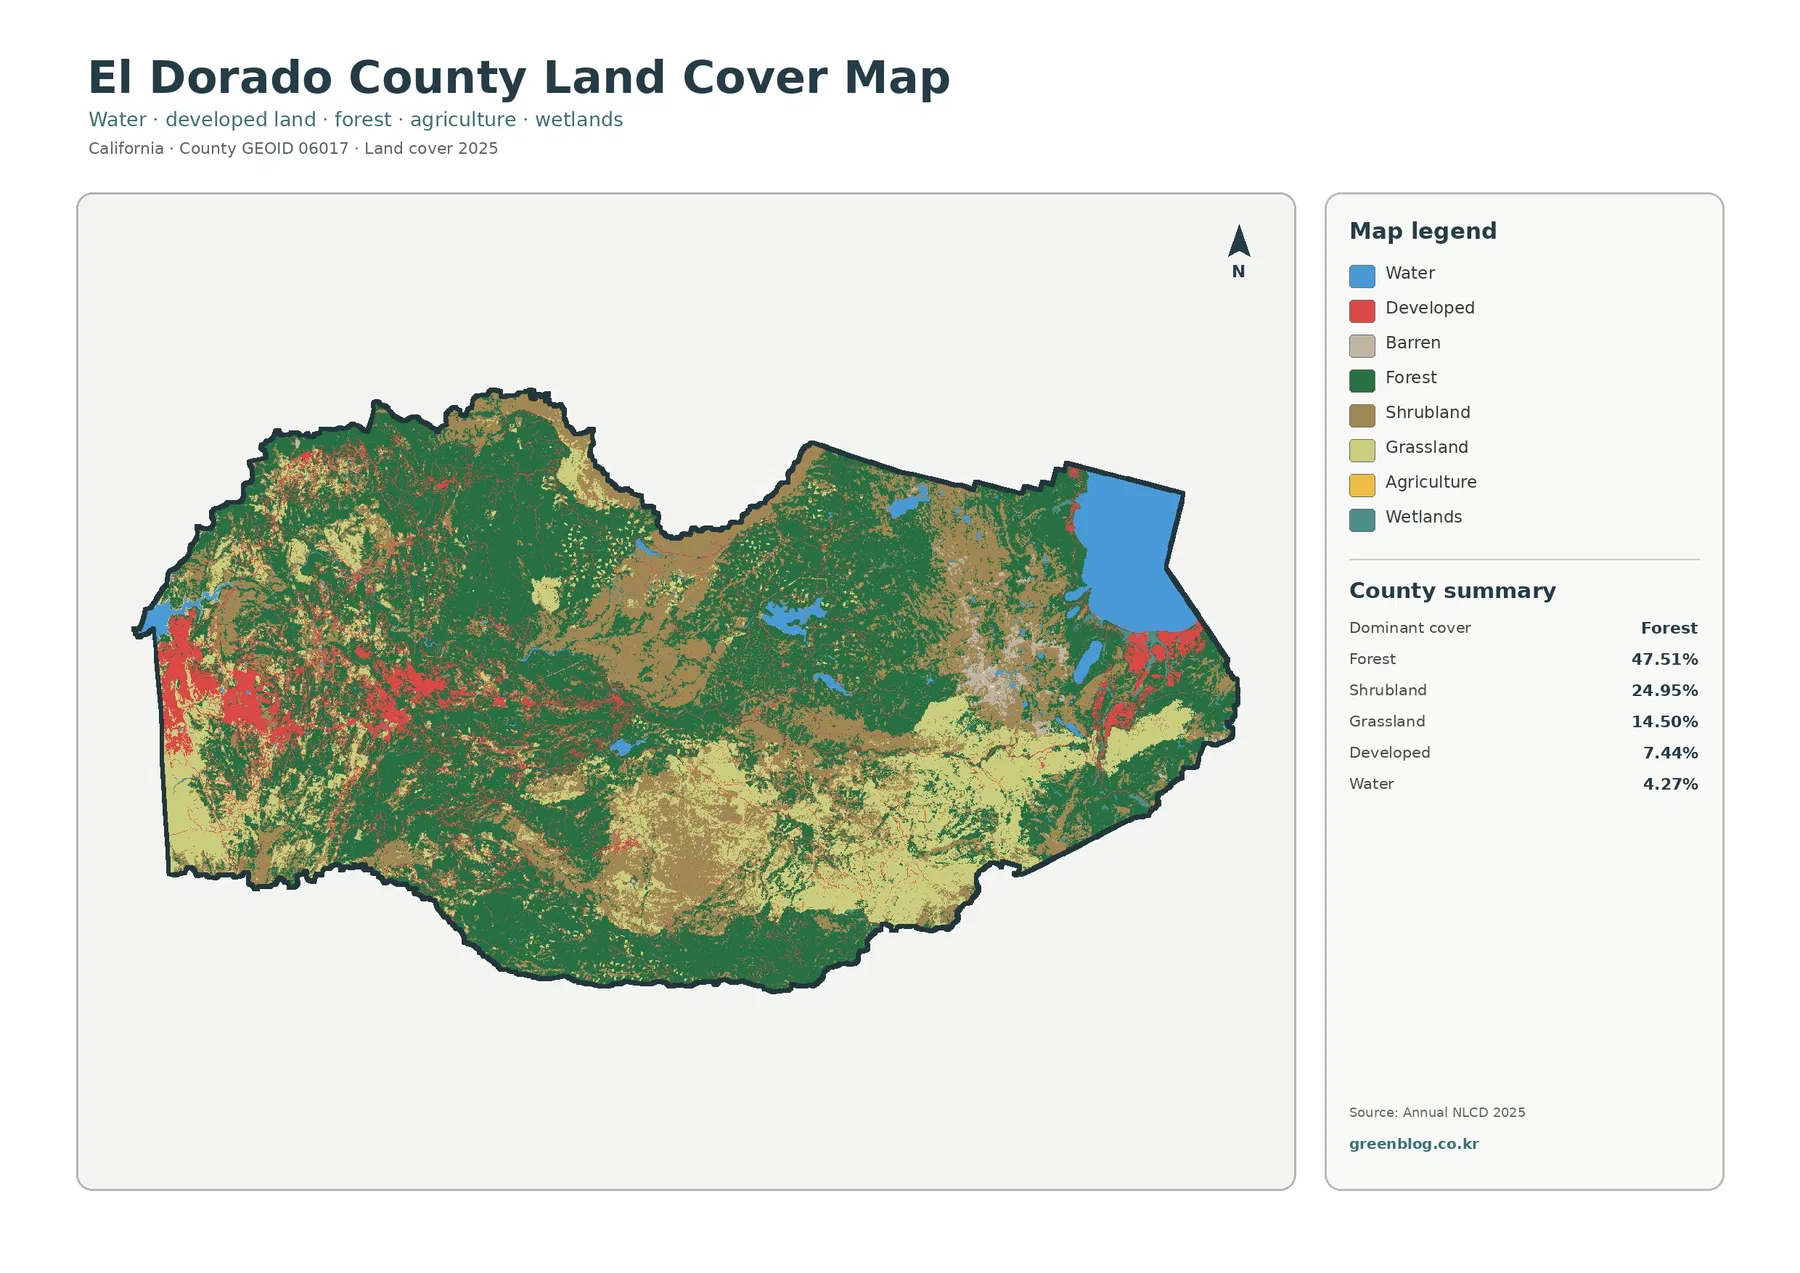
Developed cover stands out because it is concentrated rather than evenly distributed. A large western cluster occupies the El Dorado Hills and Cameron Park side of the county, with smaller developed areas extending east toward Placerville. At the far eastern end, another compact cluster lies along the south side of Lake Tahoe around South Lake Tahoe and nearby communities. County planning documents describe Highway 50 as the main corridor connecting western communities, Placerville, and South Lake Tahoe. The map does not label the highway itself, but the thin developed traces between the two ends are consistent with a corridor-oriented settlement pattern.
Water is 4.27% of county area, but its visual impact is dominated by Lake Tahoe rather than being spread evenly across the map. Smaller blue patches occur in the mountain interior as well. That distinction matters: a percentage reports total area, while a map shows where that area is concentrated. For watershed or recreation context, the Forest Service notes that Eldorado National Forest contains numerous lakes, reservoirs, rivers, and streams. Specific small water bodies should not be named from this unlabeled map unless another verified source is used.
Why agriculture barely appears on the forest-and-farmland sheet
The forest-and-farmland map simplifies the county into a smaller set of vegetation and water categories. Forest remains 47.51%, shrubland 24.95%, grassland 14.50%, water 4.27%, and wetlands 0.54%. Agriculture is only 0.01% in the mapped 2025 summary. That extremely small agricultural share makes El Dorado County very different from a Central Valley county where cropland would dominate large, regular blocks. Here, the map is primarily a comparison among forest, shrub and grass cover, water, and developed or other surfaces.
The western half includes substantial forest but also more white developed-or-other areas than the mountain interior. Moving eastward, forest continues through the Sierra while shrub and grass cover becomes more prominent in broad patches. Near Lake Tahoe, water, forest, open cover, and development sit close together within a comparatively short distance. This eastern mixture is one reason the simplified map is useful: it separates the major natural-cover categories without the extra developed subclasses of the full land-cover legend.
Agriculture at 0.01% should not be interpreted as a statement that agricultural businesses are absent from the county. NLCD agriculture refers to land-cover classes such as cultivated crops and pasture/hay as detected at the mapping scale. Vineyards, orchards, grazing, forestry, and other rural economic activities do not all translate directly into one agriculture percentage. A parcel can be used for an agricultural purpose while its visible cover is forest, grass, shrub, or another class, so land-cover statistics and local agricultural reports answer different questions.
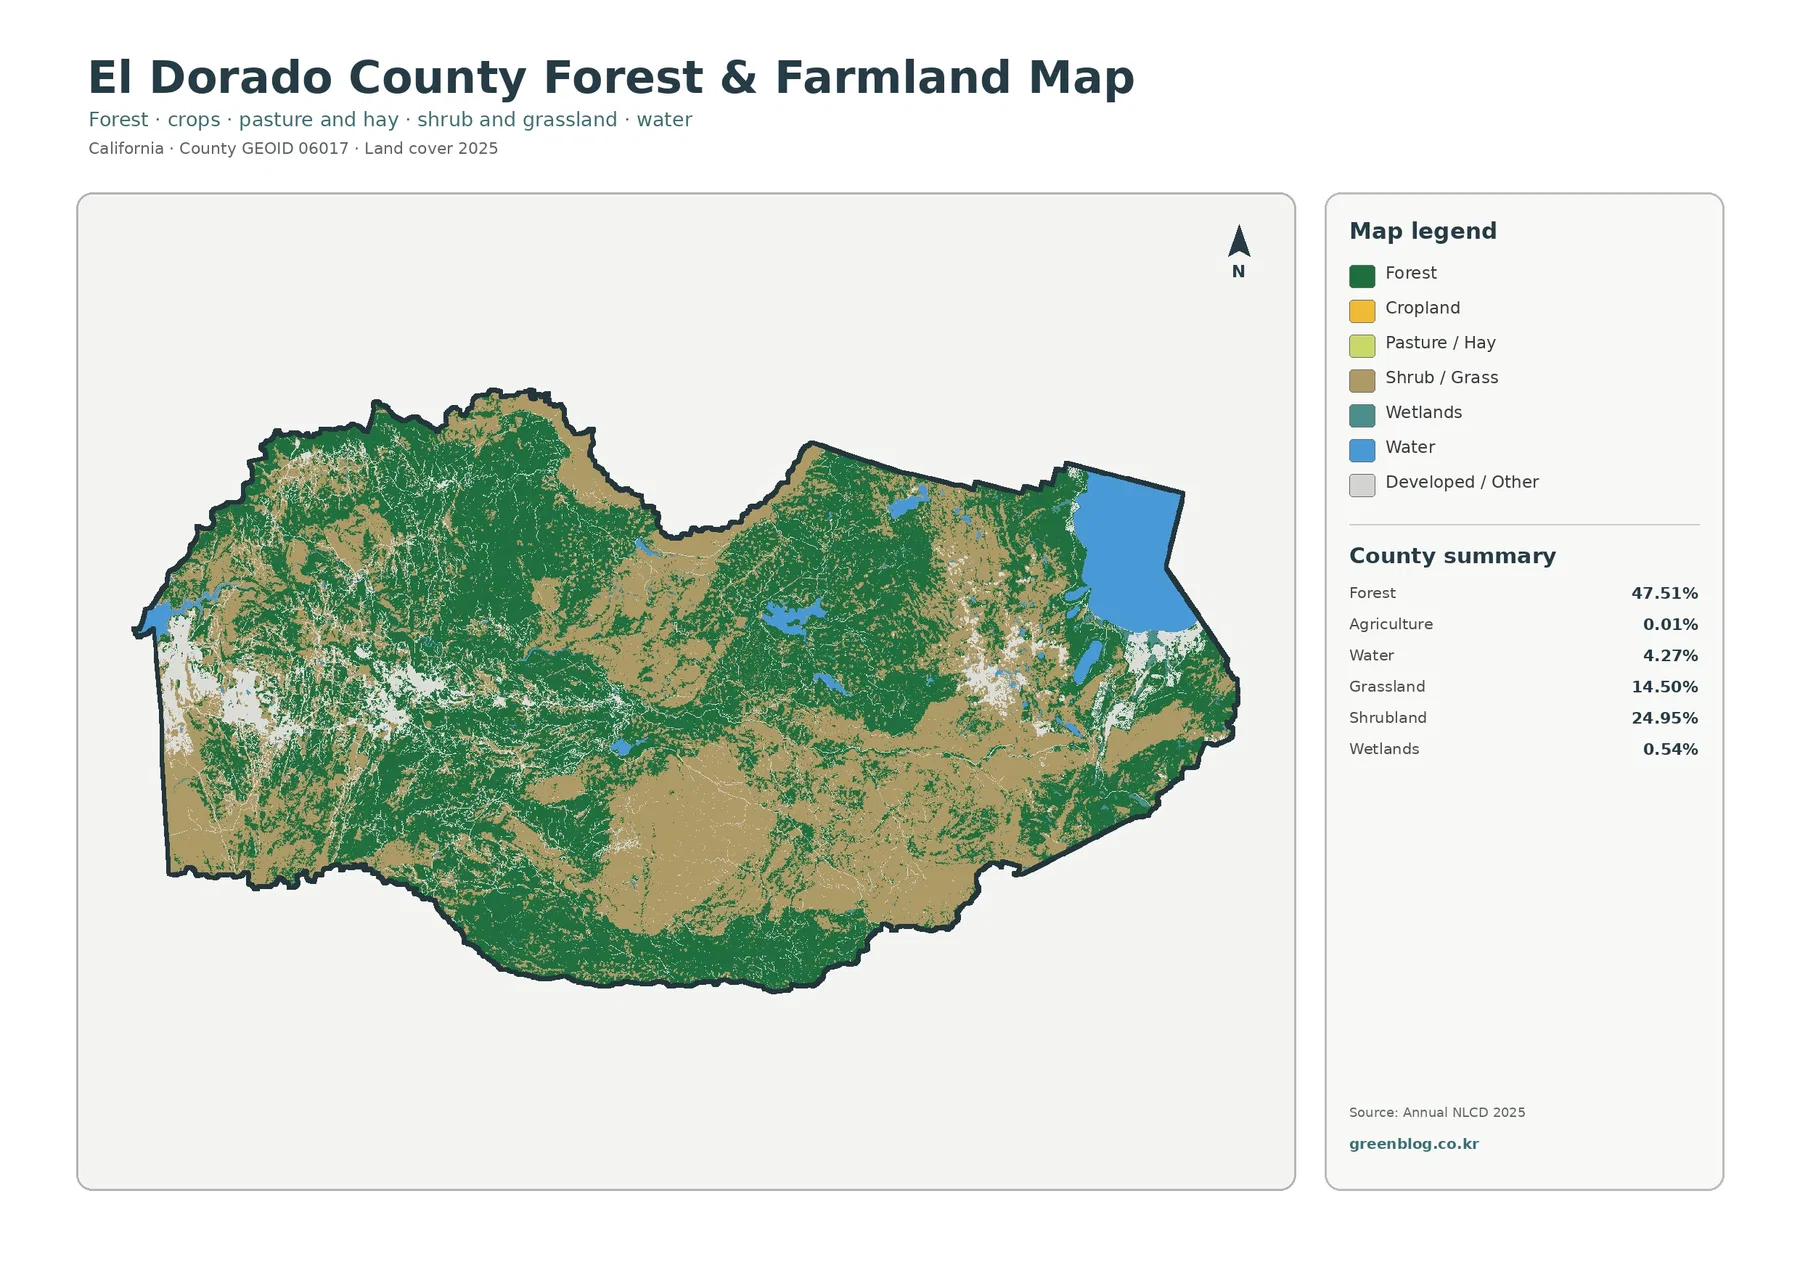
Wetlands occupy 0.54% and appear as small pieces compared with the major forest and shrub classes. At 30-meter resolution, narrow wet areas and stream edges can be generalized or mixed with nearby vegetation and water. The map can identify places where wetland cover is present at county scale, but it is not a wetland delineation. Regulatory wetland boundaries, stream setbacks, and site-specific habitat decisions require dedicated environmental data and often field verification.
This map is also a good reminder that open land is not one category. Grassland and shrubland together cover nearly two-fifths of the county, but they represent different vegetation structures. Lumping both into a vague “undeveloped” label would hide a major part of the 2025 pattern. The classification describes cover, not legal development status: a grass or shrub pixel may be public or private, protected or unprotected, and subject to many different zoning rules.
Impervious surfaces reveal the western corridor and the South Lake Tahoe cluster
Impervious surface measures hard materials such as rooftops, pavement, and parking areas that do not readily absorb water. El Dorado County has a 2025 mean impervious surface of 1.66%, and only 0.66% of county area is mapped at 50% impervious or higher. That is much smaller than the 7.44% developed-cover share because developed land can include lawns, trees, bare soil, and other permeable surfaces within a built setting.
The western edge has the strongest and largest concentration of orange and red cells. High values are visible around the El Dorado Hills and Cameron Park side of the county and continue in smaller clusters toward Placerville. Thin traces also extend through the mountains. The official county General Plan describes many western communities and services along the Highway 50 corridor, which offers a useful real-world reference for the linear pattern. The impervious map itself should still be treated as a surface dataset rather than as a labeled road network.
A second strong cluster appears near the southern shore of Lake Tahoe. South Lake Tahoe and its surrounding developed area stand out sharply because the hard-surface colors are surrounded by water, forest, shrub, and grass cover. El Dorado County planning documents treat the Tahoe Basin as a distinct planning area and specifically discuss communities such as Meyers along with the South Lake Tahoe area. This helps explain why the eastern development cluster has a different geographic setting from the large western suburban corridor.
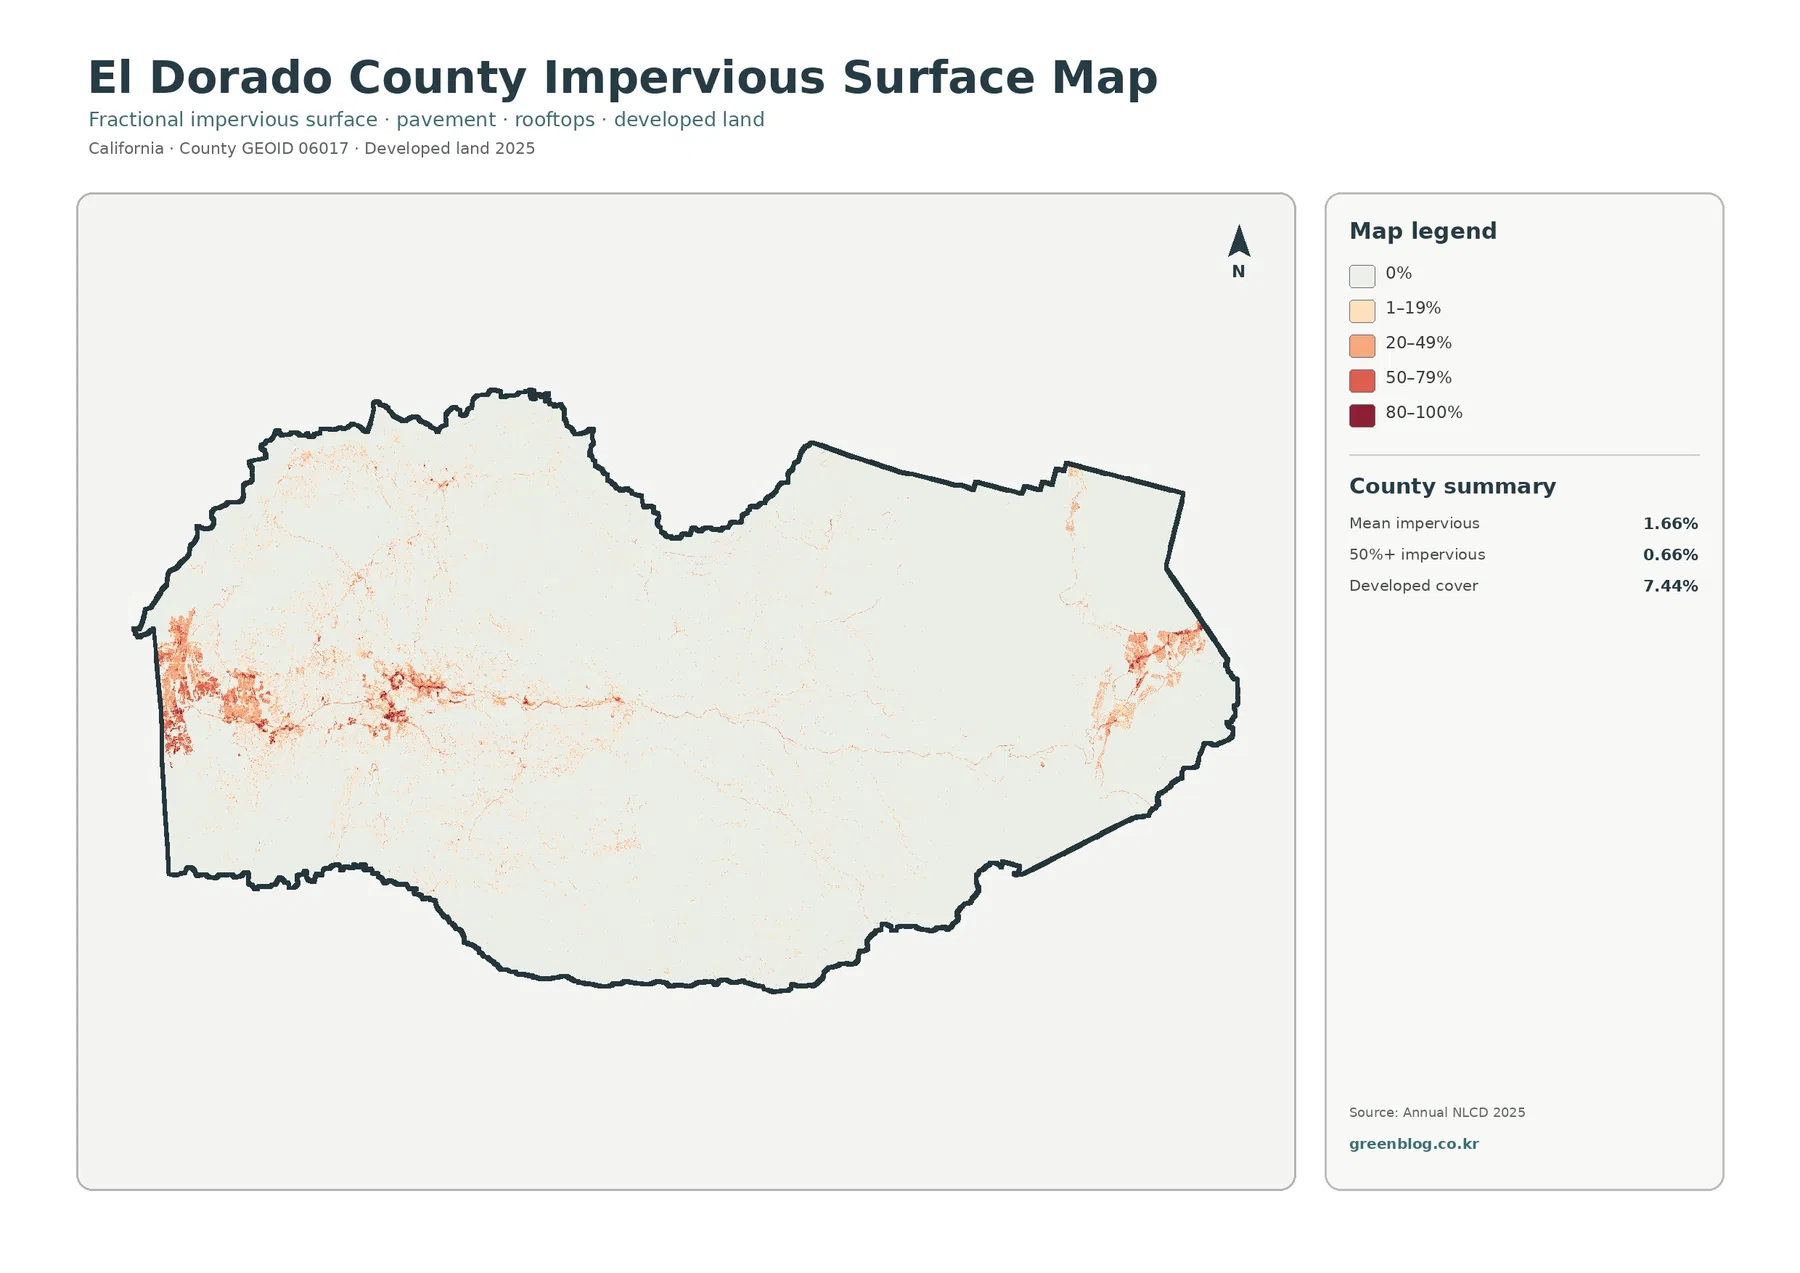
Between the two developed ends, most of the county is pale or nearly white on the impervious map. That does not mean the interior has no roads, buildings, recreation sites, or infrastructure. It means those hard surfaces occupy a small share of the 30-meter cells across a landscape dominated by forest, shrub, grass, rock, and water. For presentations about development intensity, pairing the 7.44% developed-cover statistic with the 1.66% mean impervious value gives a more balanced picture than using either number alone.
Imperviousness is useful for screening development intensity, but it is not a flood-risk map. Runoff depends on slope, soil, snowmelt, rainfall, drainage systems, channels, and many other factors. A high-impervious cell may deserve closer hydrologic attention, yet site design or hazard analysis needs elevation, drainage, engineering, and current local data. This countywide sheet is best used to compare the relative concentration of hard surfaces across the same geography.
The 1985–2025 change map needs a cautious reading
The long-term change sheet compares mapped classes in 1985 and 2025. Its county summary reports a class difference across 32.02% of the area. Forest-loss classification accounts for 20.69%, change to developed for 2.91%, agricultural loss for 0.05%, and other class differences for 8.31%. Those values describe classification differences between two mapped dates. They should not be turned into claims that one-third of the county was physically cleared, rebuilt, or converted in a single consistent way.
Orange forest-loss cells are the most extensive change category. Large orange areas occur through parts of the central, southern, and eastern interior, with additional patches in the north. Comparing those locations with the 2025 land-cover sheet often shows shrub or grass cover where the change map marks a forest difference. That comparison helps identify the current class, but it still does not identify the cause. Fire, forest management, natural vegetation dynamics, imagery timing, mixed pixels, and classification changes can all influence a two-date comparison.
The red “classified as developed” category is much smaller at 2.91%, yet its geography is easy to recognize. Red change cells are strongest at the western end and around the South Lake Tahoe side of the county, broadly matching today’s main developed clusters. Some thinner traces extend between them. The overlap is useful for orientation, but 2.91% is not a building-permit total, annexation area, or legal urban-growth boundary. It is the share of cells that fall into the change product’s developed category.
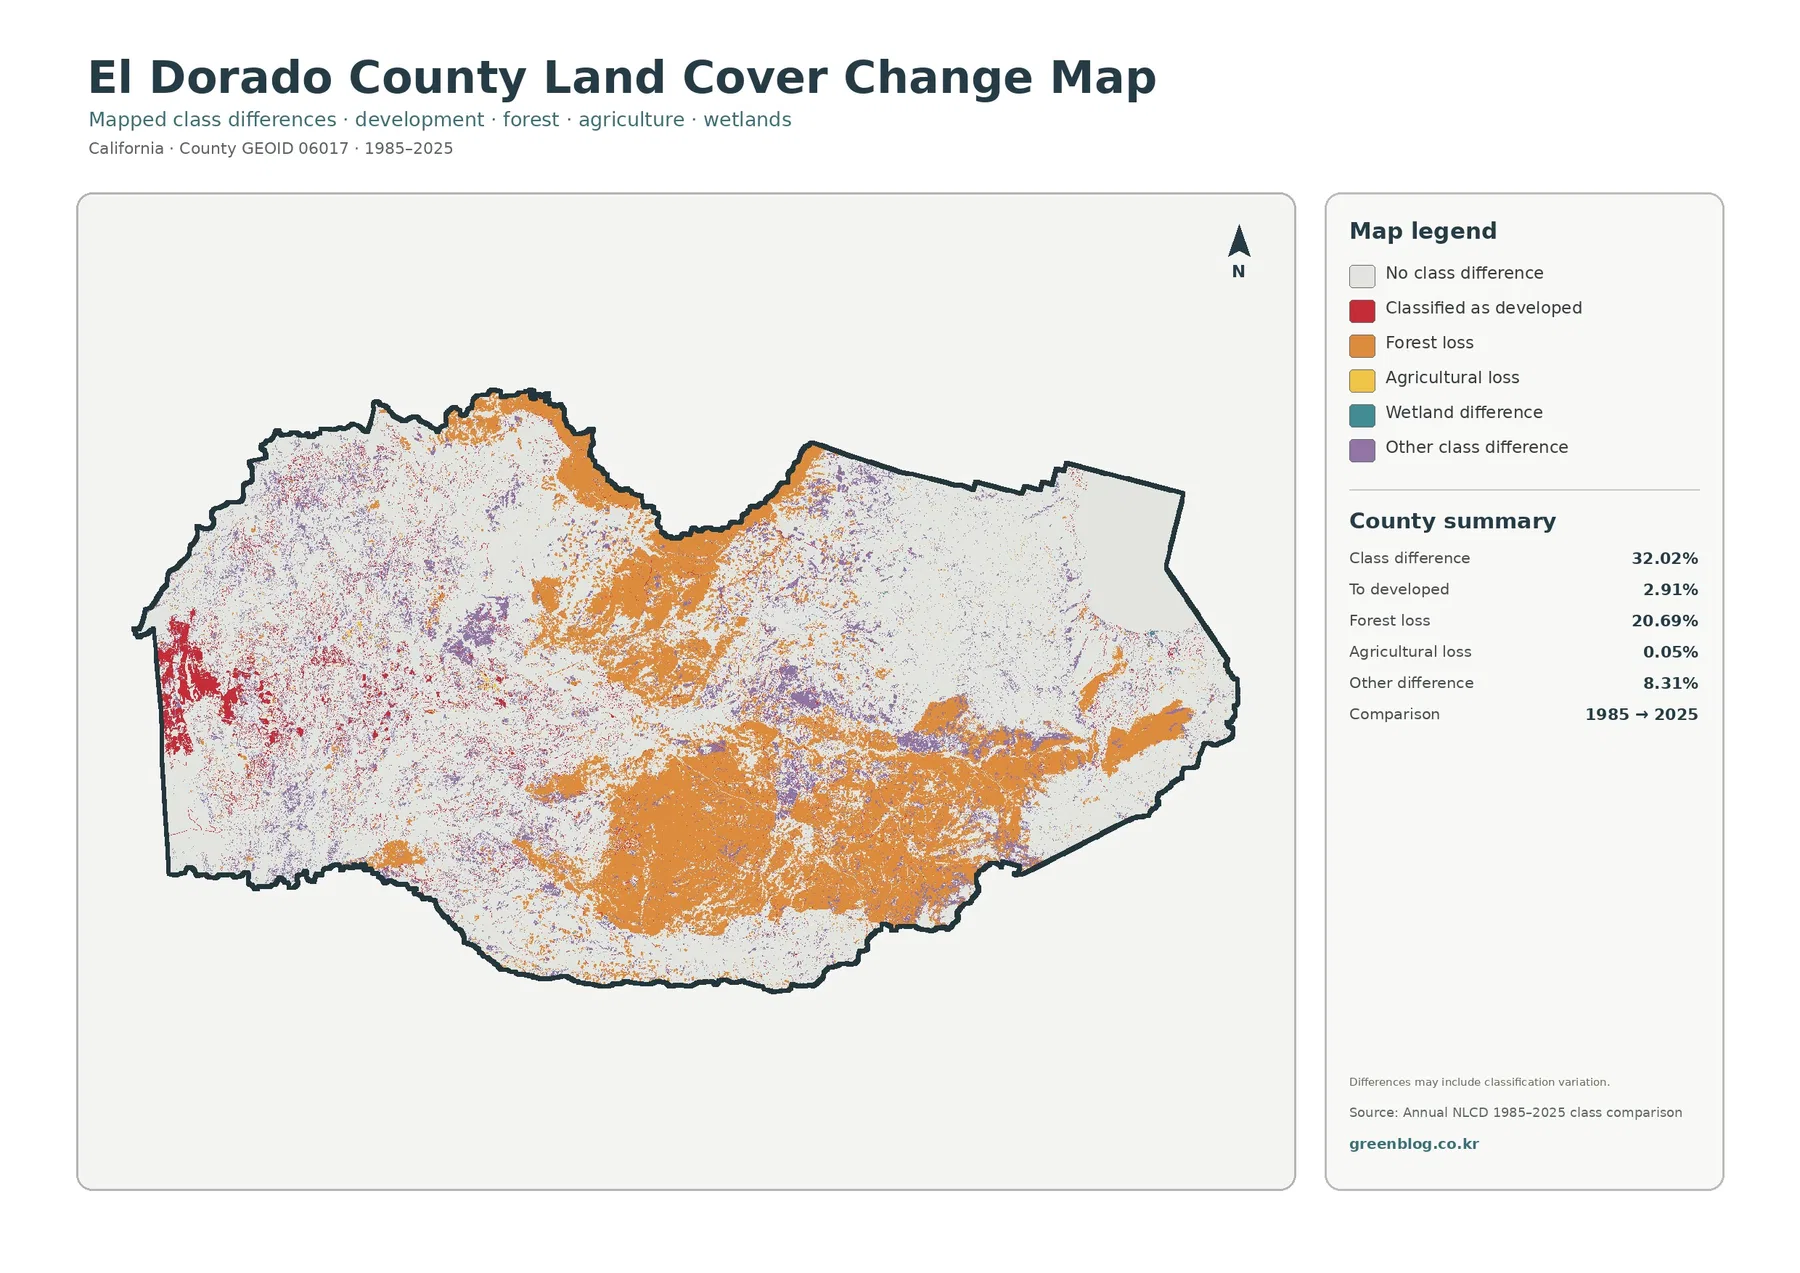
Purple “other class difference” appears in scattered patches and represents transitions not separated into the headline categories. The best way to investigate one of those areas is to locate the same place on the 2025 land-cover map first, then consult additional years if the question requires a trend. A single before-and-after product cannot show whether a change was temporary, gradual, reversed, or affected by a classification boundary.
The forest-loss figure deserves particular care because El Dorado County contains extensive managed and fire-prone Sierra landscapes. It may be tempting to attribute a large orange patch to a known wildfire or a timber operation. The supplied map does not provide event attribution. Any such conclusion needs a separate disturbance history, fire perimeter, forestry record, aerial-image sequence, or field evidence. Used responsibly, the change map is a screening tool that highlights where further investigation may be worthwhile.
Agricultural loss is only 0.05%, consistent with agriculture being a very small mapped 2025 class. That does not mean rural or agricultural economies changed by only that amount. Land-cover classifications are not economic accounts. For agriculture, forestry, recreation, or land-management questions, the change map should be paired with the appropriate county or agency records rather than treated as a complete history of land use.
Using Lake Tahoe and interior water as geographic reference points
Lake Tahoe is the clearest geographic reference on every map that includes water. Its large blue area forms the county’s eastern edge, with the South Lake Tahoe development cluster along the south side and mountain vegetation immediately to the west. This makes it easy to compare the same eastern area across the general land-cover, forest-and-farmland, impervious, and change sheets without needing a dense layer of place labels.
Smaller water bodies are scattered through the mountain interior. The Forest Service notes that the Eldorado National Forest contains numerous lakes and reservoirs in addition to river and stream systems. Because the supplied map does not label those smaller blue features, it is better to use them as visual reference points than to assign names from memory. A named-water analysis should be based on a separate hydrography dataset or verified map.
The 4.27% water share is therefore spatially uneven. Much of it is concentrated in one very large eastern lake, while smaller mountain waters contribute additional area. This is a useful example of why percentages and maps need each other: the percentage says how much water exists within the county boundary, while the image shows whether that water is one large body, a collection of smaller features, or a mixture of both.
Shorelines and narrow channels are also subject to raster generalization. A 30-meter cell can contain a mix of water, vegetation, rock, soil, or developed surface and still receive a single dominant class. For shoreline regulation, parcel boundaries, wetland jurisdiction, flood zones, or engineering work, use the current authoritative layer for that purpose. The land-cover map is an overview, not a survey.
A practical four-map workflow and JPG download
For a quick county overview, begin with the general land-cover sheet and locate the western developed area, the forested interior, and Lake Tahoe. Then use the forest-and-farmland version to simplify the vegetation pattern and see how shrubland and grassland break up the forest. This sequence works well for environmental education, county comparison, or a presentation where the audience needs the large pattern before the details.
Switch to the impervious map when the question concerns the intensity of built surfaces. It distinguishes the broad 7.44% developed classification from the much smaller areas where pavement and rooftops occupy a high share of each cell. Read the change map last. Placing it next to the 2025 land-cover sheet makes the orange forest-loss, red developed-change, and purple other-difference categories easier to interpret because the current surface class is visible at the same location.
The WebP previews are convenient for screen reading. The original JPG maps are better when you need standalone files for a slide deck, a handout, a report appendix, an offline comparison, or a printed reference. The ZIP below contains all four El Dorado County JPG maps together so the same area can be checked across multiple views without saving each image one at a time.
What the 30-meter classes can and cannot tell you
Annual NLCD products are designed for consistent land-cover comparison across large areas, not parcel-scale surveying. A 30-meter raster cell summarizes a square of ground that may contain more than one surface type. Small roads, individual buildings, narrow streams, shoreline edges, and transitions between forest, shrub, grass, and barren ground can therefore be simplified. Enlarging the image does not create new spatial precision; it only enlarges the same cells.
Land cover is separate from legal land use and ownership. A forest cell might fall within national forest, another public property, or private land. A developed cell does not identify whether the site is residential, commercial, industrial, institutional, or transportation land. An agriculture cell does not define an agricultural zone or preserve. The El Dorado County General Plan and county GIS are appropriate for planning and regulatory questions, while NLCD is appropriate for physical surface-cover questions.
Date matters as well. The current land-cover and impervious maps are labeled 2025, and the change sheet compares 1985 with 2025. A fire, development project, restoration treatment, reservoir change, or vegetation shift after the mapped date may not appear. If a decision depends on current conditions, pair the maps with recent aerial imagery, agency records, field observations, or another up-to-date source and cite the observation year clearly.
Within those limits, the set provides a strong county-level comparison. El Dorado County combines a nearly half-forested landscape with extensive shrub and grass cover, a major eastern lake, relatively concentrated development at both ends, low average imperviousness, and substantial long-term classification differences. Looking at all four sheets together is more informative than treating one color or one percentage as the complete story.
Frequently Asked Questions
What is the largest 2025 land-cover class in El Dorado County?
Forest is the largest class at 47.51%. Shrubland follows at 24.95% and grassland at 14.50%, while developed cover is 7.44% and water is 4.27%. Lake Tahoe makes the eastern water concentration especially visible.
Why does El Dorado County have 7.44% developed cover but only 1.66% mean impervious surface?
Developed land can include lawns, trees, soil, and other permeable surfaces around buildings and roads. Impervious surface measures harder materials such as pavement and rooftops, so the countywide mean can be much lower than the developed-cover share.
Does the 20.69% forest-loss category prove that area was logged or burned?
No. The change map compares classifications in 1985 and 2025. Real vegetation change may be included, but mixed pixels, imagery conditions, and classification differences can also contribute. Event attribution requires additional time-series or site-specific evidence.
Map File Information
The ZIP contains four original JPG maps for El Dorado County: 2025 land cover, forest and farmland, impervious surface and developed land, and 1985–2025 land-cover change.
- Included Files: Use only the versions confirmed in the article and supplied images
- File Type: Use the confirmed download contents
- Intended Use: Printing, education, presentations, and map-based projects
Related Maps
- Alameda County California Land Cover Map
- Alpine County California Land Cover Map
- Amador County California Land Cover Map
Sources and further reading
Land-cover and impervious-surface classes are documented through the MRLC Annual NLCD Data portal and the USGS Annual NLCD Land Cover Classification page. County boundaries and geographic identifiers can be checked through the U.S. Census Bureau TIGER/Line Shapefiles.
For local context, the Eldorado National Forest overview describes the Sierra forests, lakes, streams, and elevation range, while the El Dorado County General Plan Land Use Element covers county planning and the Tahoe Basin. These planning and management sources provide geographic context but should not be substituted for NLCD physical land-cover classes.
Green Map creates custom-edited map images using open geographic data sources such as geoBoundaries, Natural Earth, OpenStreetMap, and government open data.
These maps are edited visual materials, not raw data files, and are provided for education, documents, presentations, and graphic reference.