Fresno County crosses several very different landscapes within one long east–west boundary. The 2025 land-cover map is dominated by agriculture at 33.32%, yet that number tells only part of the story. Broad agricultural cover fills much of the San Joaquin Valley portion of the county, a dense developed cluster marks the Fresno–Clovis area, and the eastern side changes into shrubland, grassland, forest, and exposed high-country cover. The strongest feature of the map is therefore not one single class but the rapid geographic shift across the county.
Four map views are included here: general 2025 land cover, forest and farmland, impervious surface and developed land, and a 1985–2025 land-cover change comparison. The WebP versions are convenient for reading on the page, while all four original JPG maps are available together in one ZIP download. Land cover describes what is physically covering the ground—such as crops, forest, grass, shrubs, water, or developed surfaces. It does not identify zoning, parcel ownership, legal land use, or development rights.
Table of Contents
From valley agriculture to Sierra cover in one county
The general map places the largest continuous agricultural areas across the western and central valley floor. Fresno County’s Water and Natural Resources Division describes the county as an east–west cross-section that reaches from the Sierra Nevada on the east, descends through chaparral foothills to the agriculturally rich valley floor, and continues westward toward the inner Coast Range. That official description fits the visible map well: yellow agricultural cover occupies the broad lowland, while the eastern half becomes a more complicated mixture of forest, shrubland, grassland, and pale barren or exposed classes.
Agriculture accounts for 33.32% of the 2025 classified land cover. The county’s Agricultural Commissioner uses a different measure and reports about 1.88 million acres of productive farmland, nearly half of the county’s total land base. Those two figures should not be treated as competing estimates. The map is a satellite-based land-cover classification, while the county agriculture report describes agricultural land and operations under a different statistical framework. The difference is a useful reminder that “agricultural cover” is not the same thing as every acre connected to farming.
Near the center of the valley portion, red developed classes form the largest urban concentration on the general map. County planning documents identify a Fresno–Clovis planning area, which provides a reliable geographic reference for that central cluster. Smaller red patches are scattered through the agricultural plain, but they are much less extensive than the Fresno–Clovis concentration. This contrast makes the map useful for seeing how a major urban area sits inside a much larger agricultural setting without implying that every red pixel has the same density or land use.
The eastern transition is equally important. Shrubland is 19.42% and grassland is 19.40%, nearly equal shares, while forest covers 14.99%. The map shows those classes interlocking through the foothill and mountain portion rather than forming simple straight bands. Farther east, pale barren or exposed patches become more noticeable among the vegetation. Exact elevation is not encoded here, but the county’s documented reach into the Sierra Nevada helps explain why the eastern side looks so different from the cultivated valley floor.
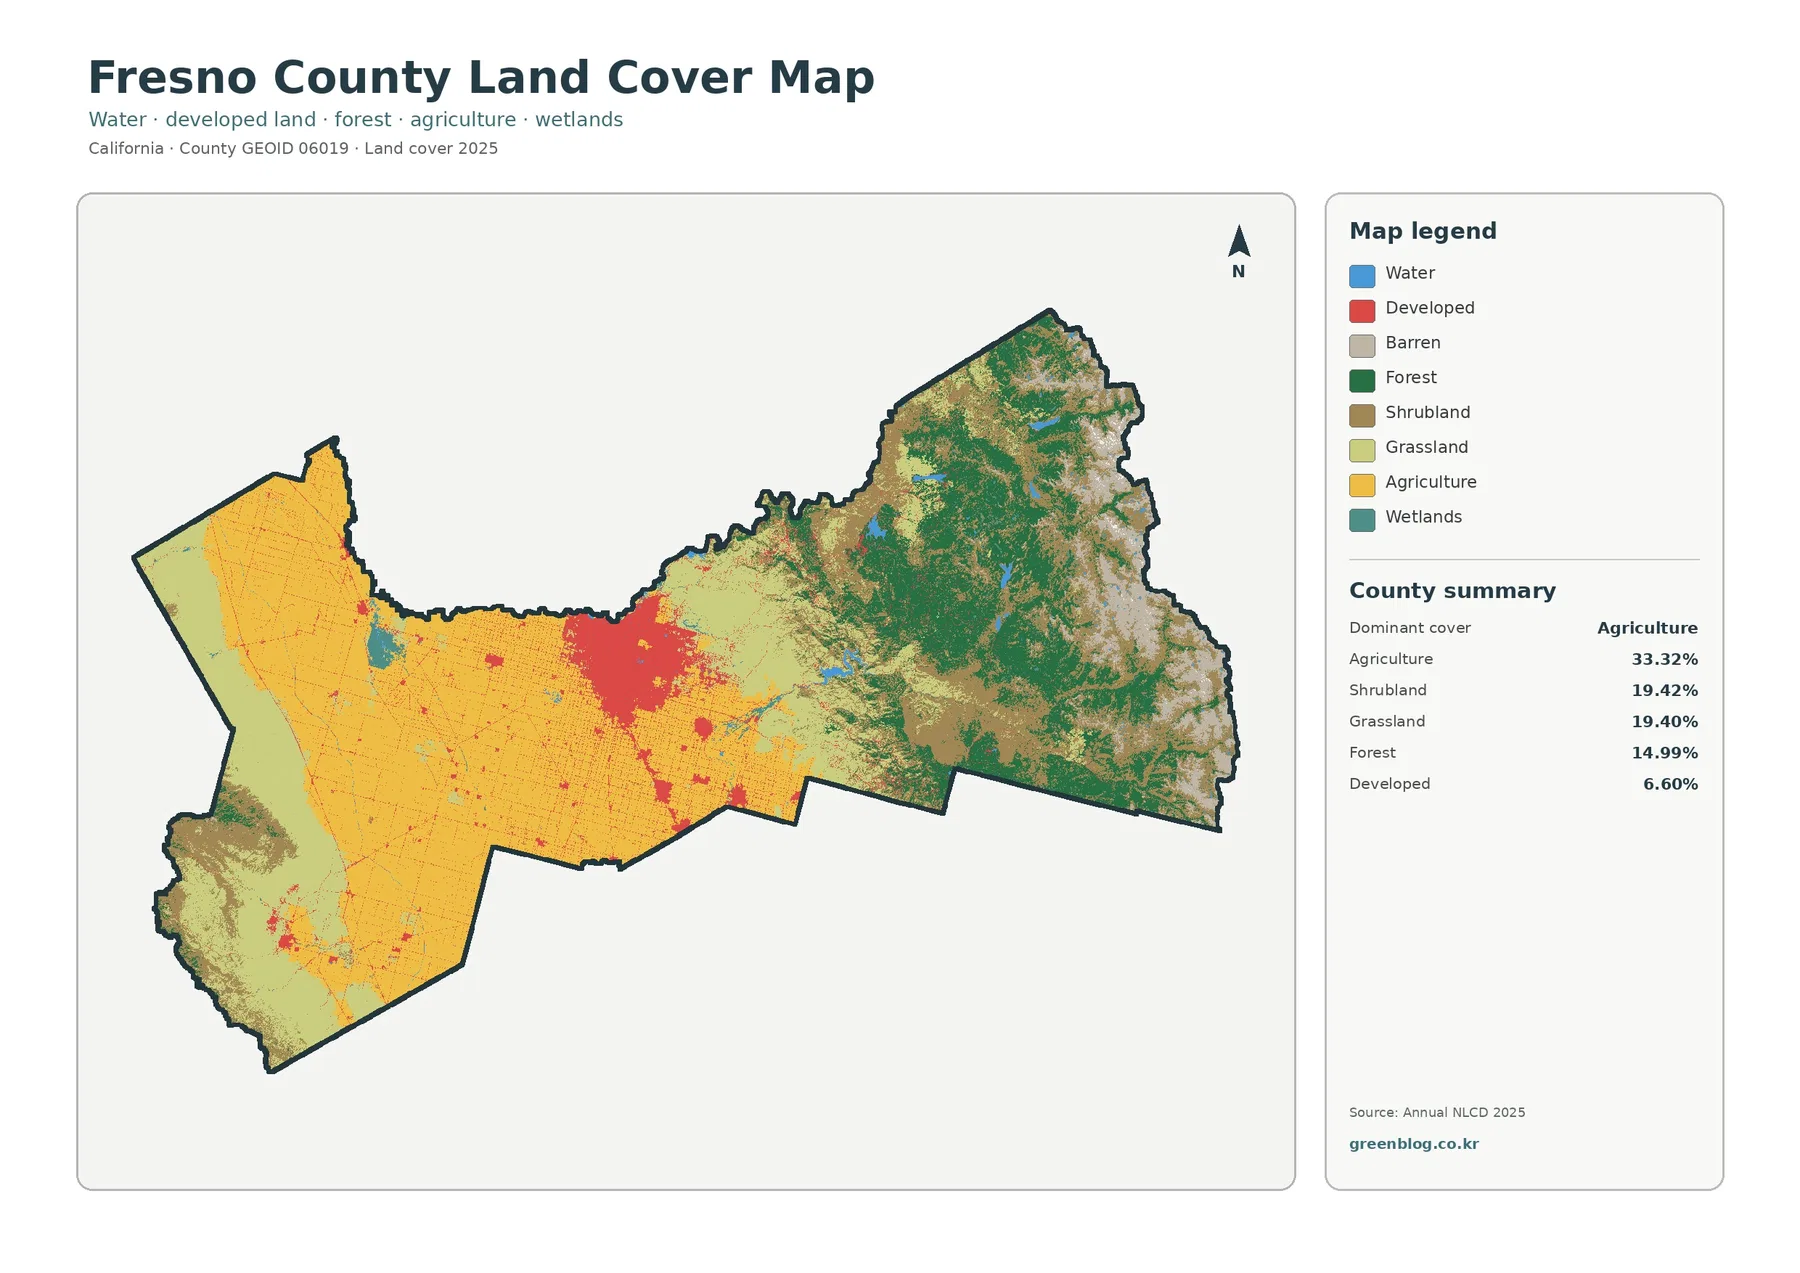
A practical way to read this map is to find three anchors first: the broad agricultural plain, the Fresno–Clovis developed cluster, and the mountain cover in the east. Once those are located, the smaller water, wetland, barren, and developed patches make more sense. Reading the county in this order avoids turning the legend into a checklist. It also makes clear that a countywide percentage cannot tell you whether a class is concentrated in one region or spread evenly across the entire boundary.
Impervious cover reveals the strength of the Fresno–Clovis core
The impervious-surface map asks a different question from the general land-cover map. Impervious surface means rooftops, pavement, parking areas, and other hard surfaces that do not readily absorb water. Fresno County has a mean impervious value of 2.42%, and 2.16% of the county is mapped at 50% impervious or higher. Developed land cover is 6.60%, so the developed class is much broader than the area with a high share of hard surface. Lawns, trees, bare soil, and other permeable areas can exist inside land that is still classified as developed.
The most intense reds and oranges are concentrated in the central Fresno–Clovis urban area. The transition from that core to the surrounding valley is sharp: high values weaken quickly, and the agricultural landscape contains thinner lines and smaller clusters rather than one continuous urban surface. That pattern is valuable when the general land-cover map makes “developed” look like a single category. Here, the degree of pavement and rooftop cover becomes visible, separating the dense urban footprint from lower-intensity development.
Additional small concentrations appear elsewhere in the valley, while the far western and eastern portions remain mostly very light on the impervious scale. Fresno County planning materials list many communities beyond Fresno and Clovis, including Coalinga, Huron, Mendota, Sanger, Reedley, Selma, and Kingsburg. The preview map does not label individual towns, so it is safer not to assign every small red cluster to a specific place. What can be stated directly is that development is dispersed across the valley but is far more concentrated in the central urban core.
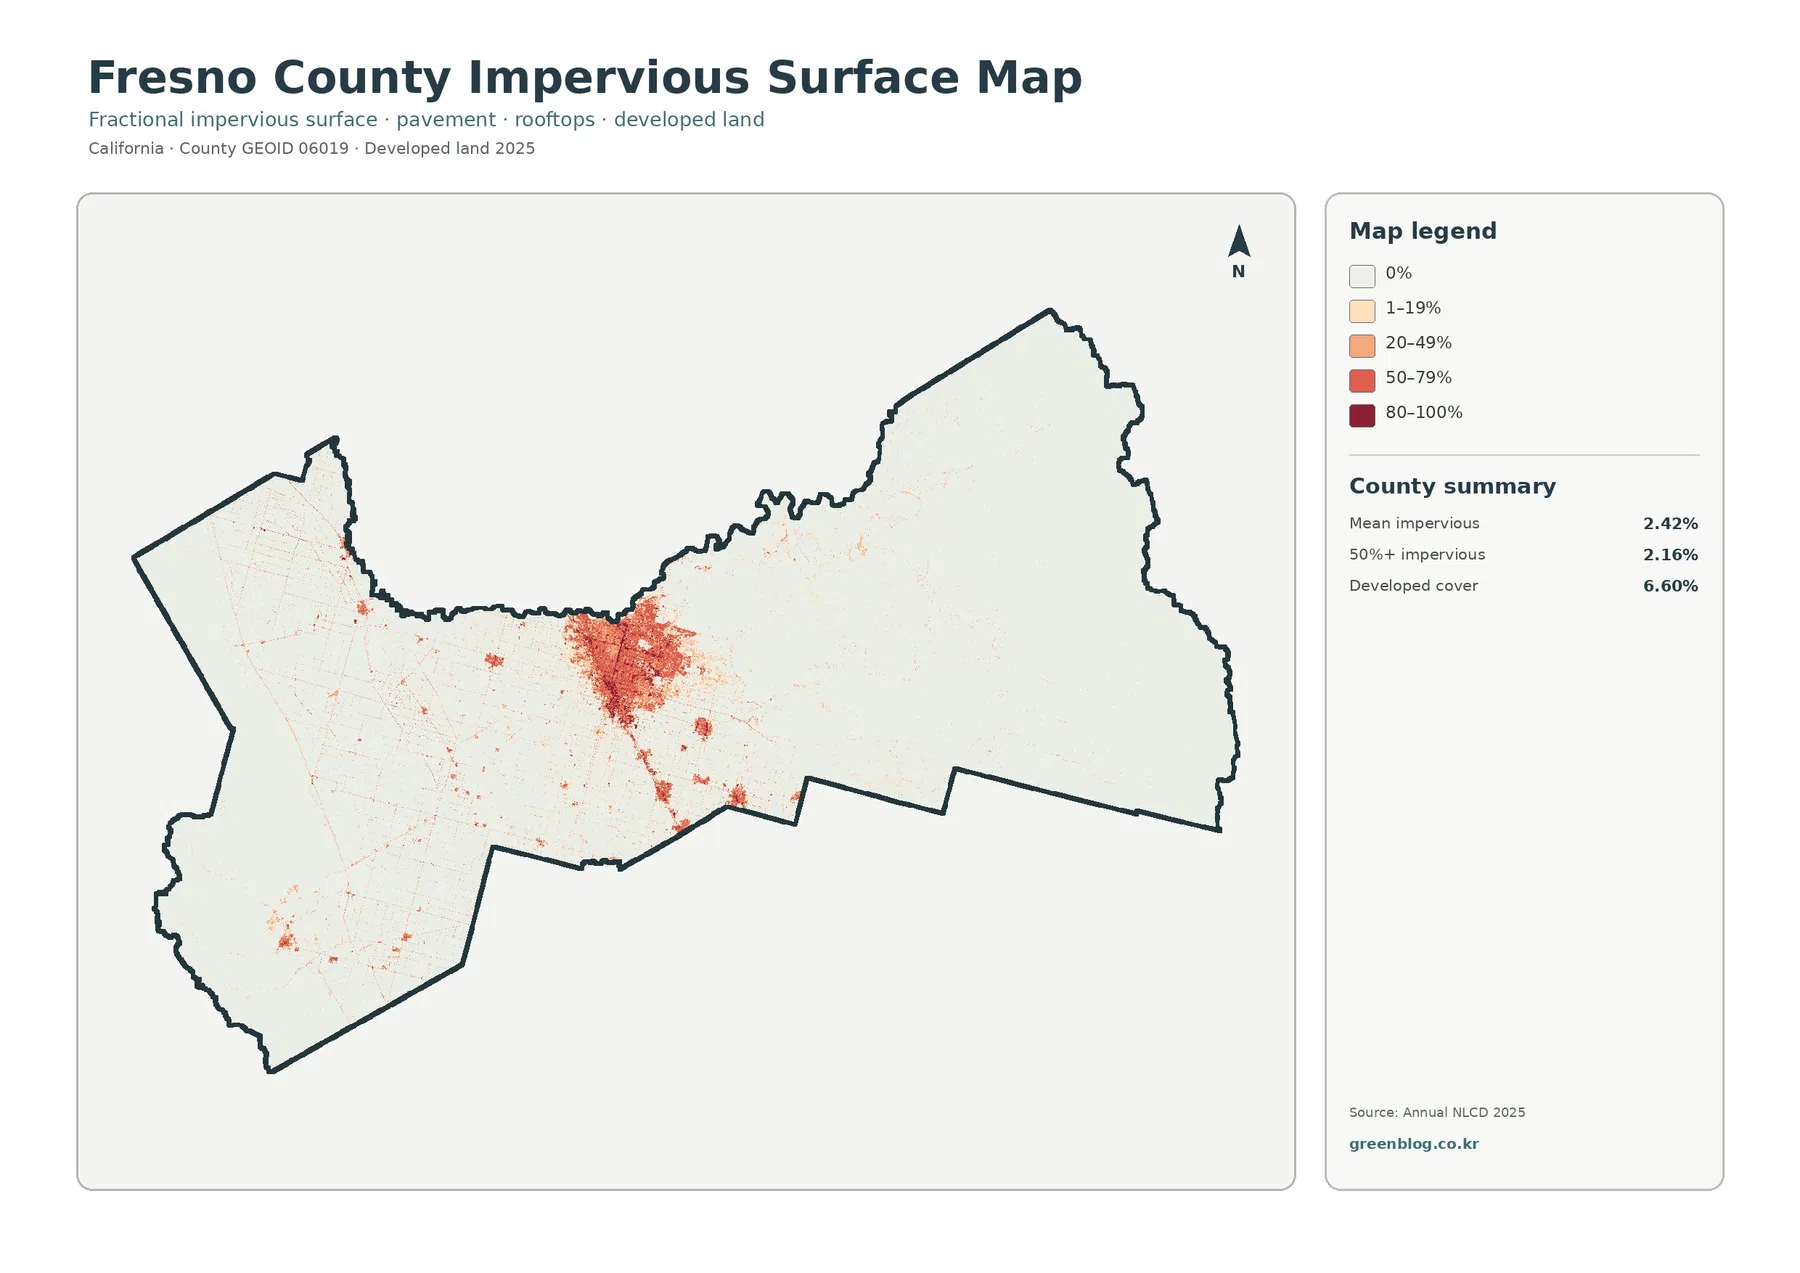
This map should not be used as a direct flood-risk or drainage map. More pavement can reduce infiltration, but runoff also depends on rainfall, soil, slope, channels, stormwater systems, detention facilities, and many other factors. The impervious layer is best used as a county-scale measure of where hard developed surfaces are concentrated. Site design, drainage engineering, and hazard decisions require more detailed local information.
Comparing the 6.60% developed-cover figure with the 2.42% mean impervious value is especially useful for presentations or classroom work. It shows why “developed” does not mean “completely paved.” A low-density residential area can be classified as developed while still containing substantial vegetation or soil. Conversely, a smaller commercial or transportation area may have a much higher impervious percentage even though it occupies less land overall.
Forest and farmland become clearer when the classes are simplified
The forest-and-farmland map strips away some of the detail so the major vegetated classes are easier to compare. Agriculture remains the largest category at 33.32%, forest accounts for 14.99%, grassland for 19.40%, and shrubland for 19.42%. Water is 0.70% and wetlands are 0.79%. The result emphasizes two very different parts of Fresno County: a broad agricultural valley and an eastern landscape where forest, shrubs, and grass become dominant.
The agricultural cover appears as a large, mostly connected yellow field across the valley, but it is interrupted by developed or other classes, small water features, and local patches of non-crop cover. The large central urban area creates the strongest break in this agricultural pattern. This is a useful visual reminder that even an intensively farmed valley is not one continuous agricultural surface. Towns, roads, canals, other infrastructure, and uncultivated land create a more varied pattern than a single countywide percentage suggests.
In the east, forest does not cover every mountain cell. Large blocks of shrub and grass are mixed with green forest, and the relative balance changes from place to place. Fresno County’s natural-resources page describes a transition from the Sierra Nevada through chaparral foothills and down to the valley. That context supports a careful reading of the map, but it does not identify why any particular cell is forest, shrubland, or grassland. Fire history, elevation, soil, management, and natural vegetation change would require separate evidence.
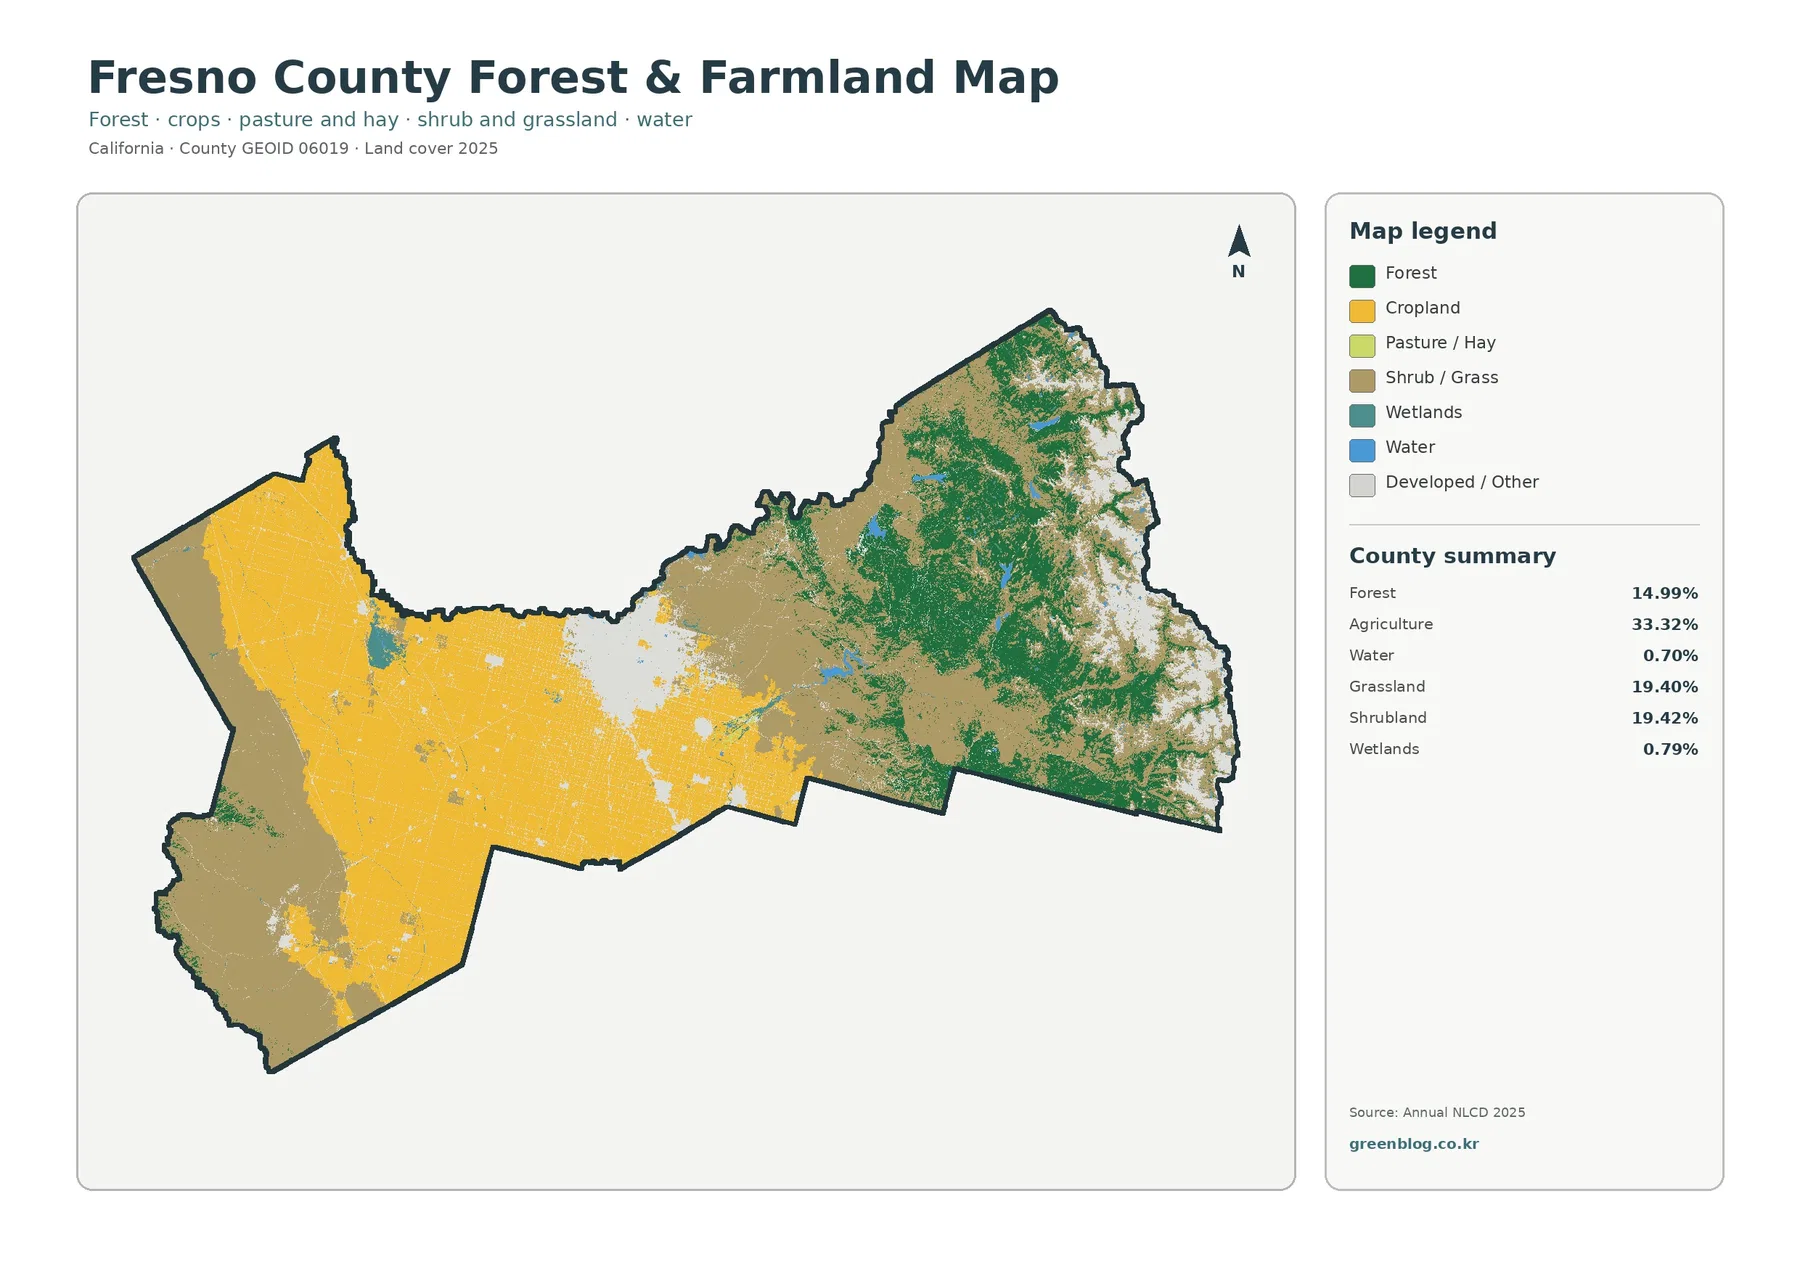
The county Agricultural Commissioner notes that Fresno County growers produce more than 350 different crops. The land-cover map does not separate those crop types. A vineyard, orchard, field crop, or other cultivated area can appear under the same broad agricultural class depending on the underlying classification. Questions about individual commodities, production value, or harvested acreage belong in the Crop & Livestock Report rather than in this map.
Water and wetlands occupy much smaller percentages than the major vegetation classes, but they are still useful reference points. Small blue and teal areas occur within both the valley and the mountain portion. Narrow channels and small wet areas can be generalized by the 30-meter raster cells, so the map should not be used as a legal wetland boundary or as a precise inventory of every stream. Its value is in showing the broad distribution of cover types at county scale.
What the 1985–2025 change categories really mean
The change map compares classifications from 1985 and 2025. The summary reports a class difference across 14.45% of the county. Within that total, forest loss is mapped at 5.81%, other class difference at 5.24%, conversion to developed at 2.43%, and agricultural loss at 0.90%. These are map-comparison categories, not a complete accounting of land-use decisions or ecological causes. The map itself warns that some differences may include classification variation.
Orange forest-loss areas are most visible in several parts of the eastern mountains. Looking back to the 2025 map, many of those areas now contain mixtures of forest, shrubland, grassland, or exposed cover. That comparison helps locate places where a cell classified as forest in the earlier year is not forest in the later classification. It does not tell us whether the cause was wildfire, timber activity, drought, vegetation succession, restoration work, imagery conditions, or a change in classification methods.
Red conversion-to-developed cells gather most strongly around the central urban area and appear in smaller patches through the valley. The current impervious map helps place those changes in context because the strongest modern hard-surface concentration occurs in the same general Fresno–Clovis area. Even so, the 2.43% figure is not the acreage of building permits or an official record of urban-boundary expansion. It is the share of mapped cells assigned to the developed-change category in the two-date comparison.
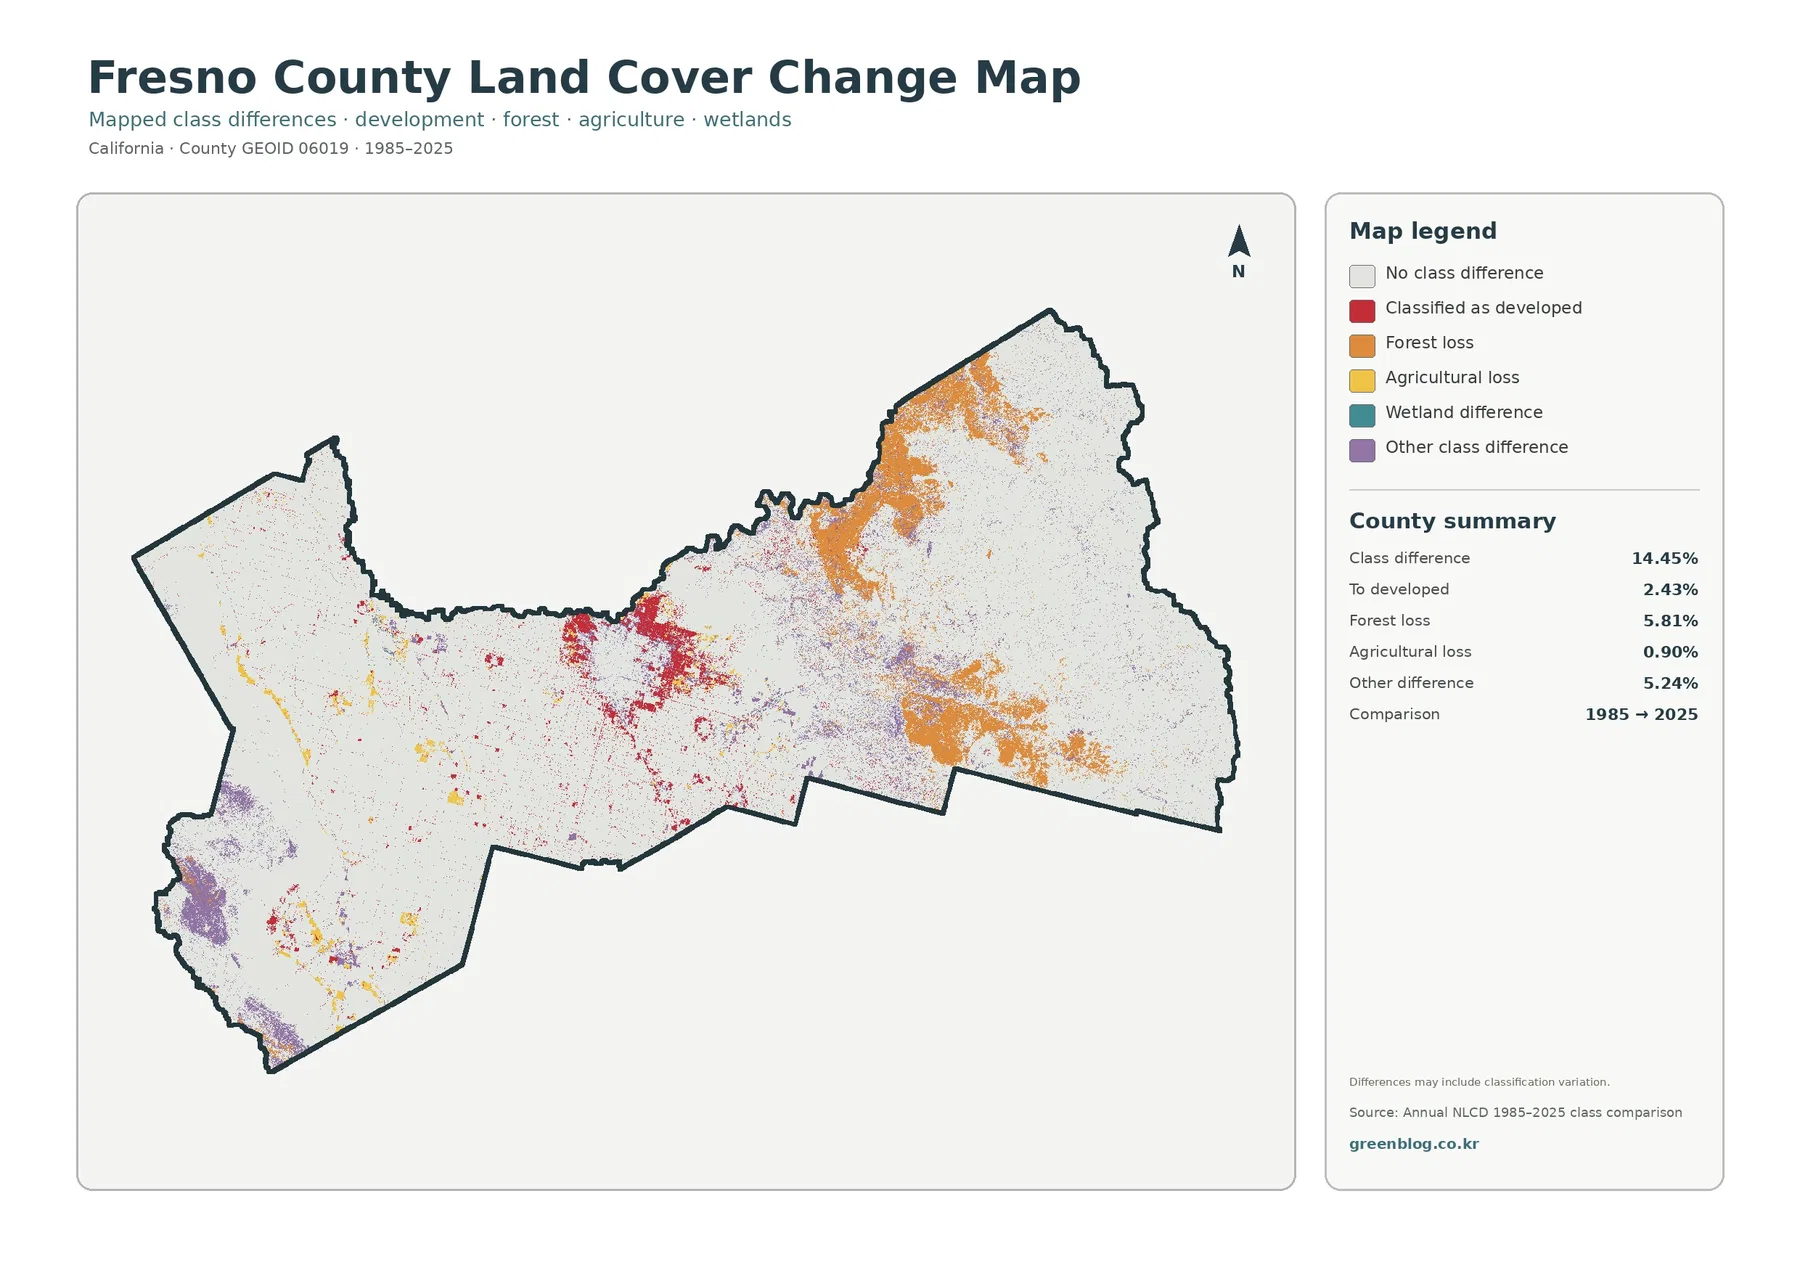
Agricultural-loss cells account for 0.90% and appear as relatively small yellow features within the much larger valley agricultural landscape. That does not mean agricultural production declined by exactly 0.90%. Crop rotation, fallow periods, seasonal image timing, mixed pixels, and classification rules can affect what a cell is called in a given year. A study of actual farmland conversion should use dedicated land-use and agricultural records alongside the land-cover layer.
Purple “other class difference” has the broadest meaning and should be treated cautiously. It marks changes not placed into the forest-loss, developed, or agricultural-loss categories. Rather than naming a cause from the color alone, it is better to find the same location on the 2025 land-cover map and see what the current class is. Moving back and forth between the present-day map and the change map is the safest way to use this layer.
Water, wetlands, and exposed high-country patches add important detail
Water is only 0.70% and wetlands 0.79%, but small percentages can still matter geographically. Fresno County’s General Plan map identifies several named water bodies in the eastern mountain area, including Pine Flat Lake, Shaver Lake, Huntington Lake, Florence Lake, Courtright Reservoir, Wishon Reservoir, and others. The supplied land-cover preview does not label those features, so individual blue shapes should not be named without another reference. Their broader pattern still shows that water occurs in both the valley and mountain portions of the county.
The far eastern side also contains pale barren or exposed patches that are visually distinct from forest, shrubland, and grassland. These areas become more noticeable in the high Sierra portion of the county. The map does not provide elevation or geology, so it cannot identify a particular ridge, rock type, or alpine zone. Still, the official county description of its terrain reaching to the Sierra Nevada provides a sound geographic context for the strong reduction in agricultural cover and the increase in natural and exposed classes toward the east.
Wetland and water boundaries are among the features most likely to be simplified at 30-meter resolution. A narrow stream, reservoir edge, or seasonally wet area may occupy only part of a raster cell, and a mixed cell can be assigned to a neighboring class. Water level and image date can also affect what is mapped. For regulatory wetlands, flood zones, water-right questions, or engineering work, the appropriate agency’s current detailed data should replace a generalized land-cover map.
These smaller classes are worth keeping in the article because they help prevent a two-color interpretation of Fresno County. The county is not simply “agriculture in the west and forest in the east.” The foothill and mountain portions contain extensive shrubland and grassland, exposed areas occur in the high country, and water features interrupt both valley and mountain cover. The four maps together preserve that complexity without requiring a reader to work through a technical GIS dataset.
A useful order for comparing all four maps
Start with the general land-cover map and identify the big west-to-east change. Next, use the forest-and-farmland view to simplify the vegetation classes and compare the agricultural plain with forest, shrub, and grass cover. Those two steps establish the physical setting. If the reader begins with the change map instead, the bright change colors can look more dramatic than they really are because the current land-cover context is missing.
The impervious map works best after the general map because it separates the presence of developed land from the intensity of hard surface. The Fresno–Clovis cluster becomes much more obvious, while surrounding agricultural areas are mostly pale. This makes the layer useful for urban-form comparisons, environmental education, and presentations that need to distinguish a broad developed class from areas that are actually heavily paved or roofed.
Use the 1985–2025 change layer last. Once the current agricultural, forest, shrub, grass, and developed patterns are familiar, the forest-loss, development, agricultural-loss, and other-difference colors can be interpreted more carefully. A bright change cell should be treated as a location to investigate, not as proof of a specific cause. This sequence turns the four maps into a simple workflow rather than four separate illustrations.
For printed handouts or slides, keep the legends and county summaries visible. Cropping away the legend can make the change map particularly confusing because orange, yellow, red, and purple refer to different types of class differences. If a close-up is needed, pair it with a small view of the full county so the reader can still tell whether the area lies in the agricultural valley, the central urban zone, the western hills, or the eastern mountains.
Download the four original JPG maps
The WebP images on this page are optimized for quick viewing. The downloadable ZIP contains the original JPG versions of all four maps: 2025 general land cover, forest and farmland, impervious surface and developed land, and 1985–2025 land-cover change. Because the maps share the same county outline, they can be placed side by side in reports, presentations, lessons, or personal reference notes without rebuilding the map set from separate sources.
When reusing the files, keep the year and map type attached to each image. The present-day land-cover and impervious views are labeled 2025, while the change map compares 1985 with 2025. Recording those dates matters because later development, vegetation change, fire, water-level changes, or updated classifications will not appear in a map made from the 2025 layer.
The JPG files are reference maps rather than survey documents. They are well suited to broad county comparisons and visual explanation, but enlarging the image does not create parcel-level precision. If a project requires exact property boundaries, road engineering, wetland delineation, or zoning status, use the appropriate local or agency dataset instead of treating the land-cover pixels as legal boundaries.
What a 30-meter land-cover classification can and cannot tell you
Annual NLCD-style land-cover data generalizes the landscape into raster cells of roughly 30 meters. That scale is useful for consistent regional mapping, but it can smooth or simplify small features. Narrow roads, small buildings, field edges, streams, and complicated boundaries between vegetation types may fall inside mixed cells. A mixed pixel is a cell containing more than one real surface type, even though the map must assign a representative class or value.
Land cover should also remain separate from land use. A yellow agricultural pixel is not a legal farm parcel, and a green forest pixel does not indicate whether the land is federal, state, county, or private. A red developed pixel does not tell you whether a site is residential, commercial, industrial, or public. Fresno County’s General Plan and zoning resources answer administrative land-use questions; the maps here answer a physical-cover question. Using the correct source for the question prevents many common misreadings.
The change layer adds another level of uncertainty because it compares classifications made for two different years. Real change is certainly possible over four decades, but image conditions, sensor differences, classification methods, and mixed pixels can also influence the result. The 14.45% class-difference figure should therefore be described exactly as a mapped class difference, not as proof that 14.45% of the county underwent a specific human or ecological transformation.
With those limits in mind, the Fresno County map set is especially informative because the county contains such a pronounced geographic gradient. The maps place a productive agricultural valley, the Fresno–Clovis urban core, foothill shrub and grass cover, eastern forest, water features, and exposed high-country terrain inside one boundary. Looking at all four layers together gives a much richer picture than a single statistic while still keeping the interpretation accessible to readers who do not work with GIS every day.
Frequently Asked Questions
What is the largest 2025 land-cover class in Fresno County?
Agriculture is the largest mapped class at 33.32%. Shrubland accounts for 19.42%, grassland 19.40%, forest 14.99%, and developed cover 6.60%. The map shows agriculture concentrated across the valley floor, with more forest, shrub, and grass cover toward the eastern mountains.
Why is developed cover 6.60% while mean impervious surface is only 2.42%?
Developed land can include trees, lawns, soil, and other permeable surfaces along with buildings and pavement. The impervious layer measures hard surfaces such as rooftops and paved areas, so its countywide average can be lower than the broader developed-land class.
Does the 5.81% forest-loss category prove how much forest was removed by fire or logging?
No. The change map compares 1985 and 2025 classifications. Real forest change may be included, but classification variation, mixed pixels, imagery conditions, and other factors can also contribute. A cause requires additional time-series, fire-history, or forest-management evidence.
Map File Information
The ZIP contains four original JPG maps for Fresno County: 2025 land cover, forest and farmland, impervious surface and developed land, and the 1985–2025 land-cover change map.
- Included Files: Use only the versions confirmed in the article and supplied images
- File Type: Use the confirmed download contents
- Intended Use: Printing, education, presentations, and map-based projects
Related Maps
- Alameda County California Land Cover Map
- Alpine County California Land Cover Map
- Amador County California Land Cover Map
Sources and references
Land-cover and impervious-surface classes can be checked through MRLC Annual NLCD Data and the USGS Annual NLCD Land Cover Classification. County boundary and FIPS information can be referenced through the U.S. Census Bureau TIGER/Line Shapefiles.
County-specific context comes from the Fresno County Water and Natural Resources Division, the Fresno County Annual Crop & Livestock Report, and the Fresno County General Plan. These county sources discuss agriculture, natural resources, communities, and planning; they serve a different purpose from the physical land-cover classification itself.
Green Map creates custom-edited map images using open geographic data sources such as geoBoundaries, Natural Earth, OpenStreetMap, and government open data.
These maps are edited visual materials, not raw data files, and are provided for education, documents, presentations, and graphic reference.