Bear Lake County has one of the clearest internal contrasts in this Idaho map series. The supplied 2025 summary is led by shrubland at 50.67%, but the western side is far more wooded, a narrow north–south valley carries much of the agriculture and wet ground, and the large Bear Lake water body occupies the southern edge. Forest accounts for 22.81%, agriculture 9.57%, wetlands 8.65%, and water 6.01%. Those categories form distinct zones rather than an even countywide mixture.
Four views are included on this page: current land cover, forest and farmland, impervious surface with developed land, and a 1985–2025 class-difference map. The WebP images can be read at full article width, while the four original 2480 × 1754 JPG files are grouped in one ZIP download below. The sequence is useful because the same central valley looks very different when vegetation, hard surfaces, and endpoint differences are separated from the full land-cover legend.
Table of Contents
A low-impervious county still has a recognizable central built node
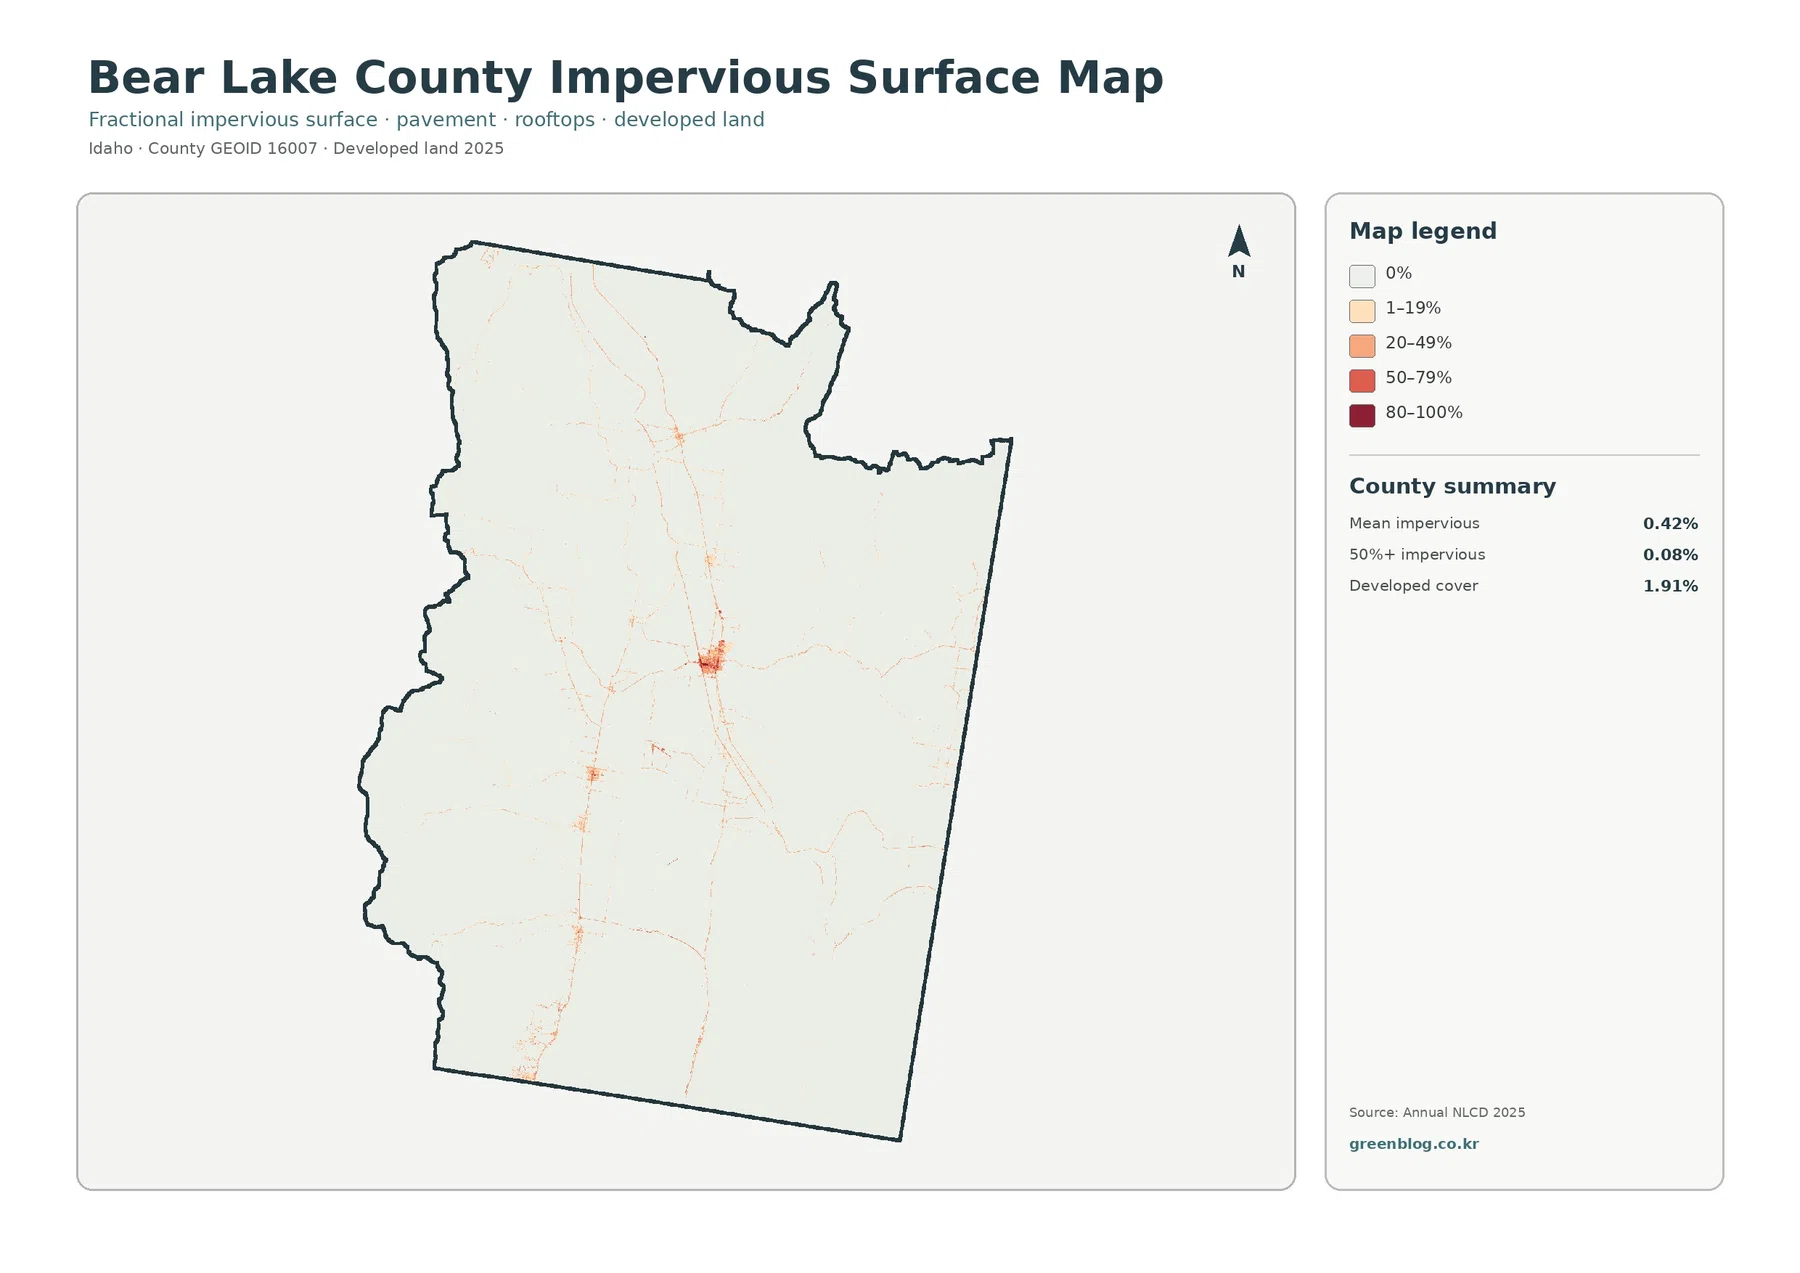
The impervious map is a good place to start because it shows how small the built footprint is relative to the county. Mean impervious cover is only 0.42%, and just 0.08% of the county is mapped above 50% impervious. Developed land occupies 1.91% in the general classification. Most of the map is therefore nearly blank, while one compact central cluster and several thin connecting lines stand out immediately against the much larger natural and agricultural background.
Impervious cover and developed land are related but they are not the same measure. A developed NLCD class can include lawns, trees, bare soil, and other surfaces that still absorb water, while the impervious layer isolates the fraction covered by pavement, rooftops, and similar hard material. That distinction explains why the 1.91% developed share is several times larger than the 0.42% countywide impervious average. It also prevents the common mistake of treating every developed-class pixel as fully paved ground.
The thin orange lines are best read as concentrations of hard surface along transportation and settlement traces, not as a substitute for a road map. They do not identify route numbers, public access, ownership, or traffic levels. Their value here is comparative: the central valley contains nearly all of the visible hard-surface structure, while the broad eastern shrubland and western forest contain very little. A transportation or parcel question needs separate official GIS or road data.
The contrast is especially strong when this layer is compared with Bear Lake itself. The lake is a large feature on the land-cover map but contributes no impervious surface, while the much smaller central built node becomes the darkest feature on this view. Agriculture also remains mostly light. Reading the layers together makes it easier to separate water, working land, and settlement intensity without assuming that a visually prominent land-cover class is also a hard-surface class.
The 2025 overview divides the county into shrubland, forest, a farm valley, and Bear Lake
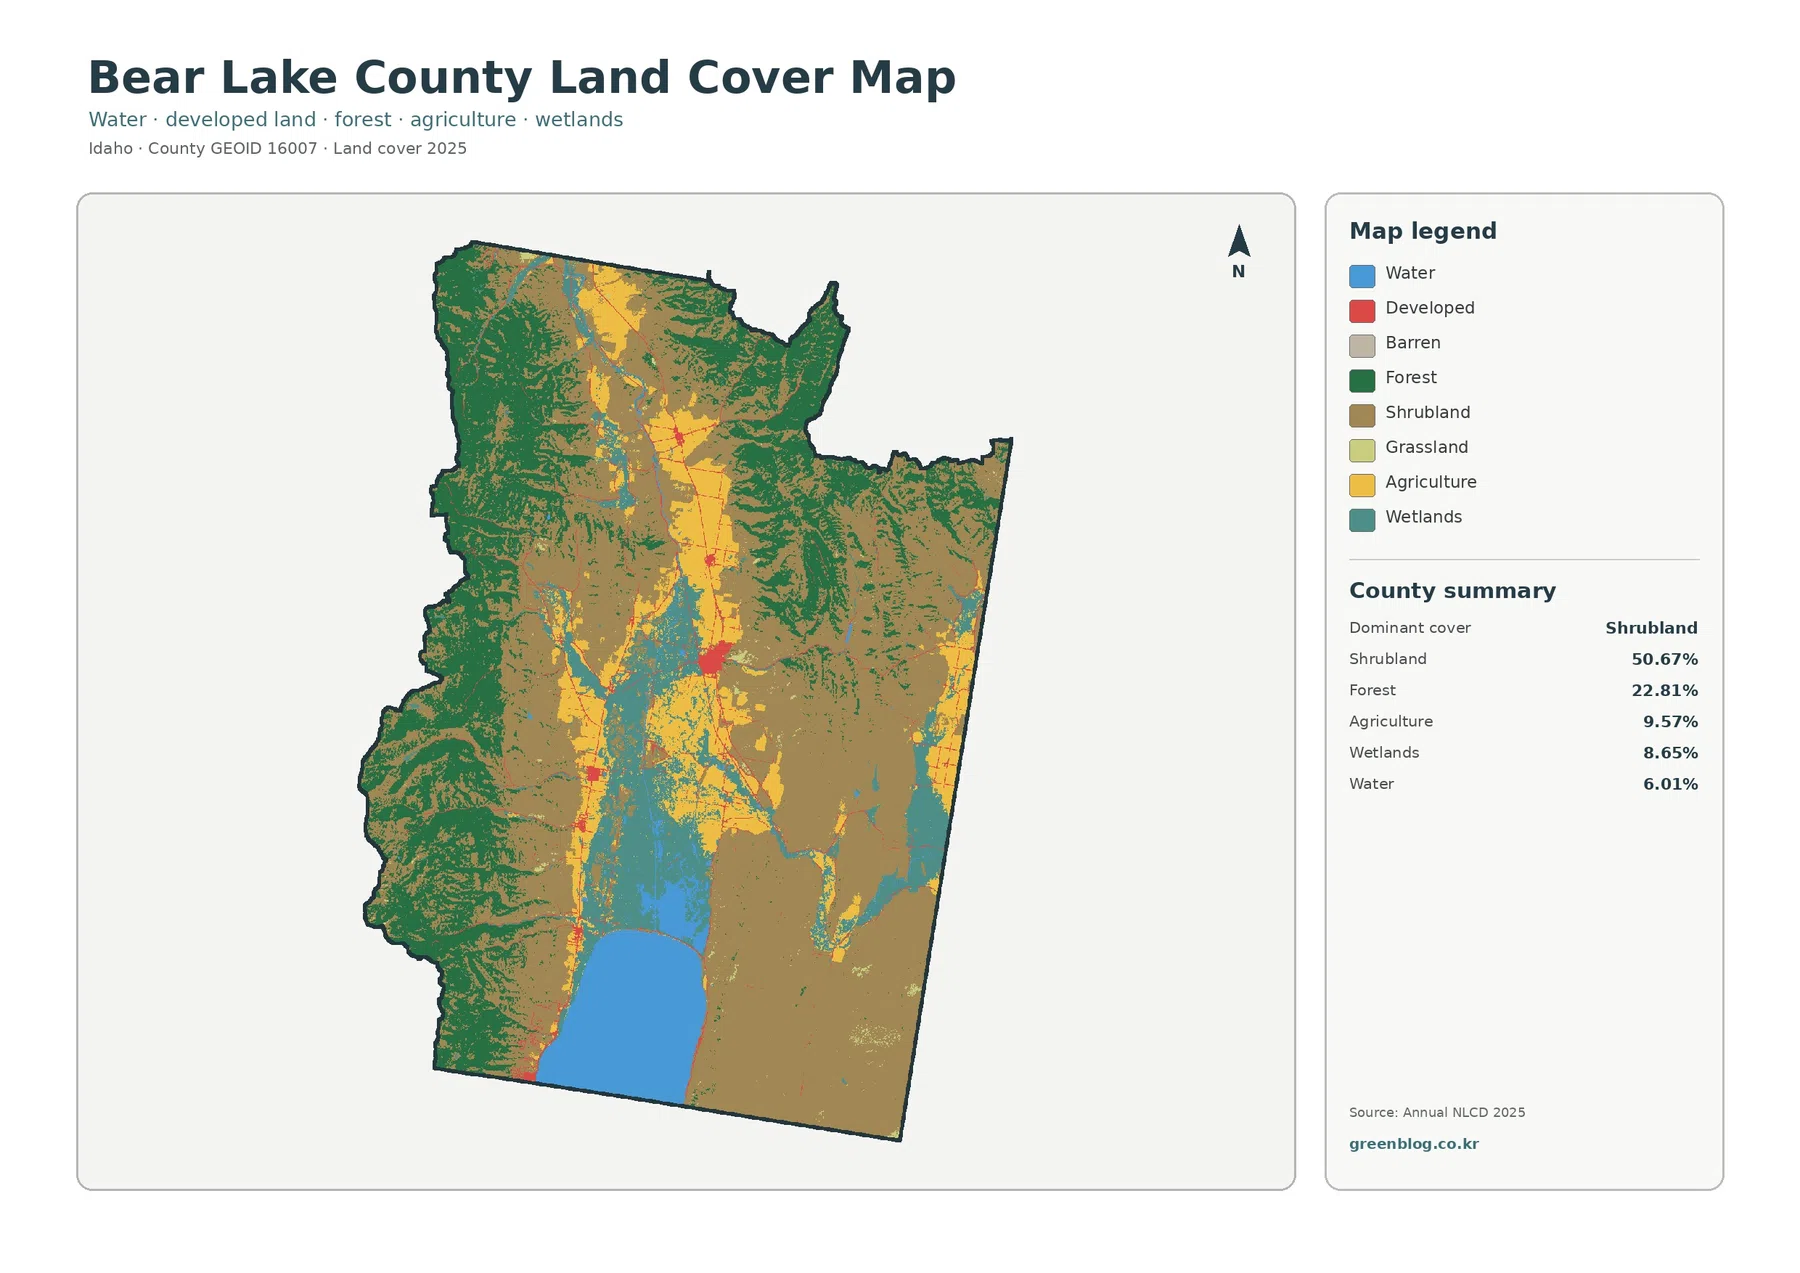
On the full 2025 map, shrubland is the dominant cover at 50.67%. It forms the broad brown background across much of the eastern half and a large part of the south. Forest, at 22.81%, is concentrated much more strongly in the west, where dark green blocks and branching bands cover the mountainous side of the county. The two large classes meet through a broken transition rather than a straight dividing line, with open and wooded surfaces interlocking along slopes and valley margins.
The county’s adopted comprehensive plan describes a strong topographic contrast between the Bear River Range along the west side and the valley floor where Bear Lake and the Bear River are located. That official description helps explain the land-cover arrangement visible here: the western high country carries far more forest, while the central lowland contains agriculture, wetlands, water, and the small developed concentrations. The map does not display elevation values, so the land-cover colors should not be used to estimate exact heights or slopes.
Agriculture covers 9.57% of the county, but its spatial concentration makes it one of the most recognizable features. Yellow fields form a long corridor through the central valley, with broader blocks in the north and middle and additional cultivated areas closer to Bear Lake. Agriculture is not spread evenly into the large eastern shrubland area or the heavily wooded western side. For county-level interpretation, the location of the farm belt is therefore as important as its percentage.
Water accounts for 6.01%, and the large blue Bear Lake section along the south is the clearest reason. Wetlands cover an even larger 8.65% and appear around the lake’s northern side and in multiple bands and patches through the central lowland. Open water and wetlands should not be combined casually: one class represents exposed water surfaces, while wetland classes can include vegetation and seasonally wet ground. Their close proximity on the map reflects a connected lowland setting without making them interchangeable categories.
Grassland is only 0.37% in the supplied summary, so the broad open-looking areas should not be described as grassland simply because they lack dense forest. Most of that open cover is shrubland. This is an important reading point for Bear Lake County, because the difference between shrubland and grassland changes the countywide interpretation. The map supports a description of a shrub-dominant eastern landscape, not a grass-dominant one.
The vegetation view exposes a narrow working-land corridor between larger natural-cover zones
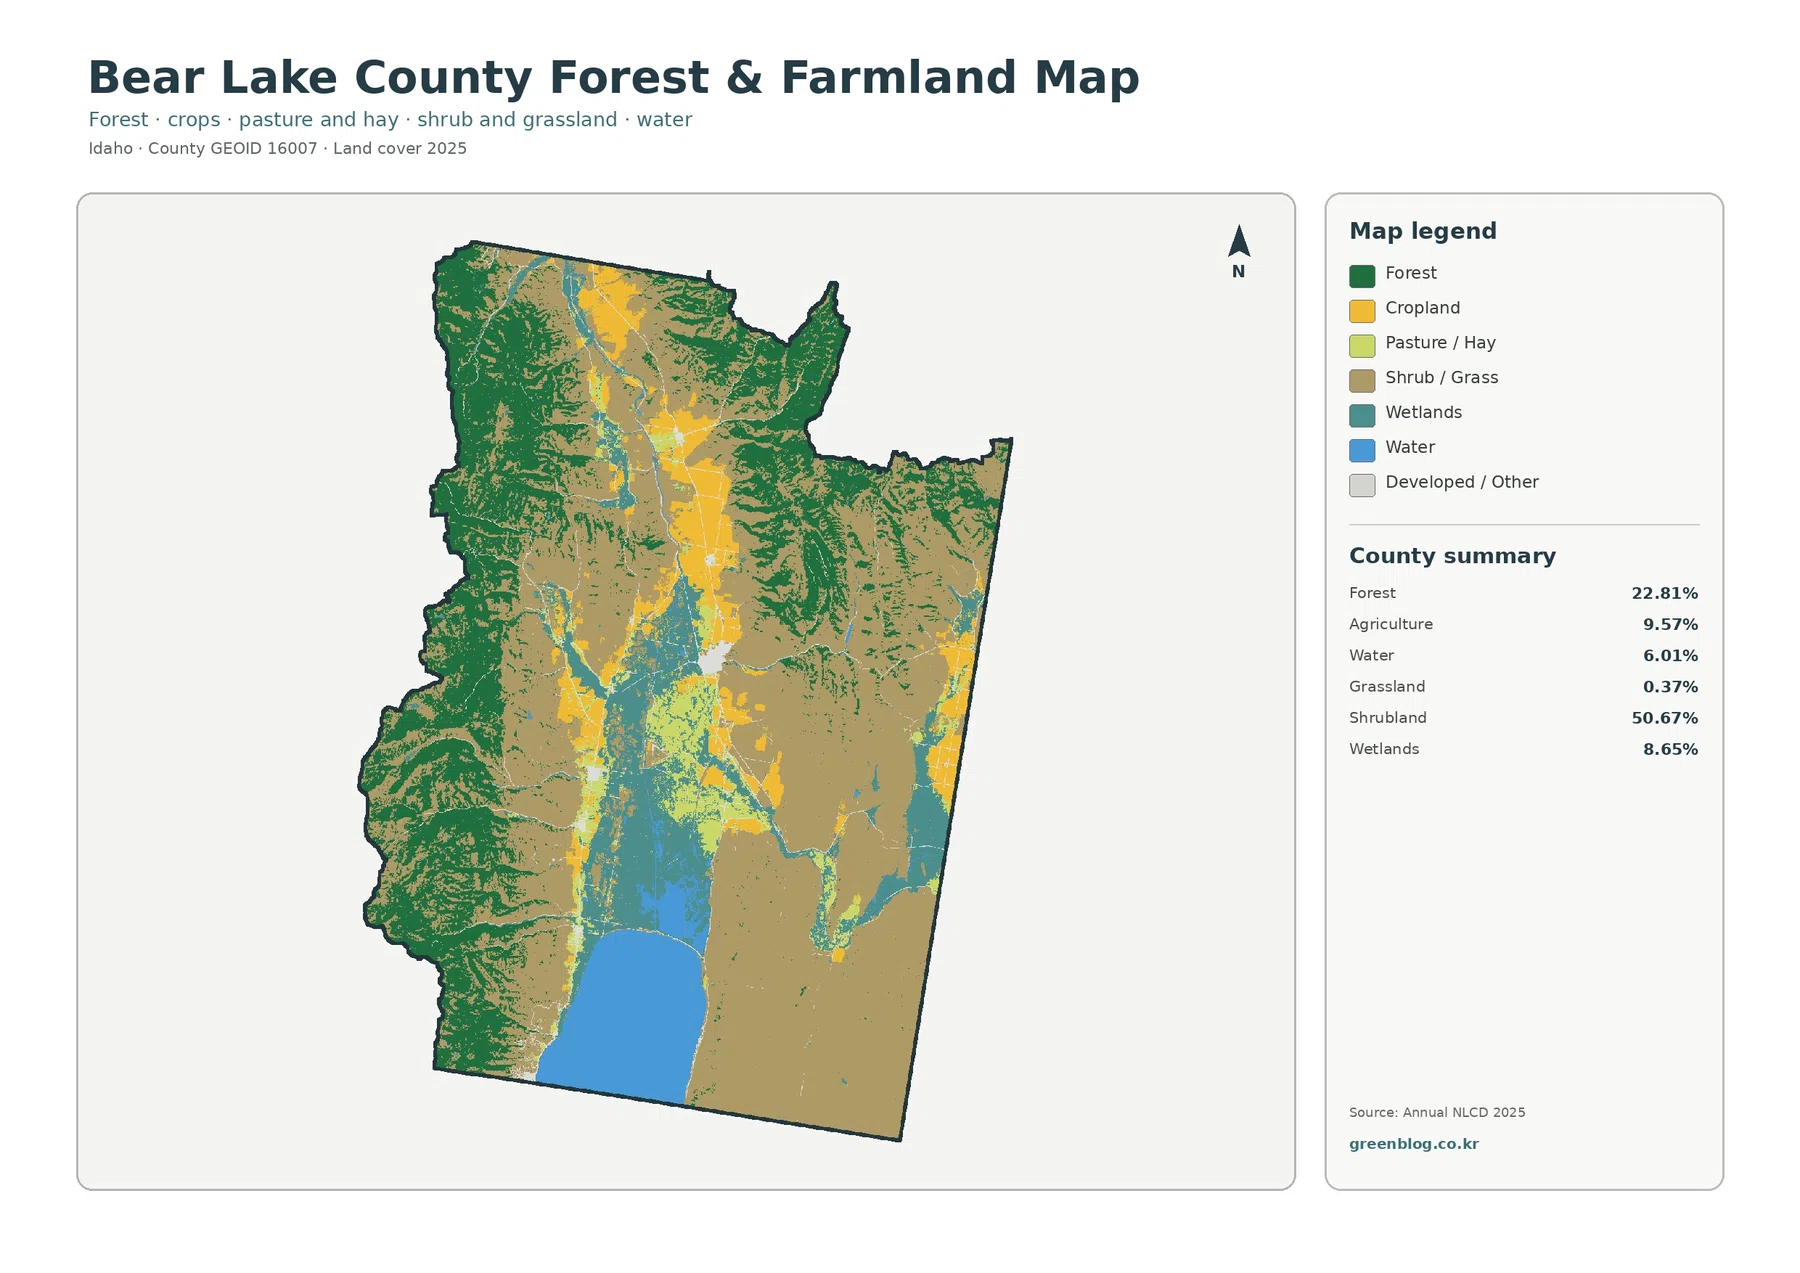
The forest-and-farmland map reduces the number of classes and makes the county’s main vegetation zones easier to compare. Forest remains a broad western feature, while shrub and grass cover occupies most of the east and southeast. Between them, cropland follows a narrow north–south corridor. The simplification is especially helpful around the central valley, where the full land-cover map contains several small classes that can distract from the basic relationship among forest, working land, wet ground, and open shrub cover.
Cropland forms several connected blocks rather than a single continuous field. Some sections widen, others pinch into narrow strips, and pasture or hay appears beside selected agricultural areas. That pattern matters because it shows the 9.57% agriculture share as a valley-focused land-cover system rather than a countywide farm matrix. The largest natural-cover zones remain on both sides of it, so farmland acts more like a central ribbon through the county than a dominant background.
Wetlands are also closely tied to this valley. Teal areas appear around Bear Lake’s northern edge and continue northward through lower ground, sometimes alongside or between agricultural blocks. The map can identify those broad relationships, but it cannot establish a legal wetland boundary or drainage condition for a property. Annual NLCD assigns a predominant class to 30-meter cells, so narrow channels, field edges, wet meadow transitions, and small built features are necessarily generalized.
The western forest is not an ownership map. Bear Lake County’s comprehensive planning documents discuss a mix of private, federal, state, and other land, but the green pixels here describe vegetation cover only. A forest-colored area may fall under different ownership or management, and a cultivated area does not by itself establish a parcel’s zoning or legal agricultural status. Keeping surface cover separate from land ownership is essential when the image is used in reports or local planning discussions.
The 1985–2025 layer shows limited overall difference, with agricultural loss larger than development or forest-loss categories
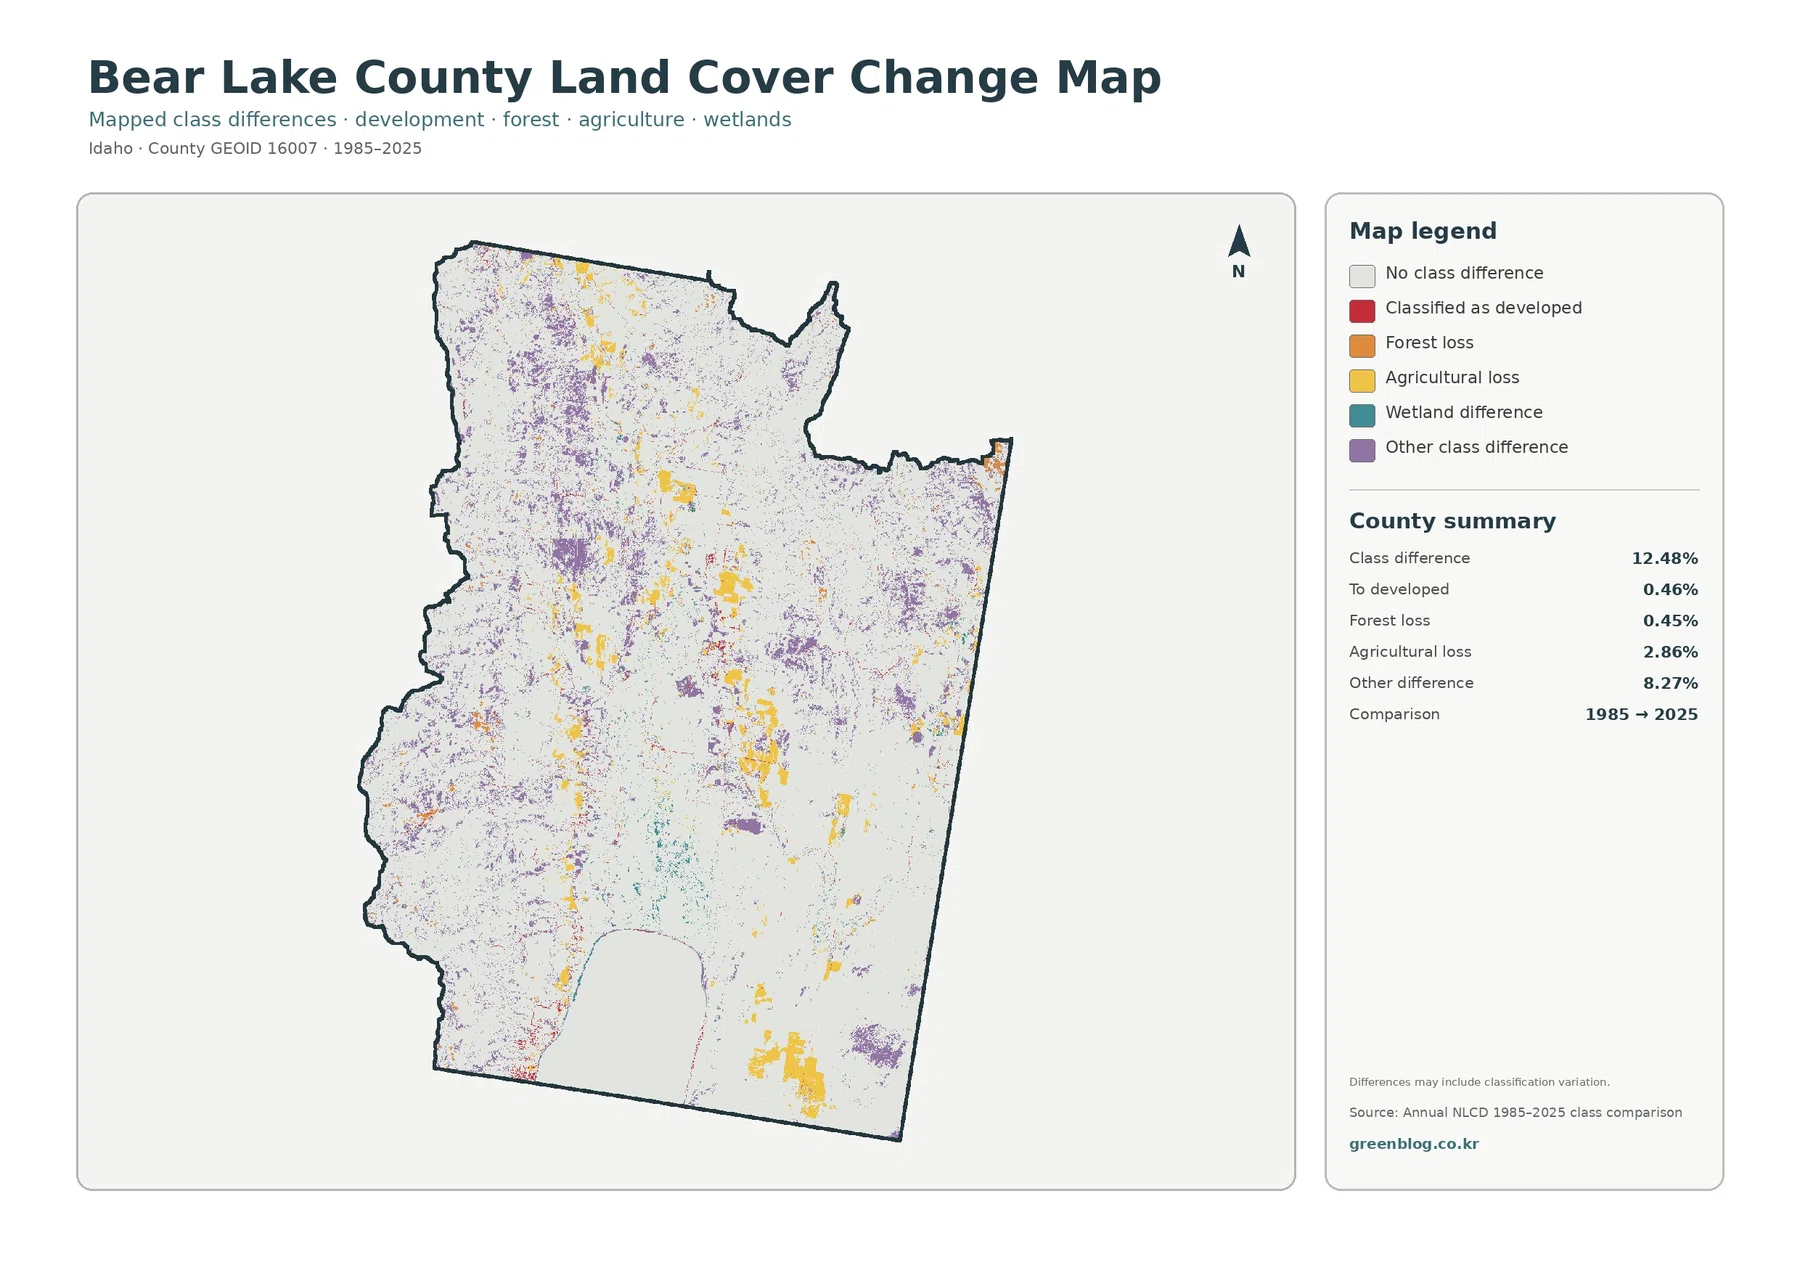
The two-date change map reports a total class difference of 12.48%. That number is not a development rate and it does not mean that one eighth of the county was physically disturbed. It is the share of mapped cells assigned to different classes at the 1985 and 2025 endpoints. The listed components include 2.86% agricultural loss, 0.46% classified to developed, 0.45% forest loss, and 8.27% other class difference. Classification variation may also be present.
Agricultural-loss colors are concentrated mainly along the same central corridor that contains much of the present-day cropland, with additional patches toward the southeast. The overlap identifies places worth closer examination, but it does not reveal the year or cause of a change. A field could have moved between cultivation, pasture, shrub cover, or another class more than once during four decades. Intermediate imagery or agricultural records are needed before assigning a specific land-management history to a colored cell.
Other class difference is the largest named component at 8.27% and appears widely across the county, including shrubland and forest transition zones. This category can include shifts among non-developed classes, so a purple patch should not be described as damage, clearing, or urban growth without additional evidence. Bear Lake County’s broad shrub–forest boundary gives many places where relatively small classification changes can accumulate across a large area even though the county remains overwhelmingly non-urban.
Wetland-difference colors are more localized around the central lowland and near the Bear Lake side of the county. Wet surfaces and vegetation can look different between observation dates because of water levels, seasonal conditions, or actual land-cover change. The endpoint map cannot separate those possibilities by itself. For a wetland-specific question, this layer is best used to identify locations for follow-up with more detailed, current hydrologic or wetland information.
The 0.46% classified-to-developed share is small and is consistent with the low impervious values in the current map. Some red pixels appear near the central built corridor and along narrow connecting traces, but they represent endpoint classification rather than a complete construction history. The combination of the change map and current impervious map supports a cautious conclusion: Bear Lake County has a compact built footprint, while most mapped differences involve non-developed classes or agricultural change.
How to read the four Bear Lake County maps without over-interpreting them
A useful sequence is to establish the current county pattern first, then narrow the question. The full land-cover map explains the large shrubland share, western forest, central agriculture, wetlands, and Bear Lake water. The vegetation map then clarifies the forest-to-farm-to-shrub transition. The impervious layer isolates the small built footprint. Only after those current conditions are clear should the 1985–2025 layer be added, because its colors represent endpoint differences rather than present land-cover classes.
Annual NLCD uses 30-meter raster cells. Each cell receives a predominant class even when several surface types occur inside it. Enlarging the JPG can make the colors easier to see, but it cannot create parcel-level detail that is absent from the source grid. Around narrow farm edges, wetland strips, small settlement traces, and the complex boundary between forest and shrubland, exact on-the-ground boundaries may differ from the generalized pixel pattern.
The 2025 map also represents a specific observation year. Construction, vegetation recovery, fire effects, water-level changes, or agricultural management after that date may not be shown. Bear Lake County’s Planning and Zoning office maintains separate comprehensive planning and land-use documents for questions about legal development and land regulation. Those official planning materials should be used for zoning or permit decisions; this map set is designed to describe surface cover and broad spatial relationships.
For printing, each original JPG measures 2480 × 1754 pixels. The supplied asset manifest does not mark the files as meeting an A3 high-resolution reference, so a proof should be checked before a large poster run. Keeping the original aspect ratio is particularly important here because the county’s long central valley and the large Bear Lake shape can look misleading if the image is stretched. Use one large map for the main point and add a second view when a direct comparison is needed.
The strongest county-specific pairings are straightforward. Use the full land-cover map with the vegetation view to discuss the western forest and central farm corridor. Pair the land-cover map with the impervious layer to contrast the large Bear Lake and natural-cover areas with the tiny hard-surface footprint. Pair the vegetation map with the change layer when discussing agricultural-loss colors or differences along the shrub–forest transition. These combinations preserve readable legends and keep the discussion tied to visible Bear Lake County features.
Download the four original Bear Lake County JPG maps
The ZIP contains the same four original map views discussed above: 2025 land cover, forest and farmland, impervious surface and developed land, and the 1985–2025 class-difference map. Together they preserve the most important Bear Lake County contrasts—the shrub-dominant east, forested west, central agricultural and wetland corridor, Bear Lake water, and the small built footprint—in separate files that can be used without shrinking all four legends into one image.
Frequently Asked Questions
What is the dominant land-cover class in Bear Lake County?
Shrubland is the largest 2025 class at 50.67%. Forest follows at 22.81%, with agriculture at 9.57%, wetlands at 8.65%, and water at 6.01%. The map shows shrubland most broadly in the east and southeast, while the western side is much more forested and the central valley contains most of the agriculture.
Why does Bear Lake County have 1.91% developed cover but only 0.42% mean impervious cover?
Developed land can include lawns, trees, soil, and other permeable surfaces around buildings and roads. The impervious layer isolates pavement, rooftops, and similar hard surfaces. Bear Lake County’s built areas are small and concentrated, so the average hard-surface percentage is much lower than the total developed-class share.
Does the 12.48% class difference mean 12.48% of the county was developed between 1985 and 2025?
No. Only 0.46% is listed as classified to developed at the 2025 endpoint. The 12.48% total also includes 2.86% agricultural loss, 0.45% forest loss, 8.27% other class difference, wetland differences, and possible classification variation. The map compares two endpoints and does not show a year-by-year history.
Sources and Reference Data
- MRLC Annual NLCD Data – official access point for the annual land-cover and change products used for the supplied maps
- USGS Annual NLCD Land Cover Classification – definitions for shrubland, forest, agriculture, wetlands, water, developed land, and other classes
- Bear Lake County Planning & Zoning – official county planning, land-use, and comprehensive-plan resources
- Bear Lake County Comprehensive Plan – local background on the Bear River Range, Bear Lake, Bear River valley, and county setting
Map File Information
The ZIP contains four original Bear Lake County JPG maps covering current land cover, vegetation and working land, hard surfaces, and 1985–2025 endpoint differences.
- Included Files: Four original JPG land-cover maps used in this article
- File Type: JPG images packaged in a ZIP archive
- Intended Use: Printing, education, presentations, and map-based projects
Related Maps
Green Map creates custom-edited map images using open geographic data sources such as geoBoundaries, Natural Earth, OpenStreetMap, and government open data. These maps are edited visual materials, not raw data files, and are provided for education, documents, presentations, and graphic reference.