You can download four high-resolution A3 JPG maps of Lamar County, Texas, in one ZIP from this page. The set includes a general county map, a ranked city map, a terrain-and-water map, and an elevation map. Together they show how Paris and the U.S. 82 corridor sit between the Red River on the north side and a dense network of smaller creeks that cut across the rest of the county. The maps are useful on screen, but the downloadable files make small road numbers, community names, and water labels much easier to inspect.
Paris is the most convenient starting point for reading the county. The general map places it near the center, where several roads converge, while Reno and Blossom continue east along the same broad corridor. The western and southern parts contain smaller communities and fewer large built-up areas. Once the road map is compared with the hydrography and elevation views, the county changes from a simple collection of towns into a landscape of rolling higher ground, branching valleys, and low river corridors.
Table of Contents
Paris and U.S. 82 provide the clearest starting points
Paris is the largest and most visually prominent urban area on the general county map. Its streets and developed area spread around the center of Lamar County, and several numbered routes meet there. U.S. 82 crosses the county from west to east, passing the Brookston and Toco area before reaching Paris and then continuing through Reno toward Blossom. Following that one road makes it easy to understand why the county’s strongest concentration of communities appears across the middle rather than near the northern or southern edges.
Other routes show how travel branches away from Paris. Roads marked 24 and 19 extend south from the central city area, while 271 runs southeast toward Deport. A northbound road leads toward Powderly and the northern part of the county. These routes do not need to be memorized to use the map effectively; finding Paris first and then tracing the lines outward provides a much clearer picture of how communities are connected.
The ranked cities show a strong central cluster and wider outer spacing
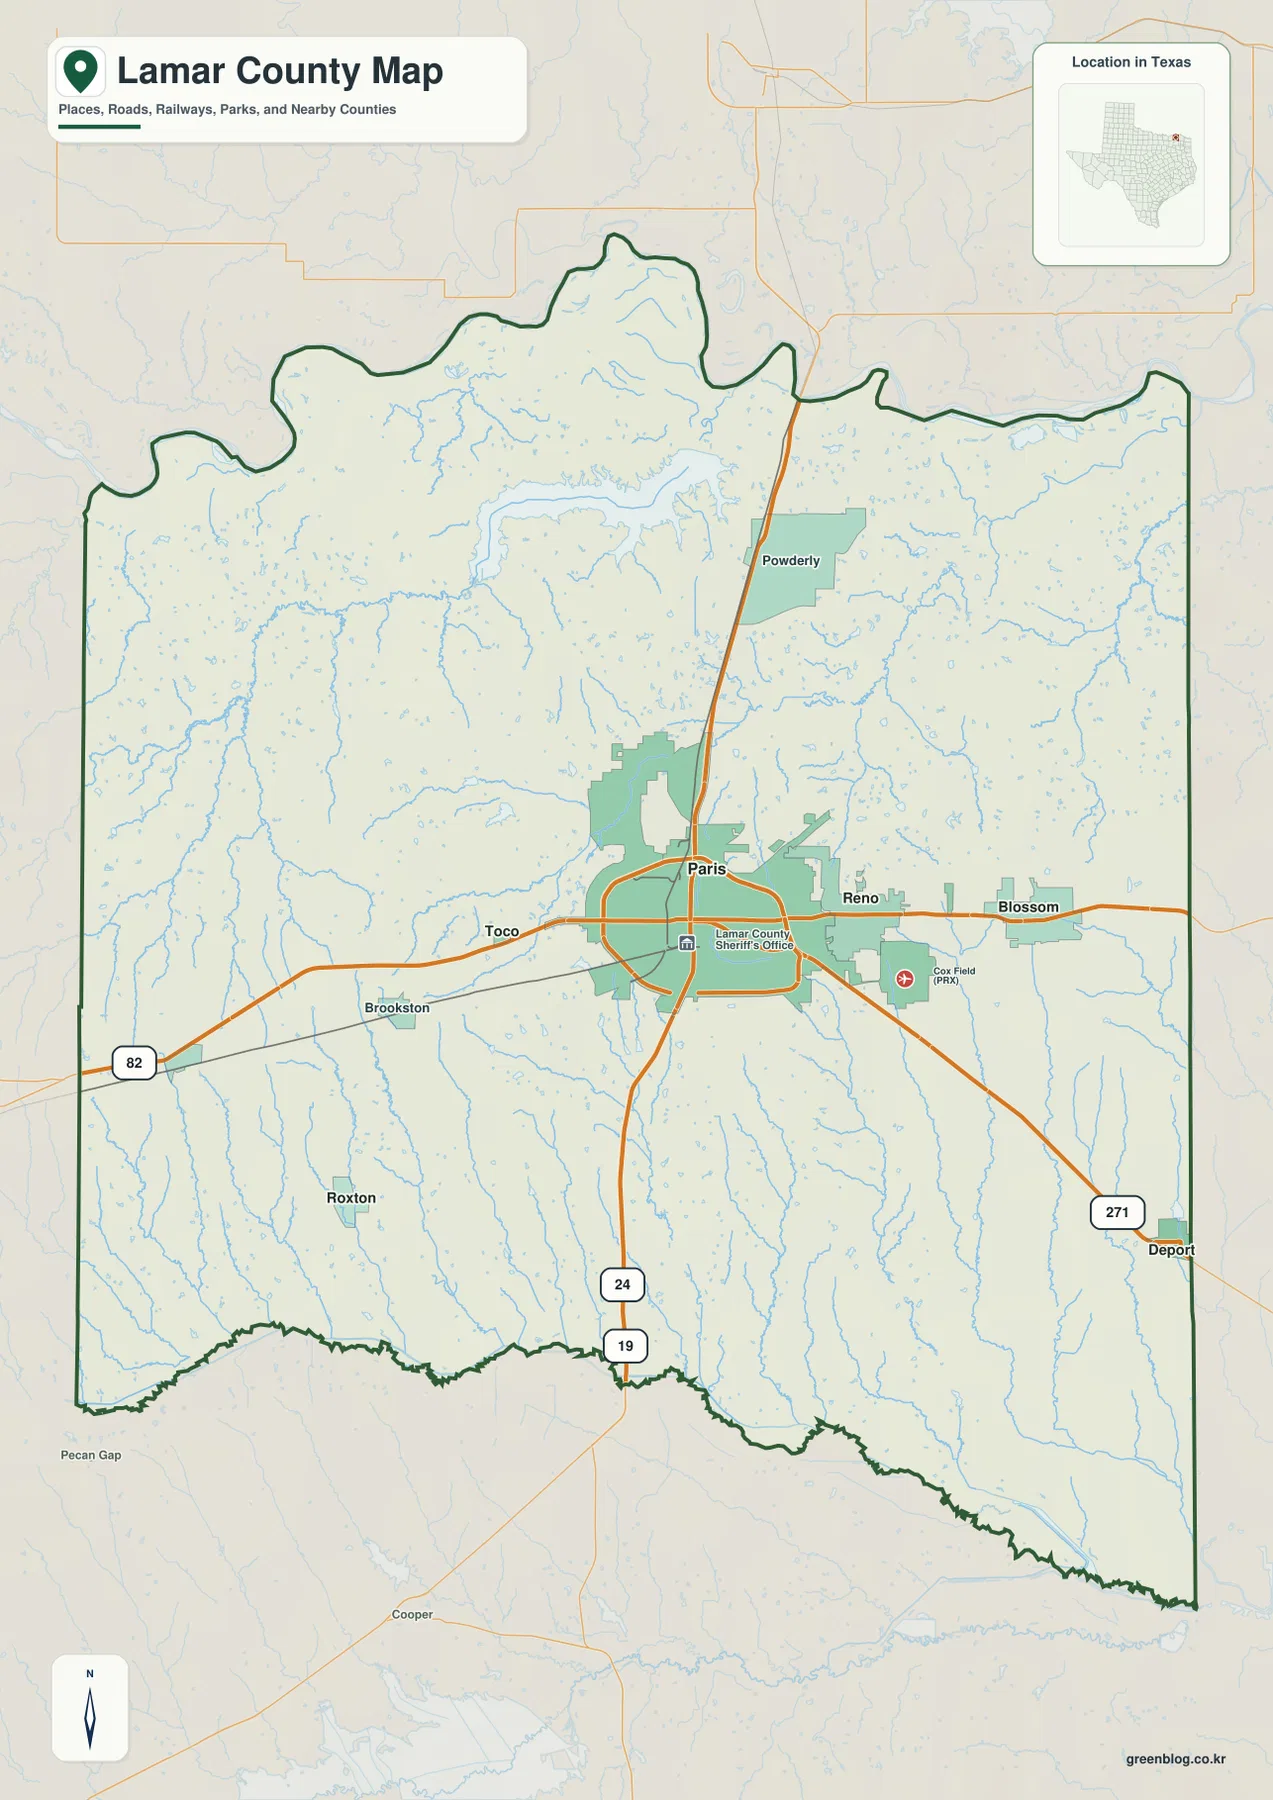
The city map ranks six places: Paris, Reno, Blossom, Deport, Roxton, and Toco. Paris is first and sits near the middle of the group. Reno and Blossom are close together to the east, producing a short chain of major city markers across the central corridor. Toco lies west of Paris, while Roxton is much farther to the southwest and Deport sits near the southeastern side of the county.
This ranked view is intentionally simpler than the general map. Powderly and Brookston are visible on the broader county map but are not part of the six-city index, so the two images answer slightly different questions. The city map is the faster choice when the goal is to compare major communities, whereas the general map is better when roads, smaller places, and the surrounding geography are needed at the same time.
The pattern also helps explain why Paris works so well as a reference point. A reader can move east from Paris to Reno and Blossom, west toward Toco, south-west toward Roxton, or southeast toward Deport. The communities are not evenly spaced across the county, and the northern third contains no comparable ranked city cluster. That difference becomes even more noticeable when the Red River and the creek network are added in the water map.
The Red River frames the north while creeks divide the interior
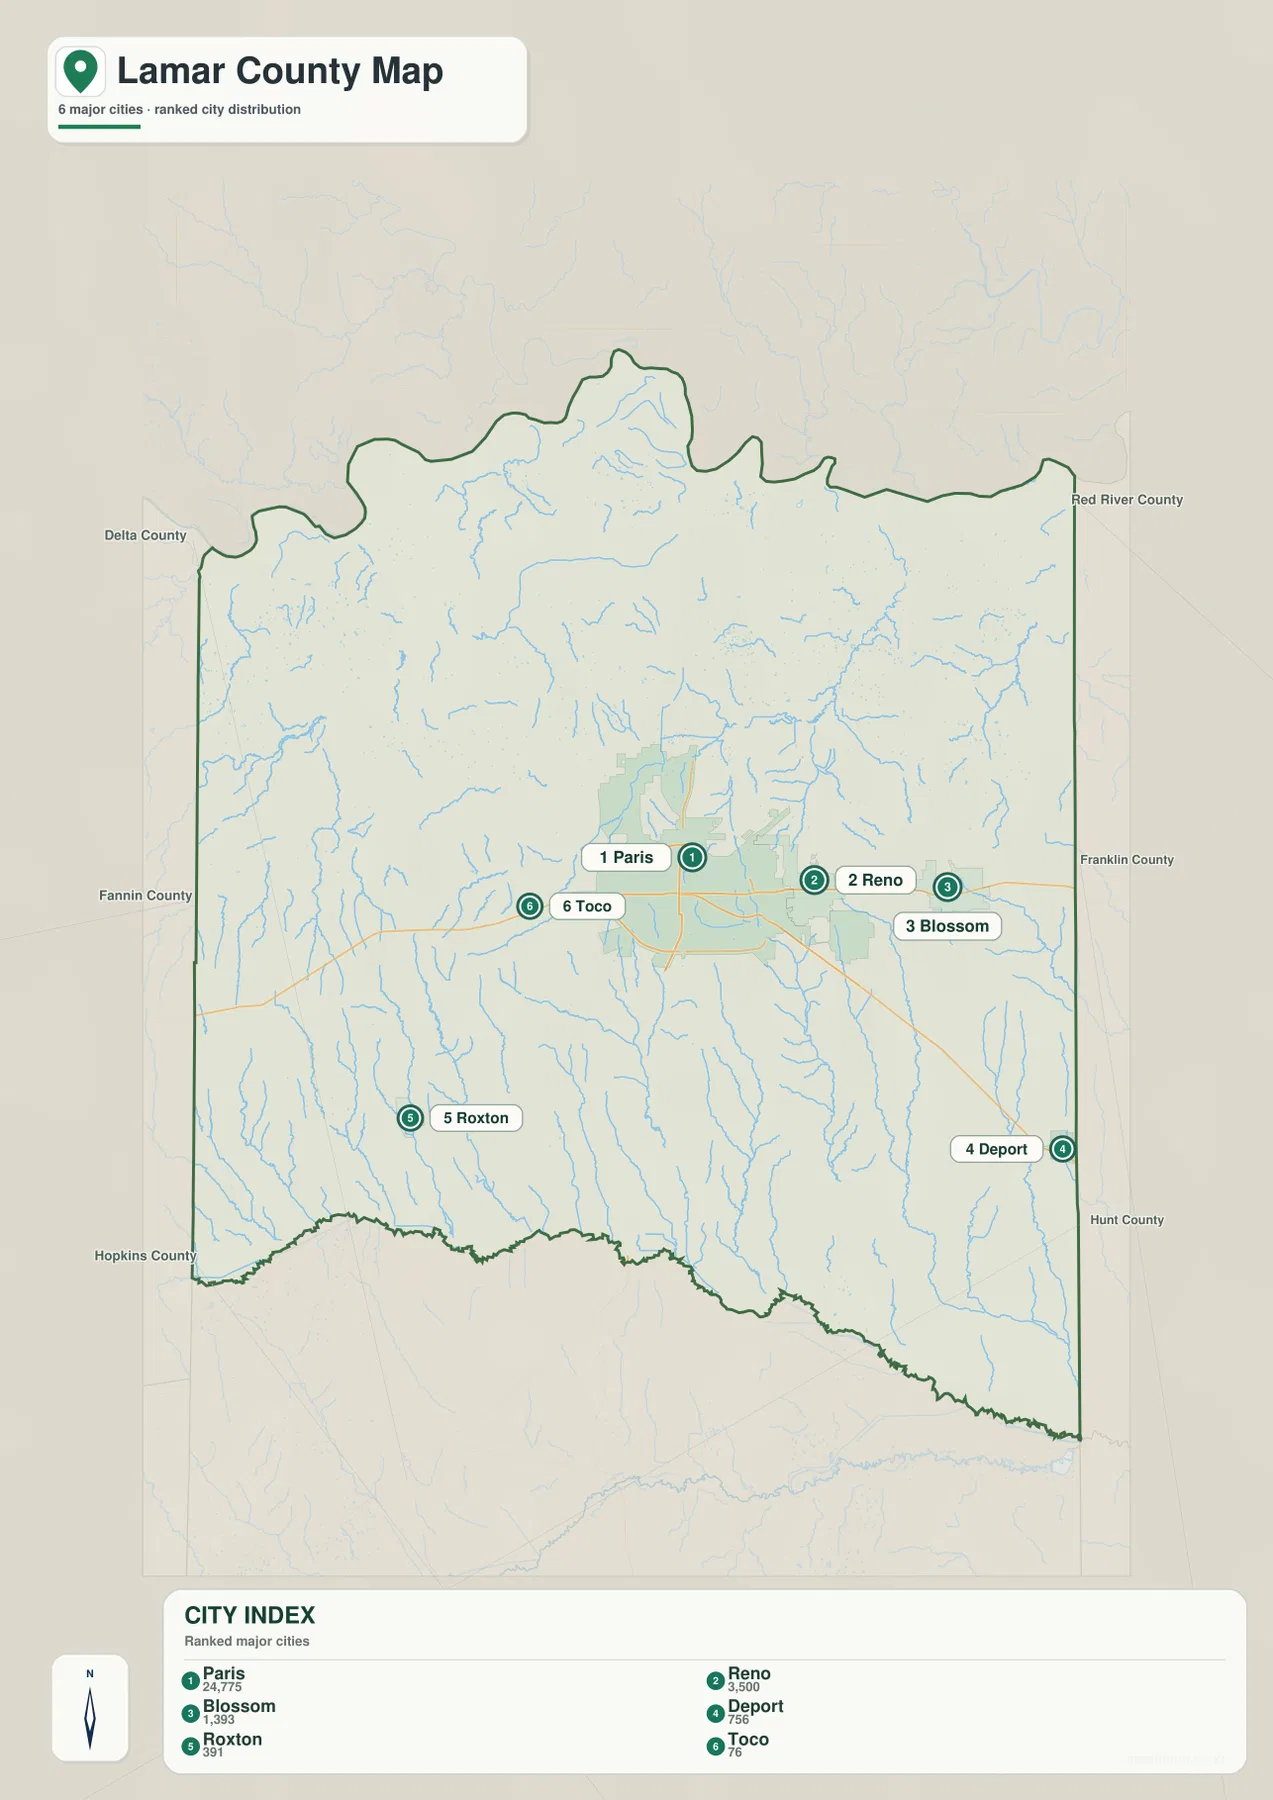
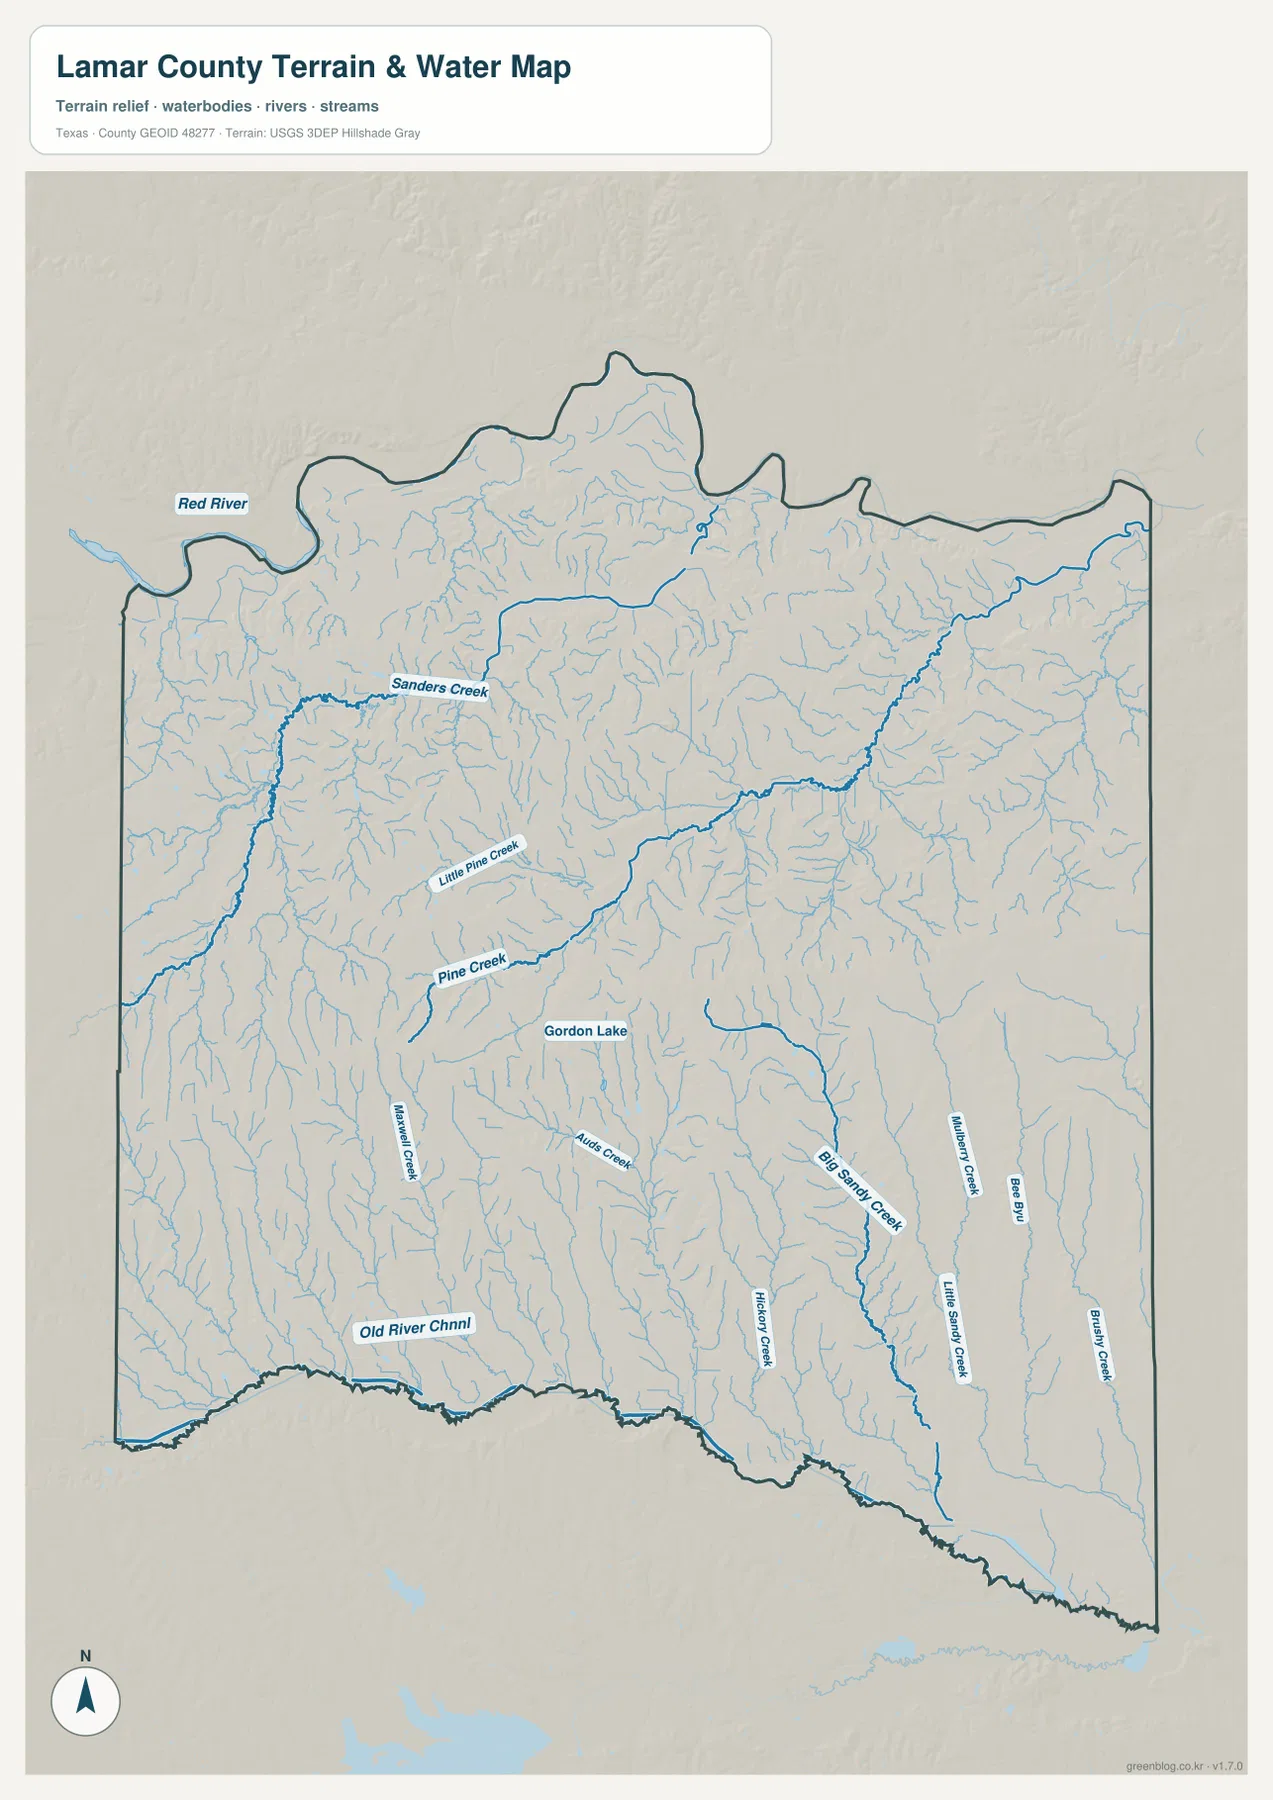
The terrain-and-water map gives the northern edge a very different character from the road map. The Red River is labeled along the northwestern side and continues along the broader northern boundary area. Inside the county, a dense web of smaller channels fills nearly every section. Sanders Creek is one of the more prominent named features in the western half, and Little Pine Creek and Pine Creek form useful references farther south and toward the center.
Gordon Lake is labeled in the central-southern part of the map, where it sits among several tributaries rather than beside a major city. Farther east, Big Sanders Creek and Little Sanders Creek run through the southern and southeastern portions of the county. The map also labels an Old River Chnnl near the southern boundary. These features make it clear that Lamar County is not defined by the Red River alone; small creek valleys are repeated throughout the interior.
Comparing this view with the city map is especially useful around Paris, Reno, and Blossom. The developed central corridor contains many small blue lines that are easy to overlook on the general map. North and south of that corridor, the water network becomes the dominant visual detail. For readers looking for drainage rather than roads, the water map is therefore much more informative than simply enlarging the general county image.
Elevation reveals higher rolling ground in the west and lower river valleys
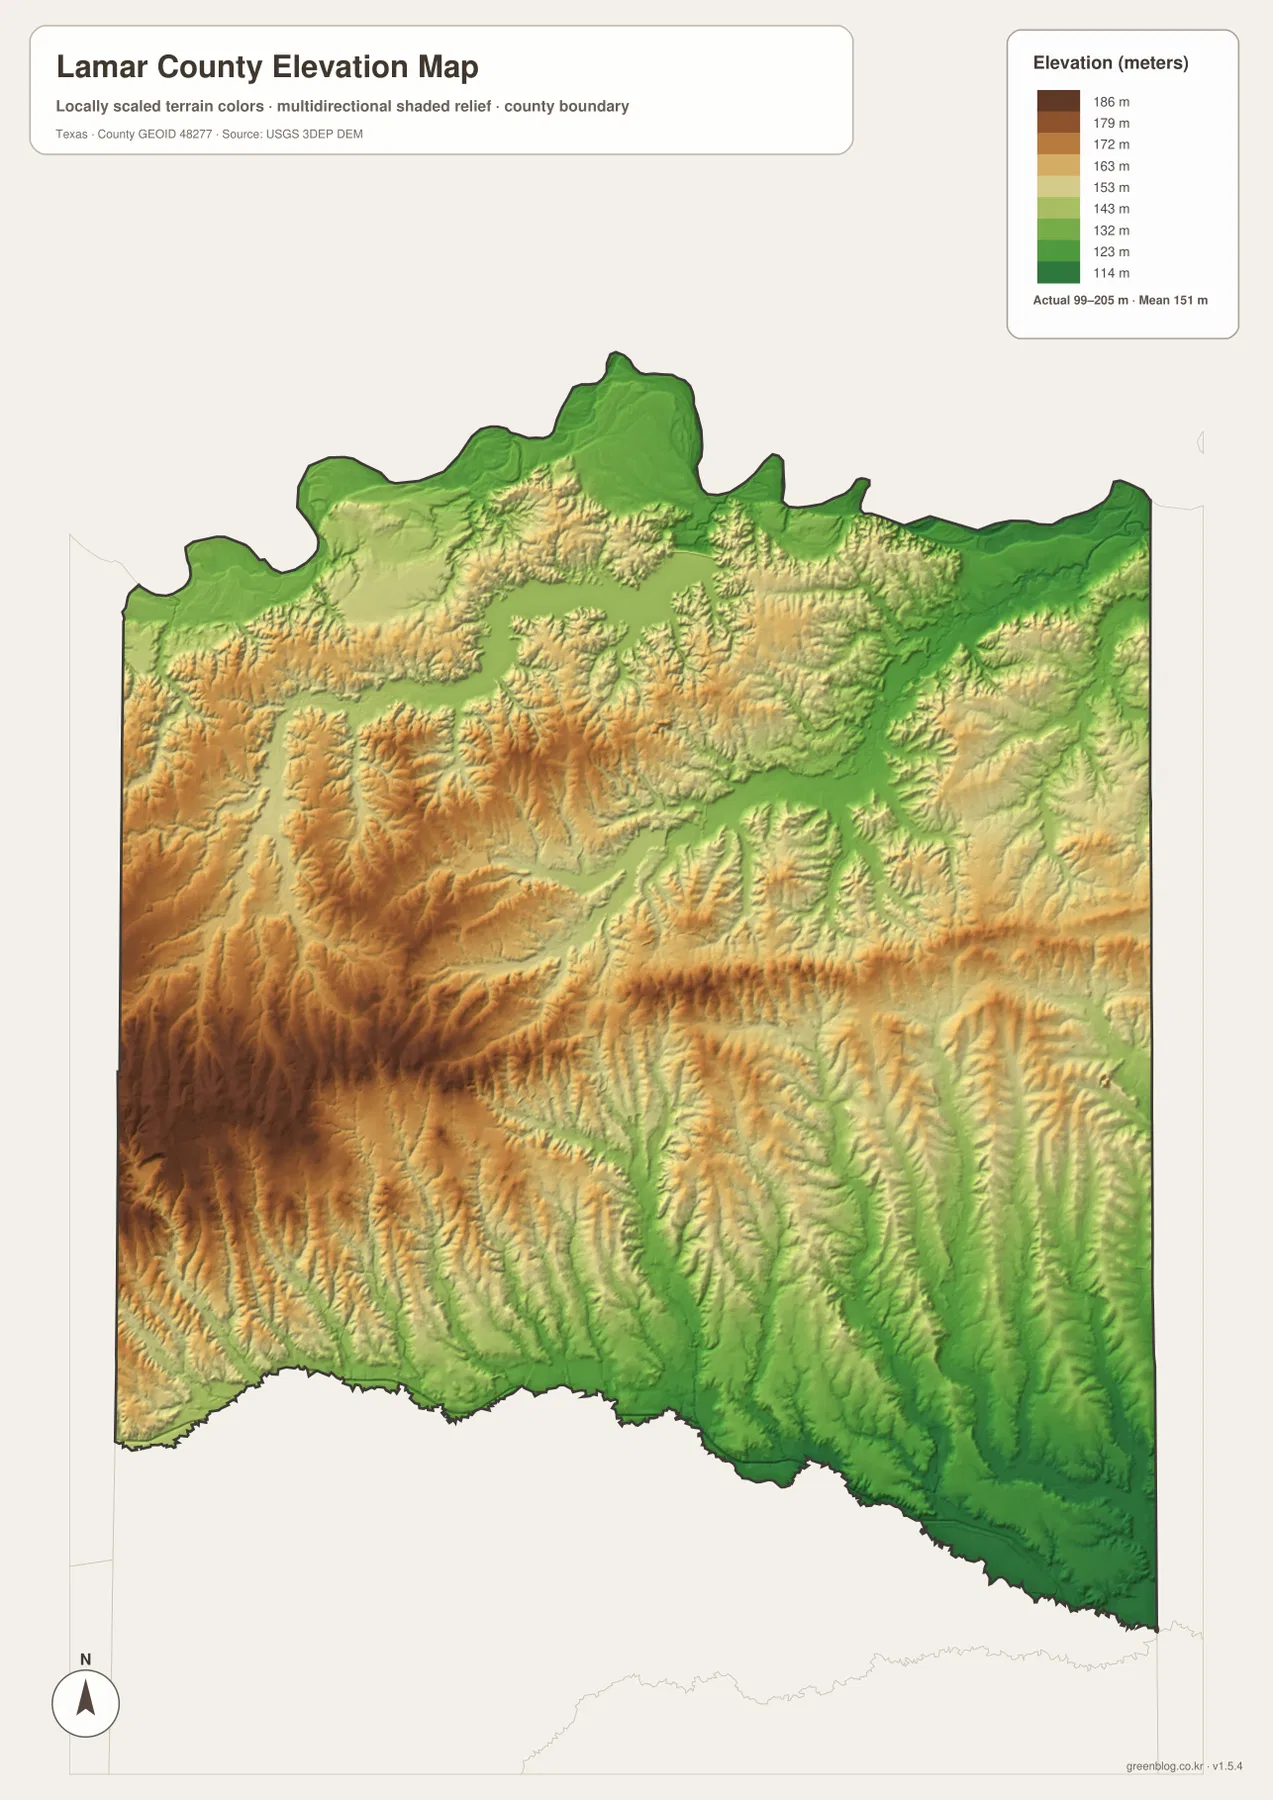
The supplied elevation map reports an actual range of about 99 to 205 meters, with a mean elevation of about 151 meters. Lamar County is not mountainous, but the relief is much more varied than a flat county outline suggests. Browns and tans cover broad areas of the west and southwest, where higher ridges and rolling ground are most visible. Greens are more extensive toward parts of the north and east, marking lower terrain and valley floors.
The southwestern quarter contains some of the strongest relief on the map. Numerous narrow valleys cut into the higher surface and create a branching pattern that closely resembles the creek network on the water map. The Red River side is generally lower, while lower corridors also extend through the interior and toward the southeastern boundary. The result is not a simple north-to-south slope; instead, higher blocks are separated by repeated drainage valleys.
This is why the elevation and water maps work particularly well as a pair. A named creek such as Sanders Creek or Pine Creek can first be located on the hydrography view, then checked against the elevation colors to see whether it occupies one of the lower corridors. The map is not intended to identify individual peaks. Its value is in showing how relatively modest changes in height shape the county’s valleys and rolling terrain.
Choose the map according to the detail you need
For road and community questions, the general county map is the best first view. Paris and U.S. 82 provide an easy orientation, and the same map includes Powderly, Brookston, Deport, and several route numbers. If a cleaner comparison of major communities is needed, the city map removes much of that extra detail and focuses on the six ranked places. Moving between the two views is useful because one emphasizes transportation while the other emphasizes settlement.
For physical geography, begin with the Red River on the water map and then trace Sanders Creek, Pine Creek, Big Sanders Creek, or another named feature. The elevation map can be checked at the same location to see whether the stream follows a lower valley or passes through more rolling ground. Because all four maps use the same Lamar County outline, readers can make these comparisons without having to reorient the county each time.
Small labels are the main reason to use the downloadable files instead of relying only on the web previews. The A3 JPG versions make road shields, creek names, and the city index easier to read at a larger scale, and they are more practical for printing or classroom use. The full download keeps the four images together while still allowing any single map to be used independently.
Frequently Asked Questions
Where is Paris on the Lamar County map?
Paris is near the center of the county and is the largest developed area on the map. U.S. 82 crosses the city, with Reno and Blossom to the east and Toco and Brookston to the west, making Paris the easiest reference point for locating other communities.
Which map is best for the Red River and smaller creeks?
The terrain-and-water map is the clearest choice. It labels the Red River and named interior features such as Sanders Creek, Little Pine Creek, Pine Creek, Big Sanders Creek, Little Sanders Creek, and Gordon Lake.
What elevation range is shown for Lamar County?
The elevation map lists an actual range of about 99 to 205 meters and a mean of about 151 meters. Higher rolling terrain is most noticeable in the west and southwest, while lower areas follow the Red River and many of the creek valleys.
Sources and Reference Data
- U.S. Census Bureau TIGER/Line Shapefiles — official geographic boundary and transportation reference data.
- USGS National Hydrography — official hydrography resources for rivers, creeks, lakes, and related water features.
- USGS 3D Elevation Program — official elevation resources used for terrain information.
- USGS The National Map Viewer — an official viewer for checking multiple geographic layers.
Map File Information
Download four high-resolution A3 JPG maps of Lamar County, Texas, in one ZIP file.
- Included Files: county map, city map, terrain and water map, elevation map
- File Type: JPG
Related Maps
- Red River County Texas map
- Titus County Texas map
- Wood County Texas map
- Rains County Texas map
- Rockwall County Texas map
Green Map creates custom-edited map images using open geographic data sources such as geoBoundaries, Natural Earth, OpenStreetMap, and government open data.
These maps are edited visual materials, not raw data files, and are provided for education, documents, presentations, and graphic reference.