Scott County, Illinois is dominated by agriculture, but the supplied maps show more variety than the 75.42% farm share suggests. Winchester forms the clearest developed core near the center, smaller built clusters appear elsewhere, woodland becomes more frequent across the east and south, and the western boundary adds water and wetland cover associated with the Illinois River corridor. The four maps on this page separate those patterns into present-day land cover, forest and farmland, impervious surface, and 1985–2025 class differences.
The four original JPG files are available together in one ZIP. Use the general 2025 map when you need the complete county pattern, the forest-and-farmland map when agriculture and woodland are the main comparison, the impervious map for Winchester and the road network, and the change map when you want to identify cells whose broad class differs between 1985 and 2025.
Table of Contents
Winchester is the built center inside a mostly agricultural county
Scott County’s official website identifies Winchester as the county seat, and the maps make that role easy to recognize. A compact developed cluster sits near the center of the county, surrounded by a much larger agricultural landscape. Farther away, built cover becomes thinner and more scattered. The county government also lists Bluffs, Manchester, Alsey, Exeter, Glasgow, and Naples among its municipalities, giving useful local context for the smaller development marks visible away from Winchester.
The 2025 land-cover summary is led by agriculture at 75.42%. Forest accounts for 15.60%, developed land 6.00%, wetlands 1.86%, and water 0.84%. The broad western and central farm areas make agriculture visually dominant, yet forest is not spread evenly across the county. Larger and more connected green areas occur in the east and south, while water and wetlands are especially noticeable along the western edge.
Illinois Department of Natural Resources material identifies Naples in Scott County in connection with the Illinois River. That reference helps explain the western side of the map, where water follows the county edge and is bordered in places by wetland and forest colors. Because the land-cover image does not label individual channels, it is better to describe this as Illinois River corridor context rather than assign a specific river name to every blue feature.
The 2025 map separates broad farm blocks from wooded drainages and the river side
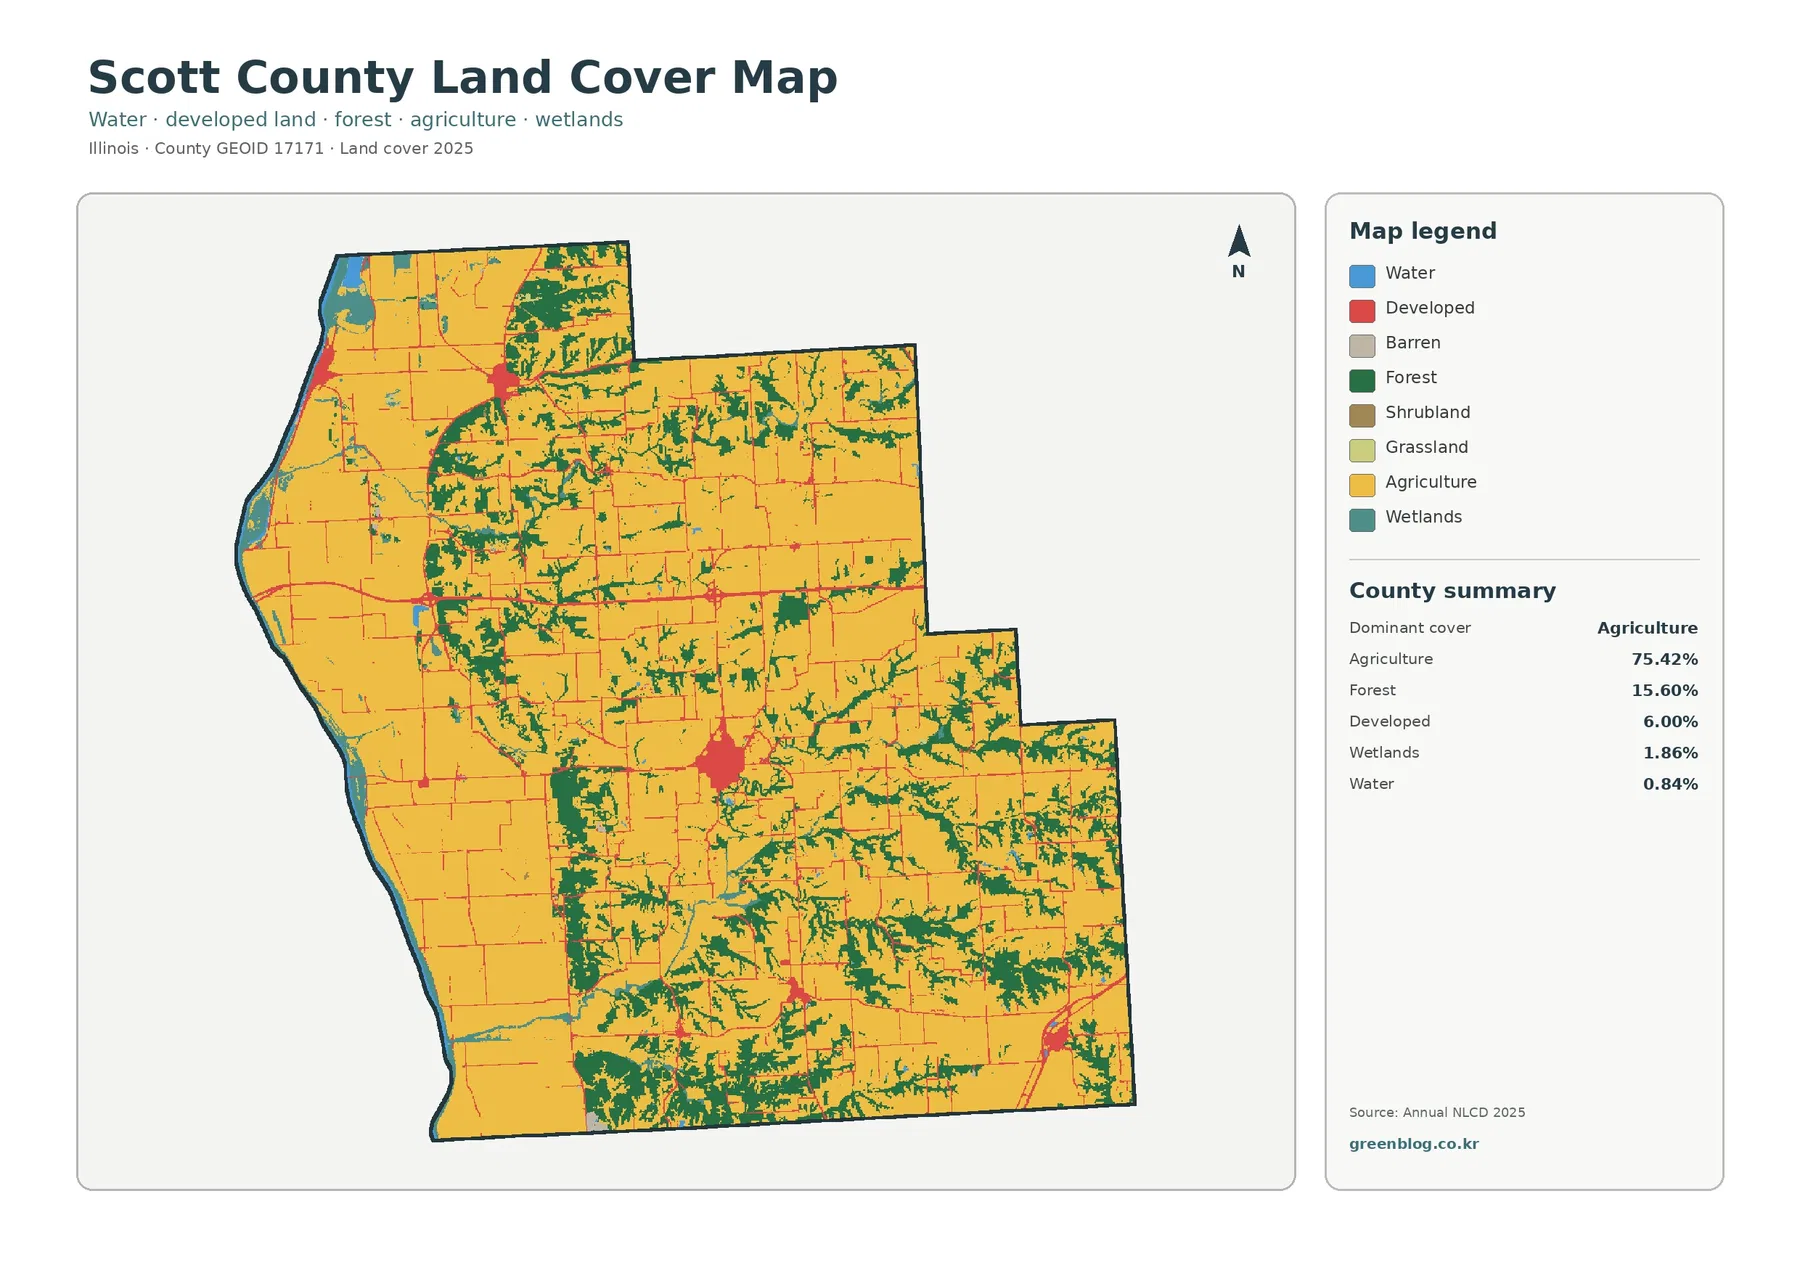
Start with the western half. Large yellow agricultural areas continue for long distances with only narrow strips of other cover breaking them apart. Near the western boundary, however, blue water and teal wetlands create a very different edge. Those water-related classes are small in county-wide percentage terms, but their linear position makes them visually important. A reader can quickly see that the river side is not simply an extension of the inland farm pattern.
The eastern half contains more woodland. Green areas repeatedly branch through the agricultural background, especially toward the southeast and along several narrow corridors. These patterns are visible without assigning a name to every stream or valley. The important map observation is that forest is concentrated in particular belts rather than evenly distributed. That concentration explains why 15.60% forest can have a strong visual presence even though agriculture covers nearly three-quarters of the county.
Winchester appears as the strongest red developed cluster near the middle of the county. Roads extend away from it as thin developed traces, while smaller clusters occur to the northwest and in the southern part of the map. The county’s official municipality list provides useful context for those smaller settlements, but the land-cover map itself does not print place labels. Exact municipal boundaries should therefore be checked on an administrative map rather than inferred from the red pixels alone.
Wetlands make up 1.86% and water 0.84%. Those figures are modest, yet the map shows that their geographic position matters. Water and wetland cells are concentrated near the western boundary and in a few narrow interior features, often beside forest. This makes the map useful for explaining how agricultural land meets natural cover near a river corridor, but it does not provide flood zones, water quality, levees, or legally regulated wetland boundaries.
Land cover is a description of the surface, not a zoning map. A developed pixel does not tell you whether land is residential, commercial, industrial, or public. An agricultural pixel does not establish ownership, crop type, or farmland-protection status. Parcel lines, permits, zoning districts, drainage rules, and legal wetland determinations require the appropriate county or state records.
Impervious cover shows how small the built footprint is outside Winchester
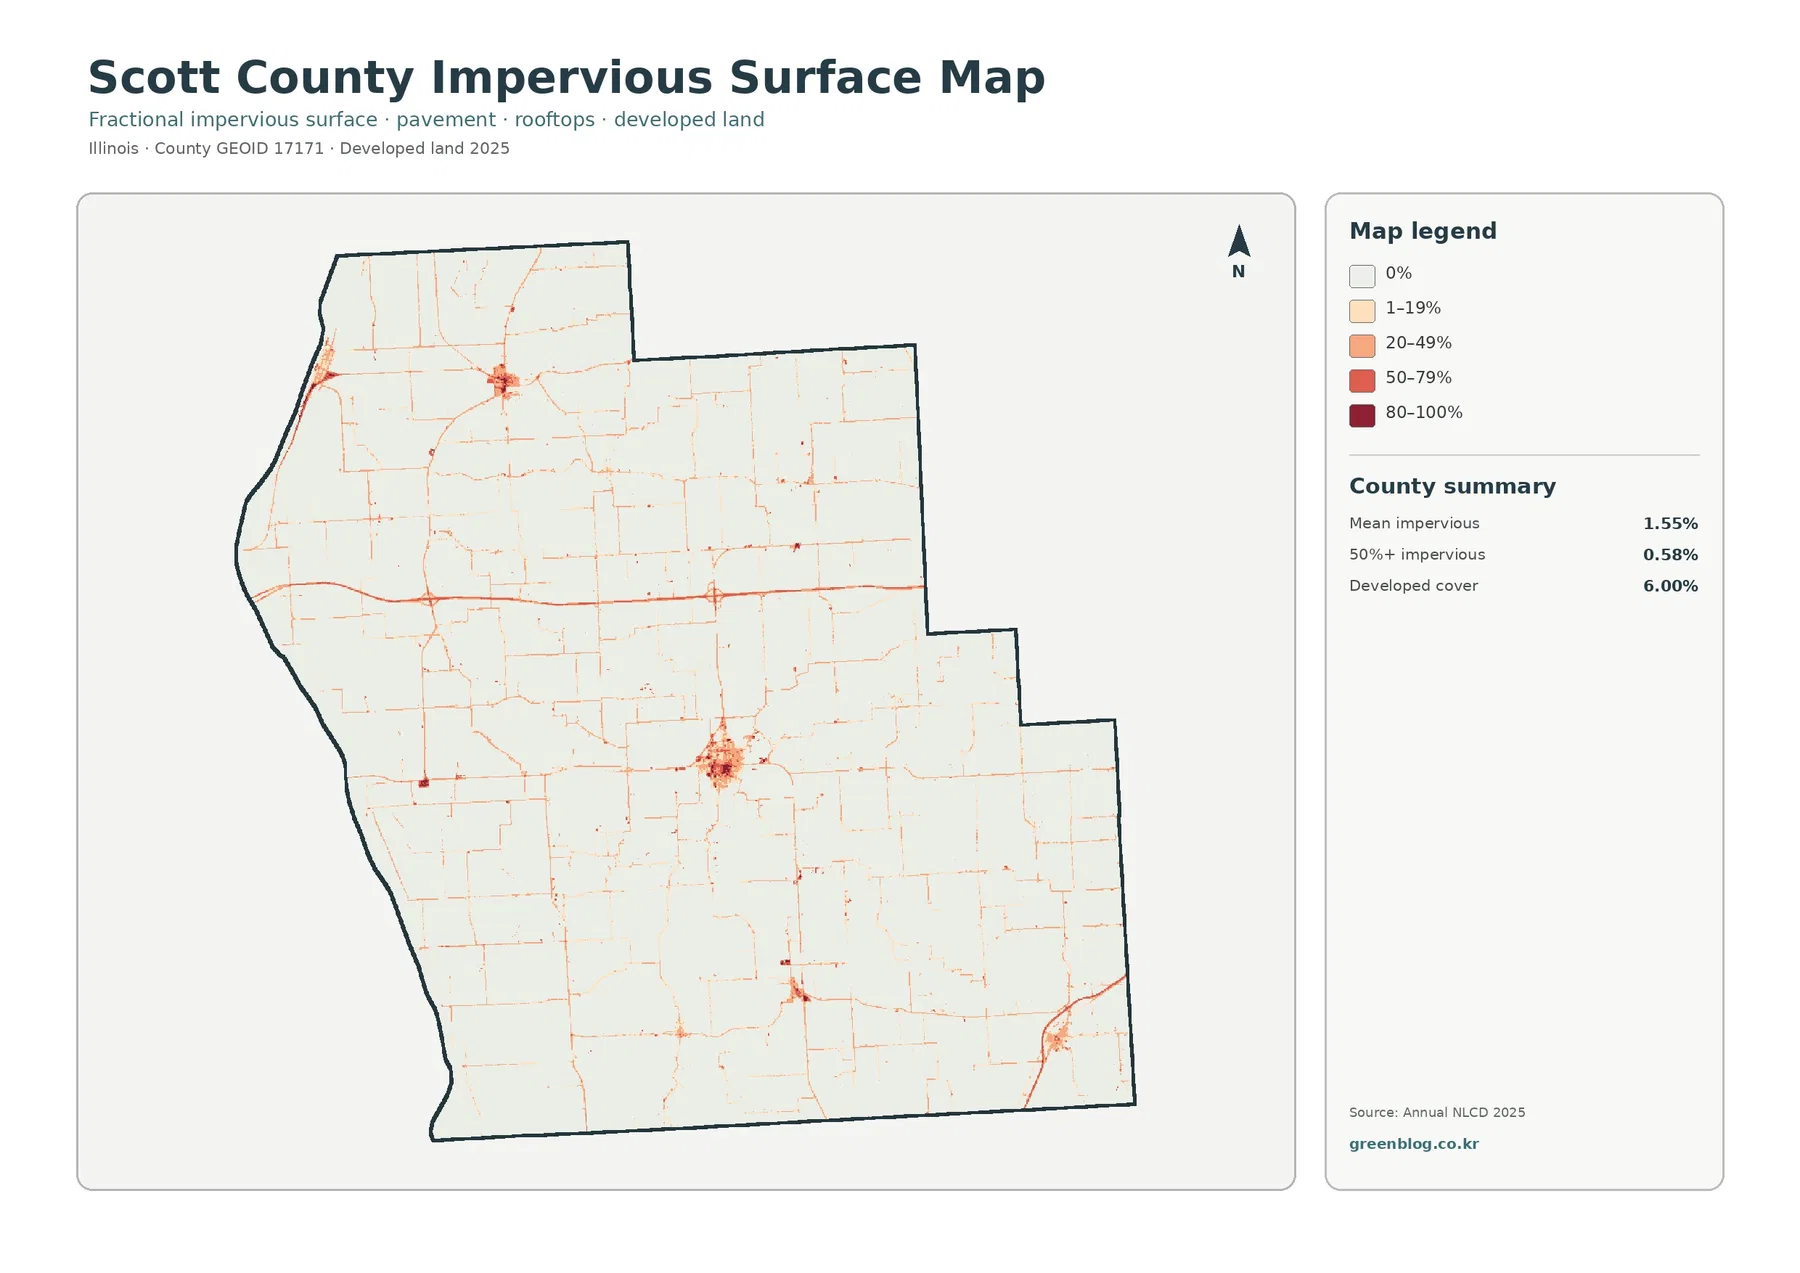
Impervious surface means hard cover such as pavement, parking areas, and rooftops where rainfall cannot readily soak into the soil. The county-wide mean is 1.55%, and cells with at least 50% impervious surface account for 0.58%. Developed land is 6.00% in the general land-cover summary. Together, those values describe a rural county where built areas are visible but occupy a small fraction of the overall surface.
Winchester is the darkest and broadest cluster. Within and around the central town, orange and red cells form a dense patch rather than a single thin line. Outside that core, the map changes rapidly to a pale background. Roads remain visible as fine linear marks, which helps show how the settlement network connects through large areas of farmland without creating a continuous urban surface.
A second noticeable cluster appears in the northwest. The county government’s municipality list includes Bluffs and Naples on the western side of Scott County, while the Illinois State Archives confirms Winchester as the county seat and lists the county’s municipal and precinct structure. The impervious map is useful for comparing these separate rural centers, but because names are not printed on the image, small clusters should be treated as settlement patterns unless a second map confirms the exact place.
The southeastern part of the county contains another strong road-related pattern near the boundary. Much of it is linear, with a few darker nodes rather than one large compact block. This is a good example of why developed land and impervious percentage should not be treated as identical. A low-density developed cell may include yards, trees, and other permeable surfaces, while the impervious layer measures the share of hard surface within the cell.
Annual NLCD is a Landsat-based raster product at 30-meter spatial resolution. A 30-meter cell can contain several real-world features at the same time, so a road, roof, lawn, and tree line may be generalized into one value. The impervious map is appropriate for county-scale comparison, not for calculating the paved area of a specific parcel or designing site drainage.
Forest and farmland are more interwoven in the east and south
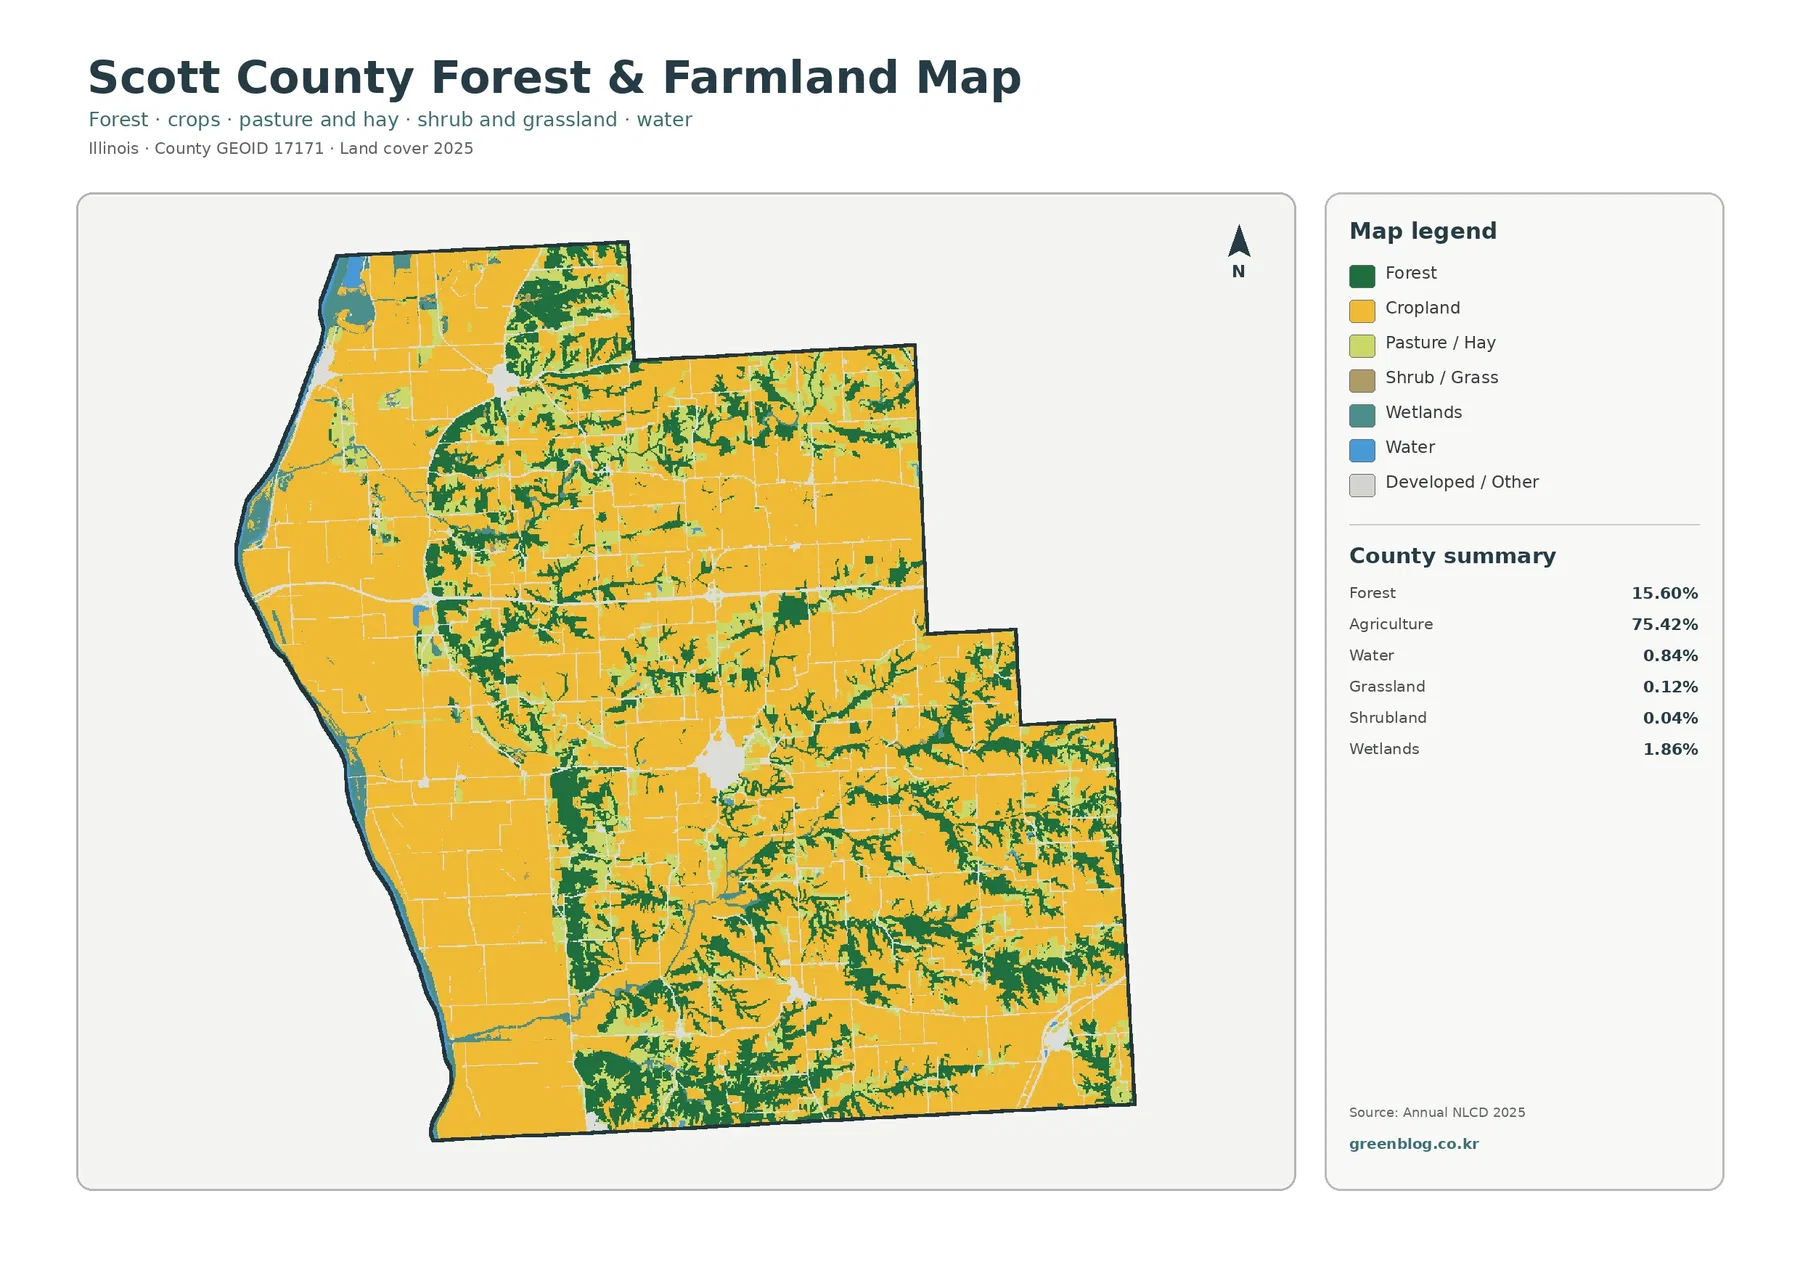
The forest-and-farmland map removes much of the visual competition from minor developed classes. Agriculture at 75.42% becomes a broad yellow field, while forest at 15.60% stands out as a network of green belts and blocks. The west and central-west are especially open, with large farm areas separated by fewer wooded corridors. Moving east and south, green cover becomes more frequent and more connected.
The map’s eastern half is useful for showing that forest is not simply a border around agricultural fields. In several places it cuts deeply into the farm landscape in branching shapes. Similar patterns appear in the south, where wooded cover repeatedly separates agricultural openings. These forms may align with local drainage and terrain, but the supplied land-cover map does not provide elevation or stream names, so the safest interpretation is a visible concentration of woodland along narrow landscape corridors.
The simplified legend also reports grassland at 0.12% and shrubland at 0.04%. They are part of the county’s cover, but they are too small to define the county-wide story. For most readers, agriculture, forest, wetlands, and water provide a clearer explanation. The minor classes can be mentioned when discussing the legend without turning very small percentages into major landscape themes.
The Illinois River side adds a second type of natural-cover contrast. Water and wetland colors sit beside agriculture and forest along the western boundary. IDNR’s reference to the Illinois River at Naples gives that edge a verified river context. The forest-and-farmland map can support watershed or landscape lessons, but it does not grade habitat quality, identify forest ownership, or show regulatory boundaries.
Only 0.75% is mapped as developed change within a 9.41% total class difference
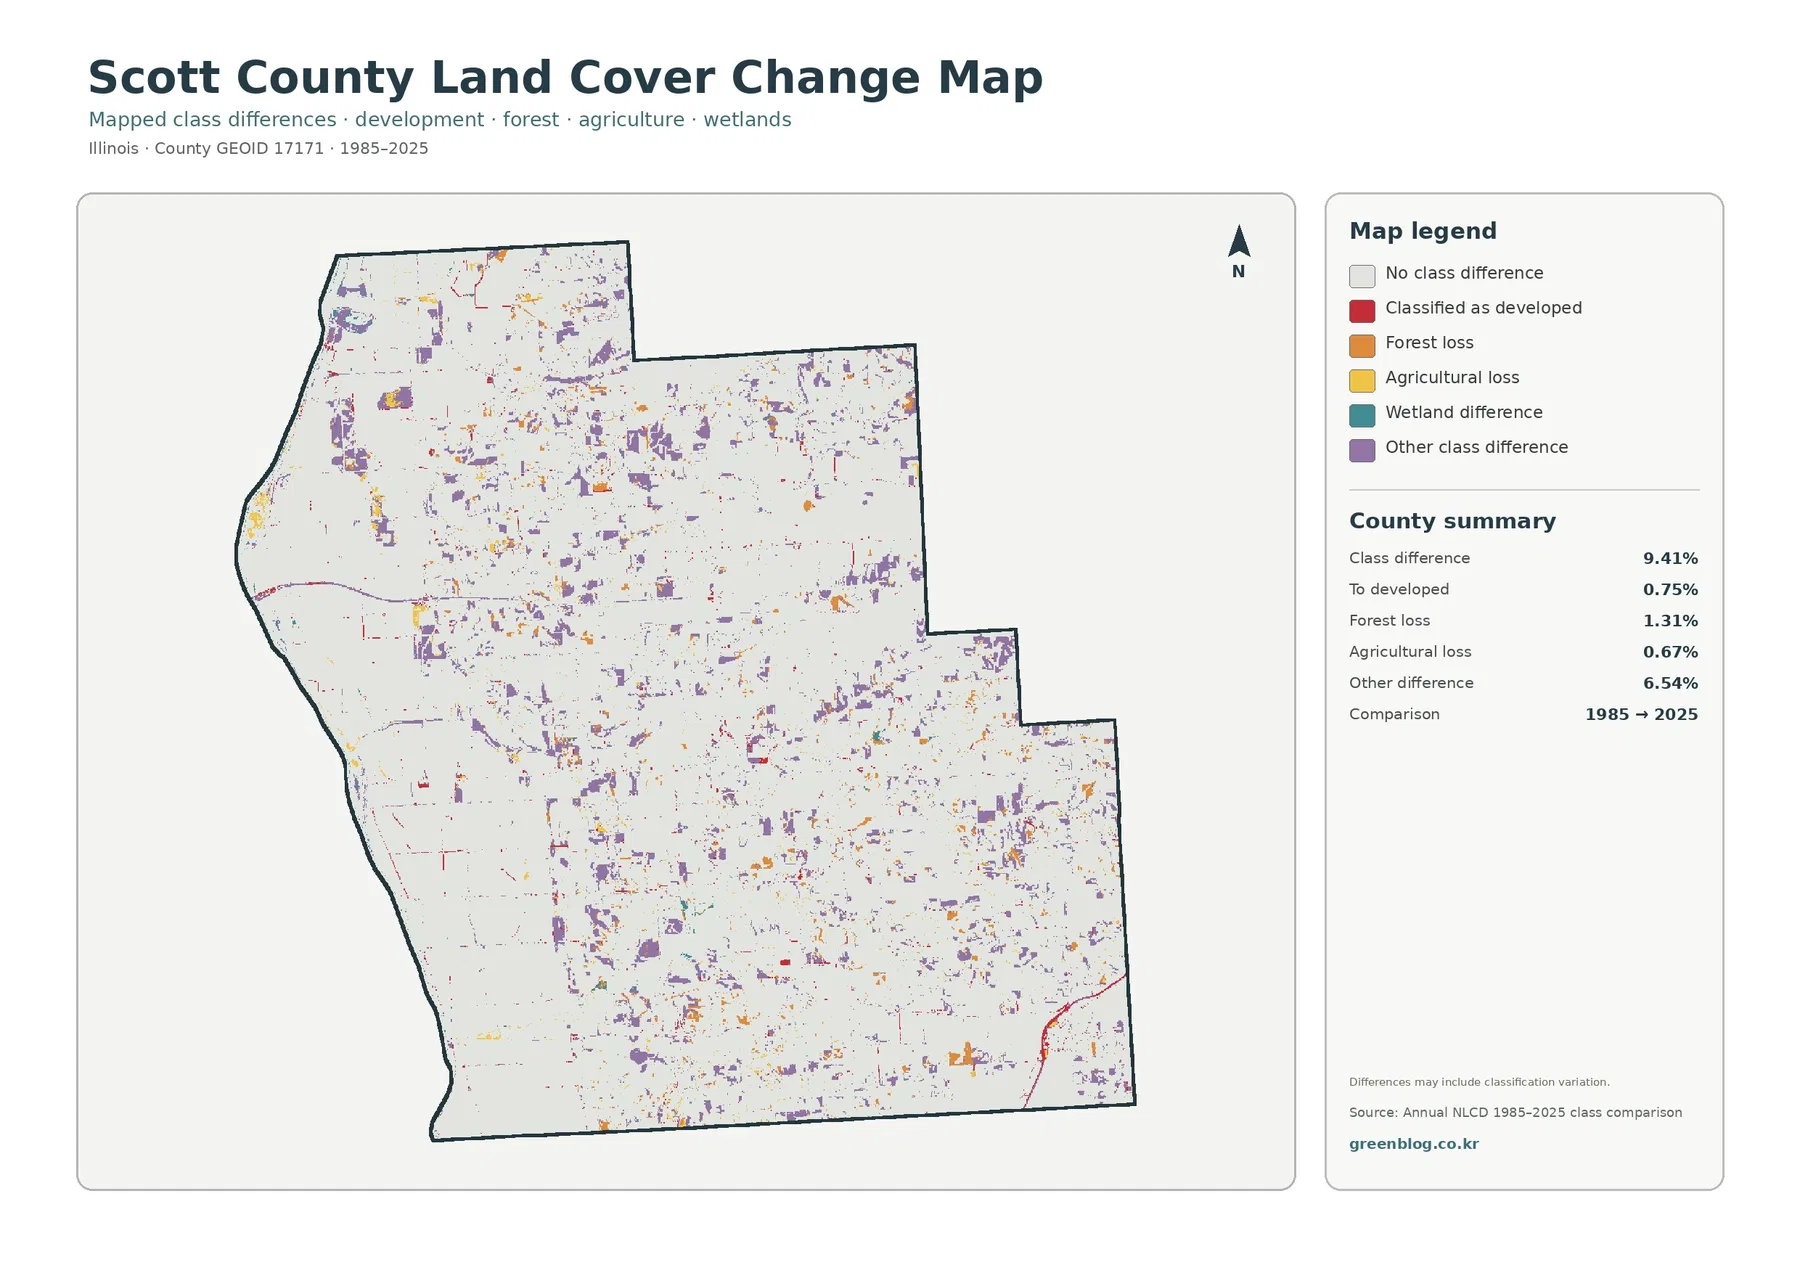
The change map reports a total class difference of 9.41% between 1985 and 2025. Cells classified as developed account for 0.75%, forest loss for 1.31%, agricultural loss for 0.67%, and other class differences for 6.54%. Wetland difference is shown separately in the legend, although the summary panel does not give it an individual percentage. The total 9.41% is therefore not a development-growth rate.
Other class difference is by far the largest named component. That category deserves caution because differences can reflect genuine land-cover transitions, but they can also be influenced by mixed pixels, classification boundaries, and variation between the two mapped years. The map itself notes that differences may include classification variation. Purple cells should be read as places worth checking, not as proof of one specific land-use event.
Red developed-change cells appear near Winchester, several smaller settlements, and parts of the road network. Their 0.75% county share is much smaller than the full class-difference total. Forest-loss and agricultural-loss cells are also scattered, with some larger patches in the north, east, and southeast. A two-date map cannot establish the exact year or cause of those changes.
The western river edge contains another mix of colors. Water levels, vegetation, farming, wetland conditions, and classification boundaries can all make river margins complex. The map cannot tell which factor explains a particular cell. For a research project focused on a specific river-edge location, intermediate Annual NLCD years and water-resource records should be checked before drawing a conclusion.
A 1985–2025 endpoint comparison also misses some intermediate history. A cell could change to another class and later return to its original broad class, leaving no difference in the two endpoints. The map is most useful as a screening tool for long-term class differences, not as a complete forty-year chronology of every field, forest patch, or settlement.
A practical four-map route from Winchester to the Illinois River edge
Begin at Winchester on the general map. Note the size of the red developed area and where agriculture resumes around it. Then switch to the impervious map, where the same town separates into denser hard-surface cells, lower-density edges, and road traces. That comparison demonstrates why a developed land-cover class and an impervious percentage answer related but different questions.
Move next to the large farm areas west of the center. On the general map they look mostly agricultural, while the forest-and-farmland view makes narrow woodland interruptions easier to find. On the impervious map, most of the same area becomes pale except for roads and isolated settlement marks. The change map may add scattered purple, red, orange, or yellow cells, but those should be interpreted only after the present-day pattern is understood.
Finish at the western boundary. The general map shows water, wetlands, forest, and agriculture close together. The forest-and-farmland view simplifies that mix, while the impervious map leaves most of the corridor lightly colored except where roads or settlements are present. The change map is the most complicated view, because river-edge classification differences can reflect both real surface changes and mapping variation.
Choosing a map for reference, teaching, or local comparison
The 2025 general map is the best single image for a county overview because it keeps agriculture, forest, development, wetlands, and water on one page. The forest-and-farmland map is more effective when the main question is how broad farm blocks relate to woodland. Use the impervious map to discuss built surface around Winchester and along roads. Use the change map only when the topic is long-term class difference rather than present-day cover.
For river or watershed context, the western edge is the most useful part of the map set. IDNR material connects Naples in Scott County with the Illinois River, and the present-day maps show water and wetlands along that side. These maps can illustrate surrounding land cover, but they do not show river stage, flood depth, levees, water quality, or wetland jurisdiction.
The county’s official municipality list is also useful when reading development. Winchester, Bluffs, Manchester, Alsey, Exeter, Glasgow, and Naples are identified by the county government. The maps do not draw municipal boundaries, but the list helps a reader understand why several separate built clusters appear in a county with a low mean impervious percentage. Exact town locations and boundaries should be confirmed with an administrative map when needed.
Scale remains an important limitation. The downloadable JPGs are 2480×1754 pixels, but enlarging the image cannot reveal detail that is absent from the underlying 30-meter data. Narrow streams, small ponds, tree lines, individual buildings, and parcel edges may be generalized. The map collection is designed for county-scale interpretation rather than property-level measurement.
The 2025 map also represents a specific observation period. Construction, vegetation change, or land management after that period will not appear. The 1985–2025 map compresses four decades into an endpoint comparison. Current zoning, permits, ownership, drainage design, and site conditions should always be checked from the appropriate local source.
Which original JPG should you download first?
Choose the general land-cover map for a county introduction. Pick the forest-and-farmland view if the 75.42% agricultural share and the woodland pattern are your main topic. Use the impervious map for Winchester, smaller settlement clusters, and road-related hard surfaces. Select the 1985–2025 map to identify broad class differences that deserve further investigation. The ZIP contains one 2480×1754 JPG for each of the four views.
Frequently Asked Questions
Is Scott County almost entirely farmland?
Agriculture is the dominant 2025 class at 75.42%, but forest still covers 15.60%. Developed land is 6.00%, wetlands 1.86%, and water 0.84%. The forest concentration in the east and south and the Illinois River-side water and wetlands make the county more varied than the agriculture percentage alone suggests.
What stands out on the Scott County impervious map?
Winchester is the strongest compact cluster, while roads and smaller settlements form thinner or more scattered marks elsewhere. Mean impervious cover is 1.55%, and cells with at least 50% impervious surface account for 0.58%. The low county-wide values fit a landscape where most land is agricultural or forested rather than densely built.
Does the 9.41% 1985–2025 class difference mean 9.41% was developed?
No. Cells classified as developed account for 0.75%, forest loss for 1.31%, agricultural loss for 0.67%, and other class differences for 6.54%. Other difference is the largest component, and the map warns that classification variation may contribute. The 9.41% total is a two-date class-difference measure, not a development-growth rate.
Map File Information
Download four original JPG maps for Scott County, Illinois: 2025 land cover, forest and farmland, impervious surface and developed land, and 1985–2025 land-cover class differences.
- Included Files: Map files described in this article
- File Type: JPG maps packaged in a ZIP archive
- Intended Use: Printing, education, presentations, and map-based projects
Related Maps
- Adams County Illinois Land Cover Map
- Alexander County Illinois Land Cover Map
- Bond County Illinois Land Cover Map
Sources and References
- MRLC Annual NLCD Data — annual land-cover and related products
- USGS Annual NLCD Land Cover Classification — land-cover class definitions and methodology
- USGS Annual NLCD Spatial Resolution — 30-meter raster resolution
- U.S. Census Bureau TIGER/Line Shapefiles — county boundary data
- Scott County, Illinois official website — Winchester county-seat and county information
- Scott County Villages & Townships — official municipality list including Winchester, Bluffs, Manchester, and Naples
- Illinois DNR Fishing Prospects — Scott County and Illinois River context at Naples
Green Map creates custom-edited map images using open geographic data sources such as geoBoundaries, Natural Earth, OpenStreetMap, and government open data. These maps are edited visual materials, not raw data files, and are provided for education, documents, presentations, and graphic reference.