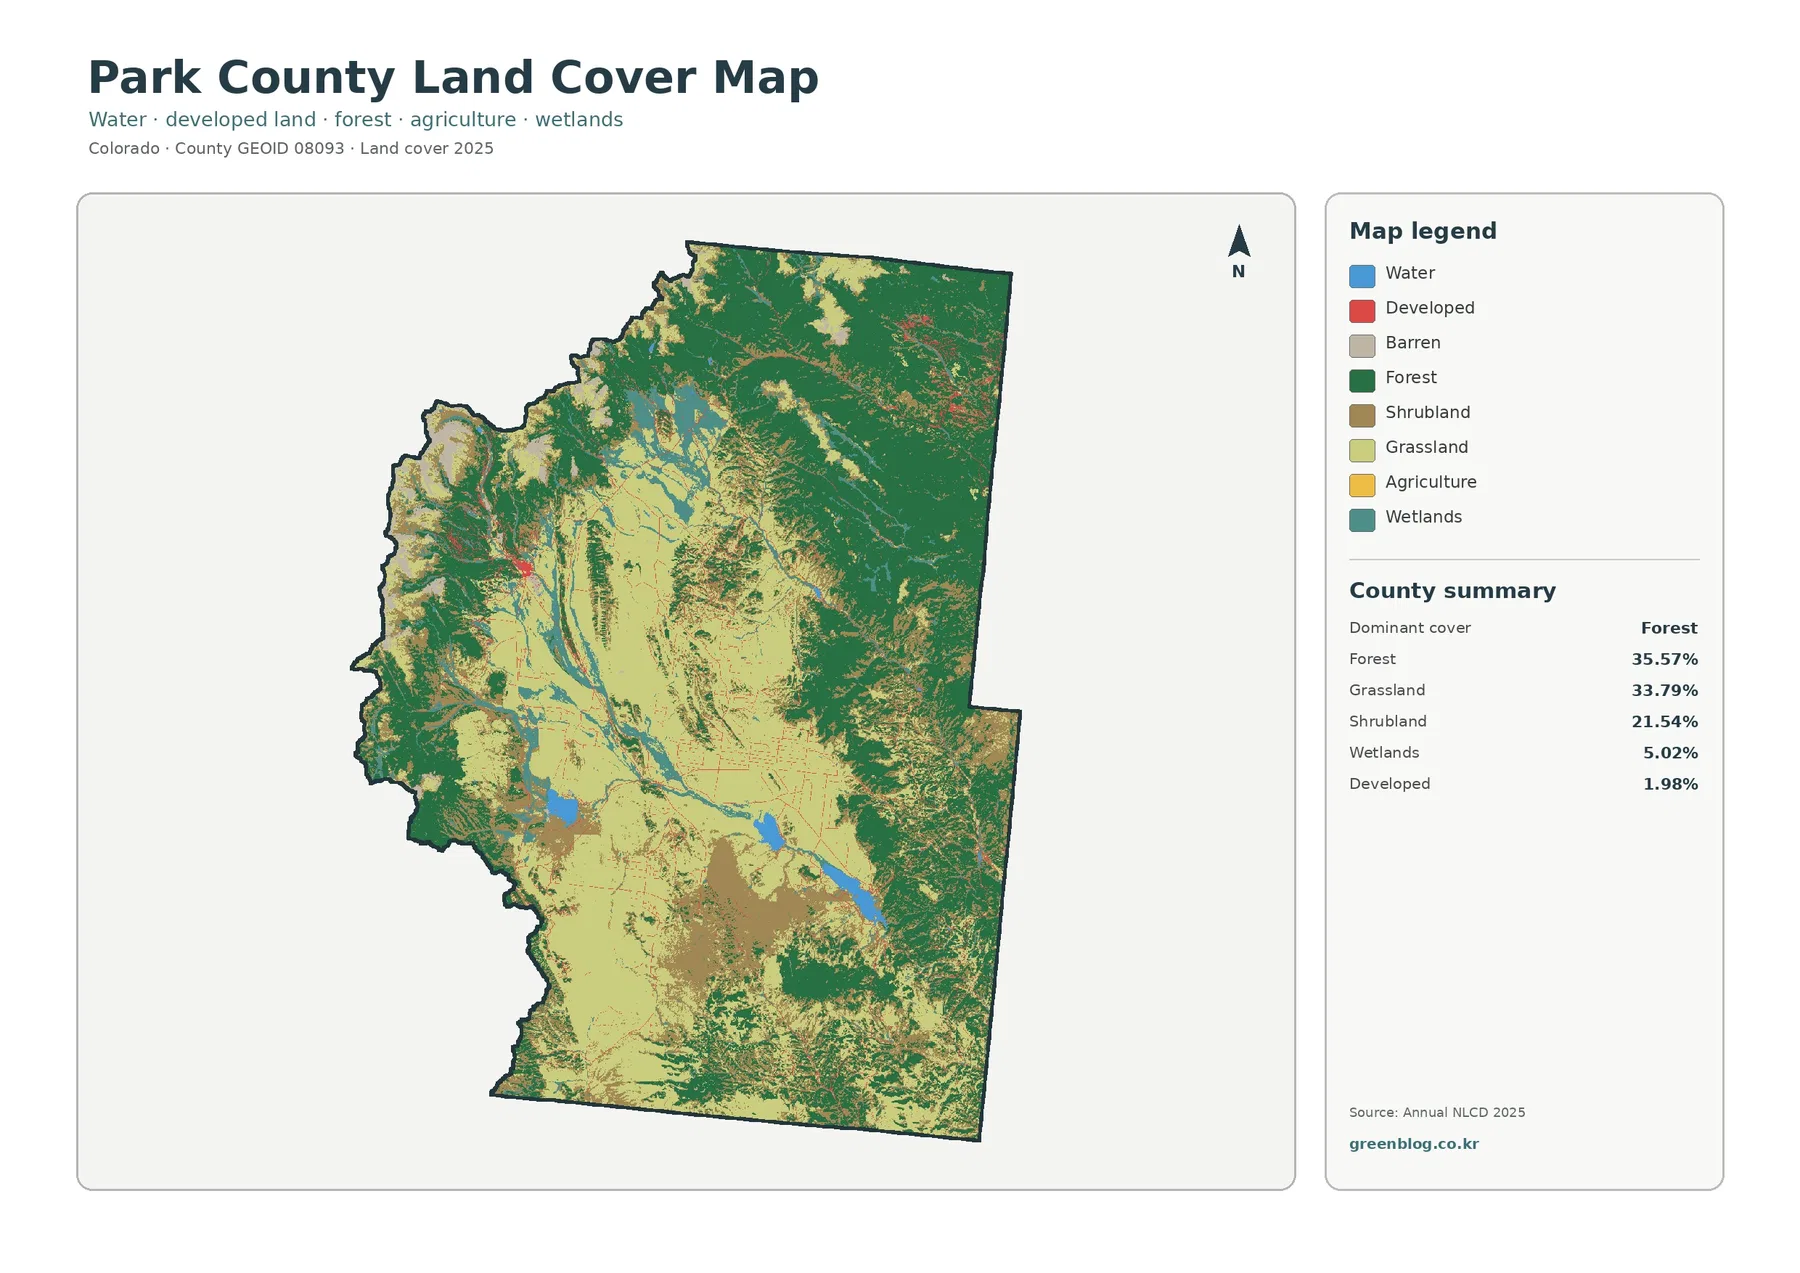
Park County sits in central Colorado where the broad high-elevation floor of South Park meets forested mountain ranges on several sides. The 2025 summary in the supplied map package shows forest as the largest class at 35.57%, followed closely by grassland at 33.79%. Shrubland adds another 21.54%, while wetlands account for 5.02% and developed land for 1.98%. Those percentages are useful, but the map becomes much more informative when the locations of those classes are compared.
This page brings together four views of the same county: current land cover, forest and farmland, impervious surface and developed land, and mapped class differences from 1985 to 2025. The WebP images are intended for quick viewing on the page, while the download section provides the four original JPG maps in one ZIP archive. Reading the maps in sequence makes it easier to separate the open South Park basin from the mountain forests, identify wetland and water patterns, locate the county’s limited hard surfaces, and interpret long-term class differences without treating them as direct measurements of damage.
Table of Contents
A high basin of grassland surrounded by forest
The general 2025 land-cover map shows a strong contrast between the open interior of South Park and the darker mountain margins. Grassland covers 33.79% of the county and forms large connected areas across the central and southern basin. Forest covers 35.57%, only slightly more by area, but it is concentrated around mountain slopes and higher terrain along the county’s outer portions. Because the two classes occupy different parts of the landscape, their visual contrast is stronger than the small difference in percentages might suggest.
The National Park Service describes South Park as a broad high-altitude basin with a floor near 8,500 feet and surrounding peaks rising above 14,000 feet. That regional setting helps explain why a single county can contain both extensive open grassland and large forested mountain areas. The land-cover map itself is not an elevation map, however, so elevation should be used as geographic context rather than as a one-step explanation for every mapped boundary.
Shrubland is the third-largest class at 21.54%. It fills broad areas between forest and grassland and appears in a patchwork along basin edges and mountain slopes. This is an important part of the county’s mapped surface rather than a small transitional category. Shrubland on a land-cover map should not be interpreted as vacant land, public land, grazing allotment, or land available for development; it simply identifies the surface cover assigned to those raster cells.
Wetlands make up 5.02% of the 2025 summary, a substantial share compared with many drier counties in the region. Teal patches and corridors are especially noticeable within the broad basin and near mapped water features. Water is listed at 0.58% in the forest-and-farmland summary. Together, the blue and teal areas show that the open interior of South Park is not a single dry grassland surface but contains a network of wetter ground and water bodies.
Why the farmland class is almost absent
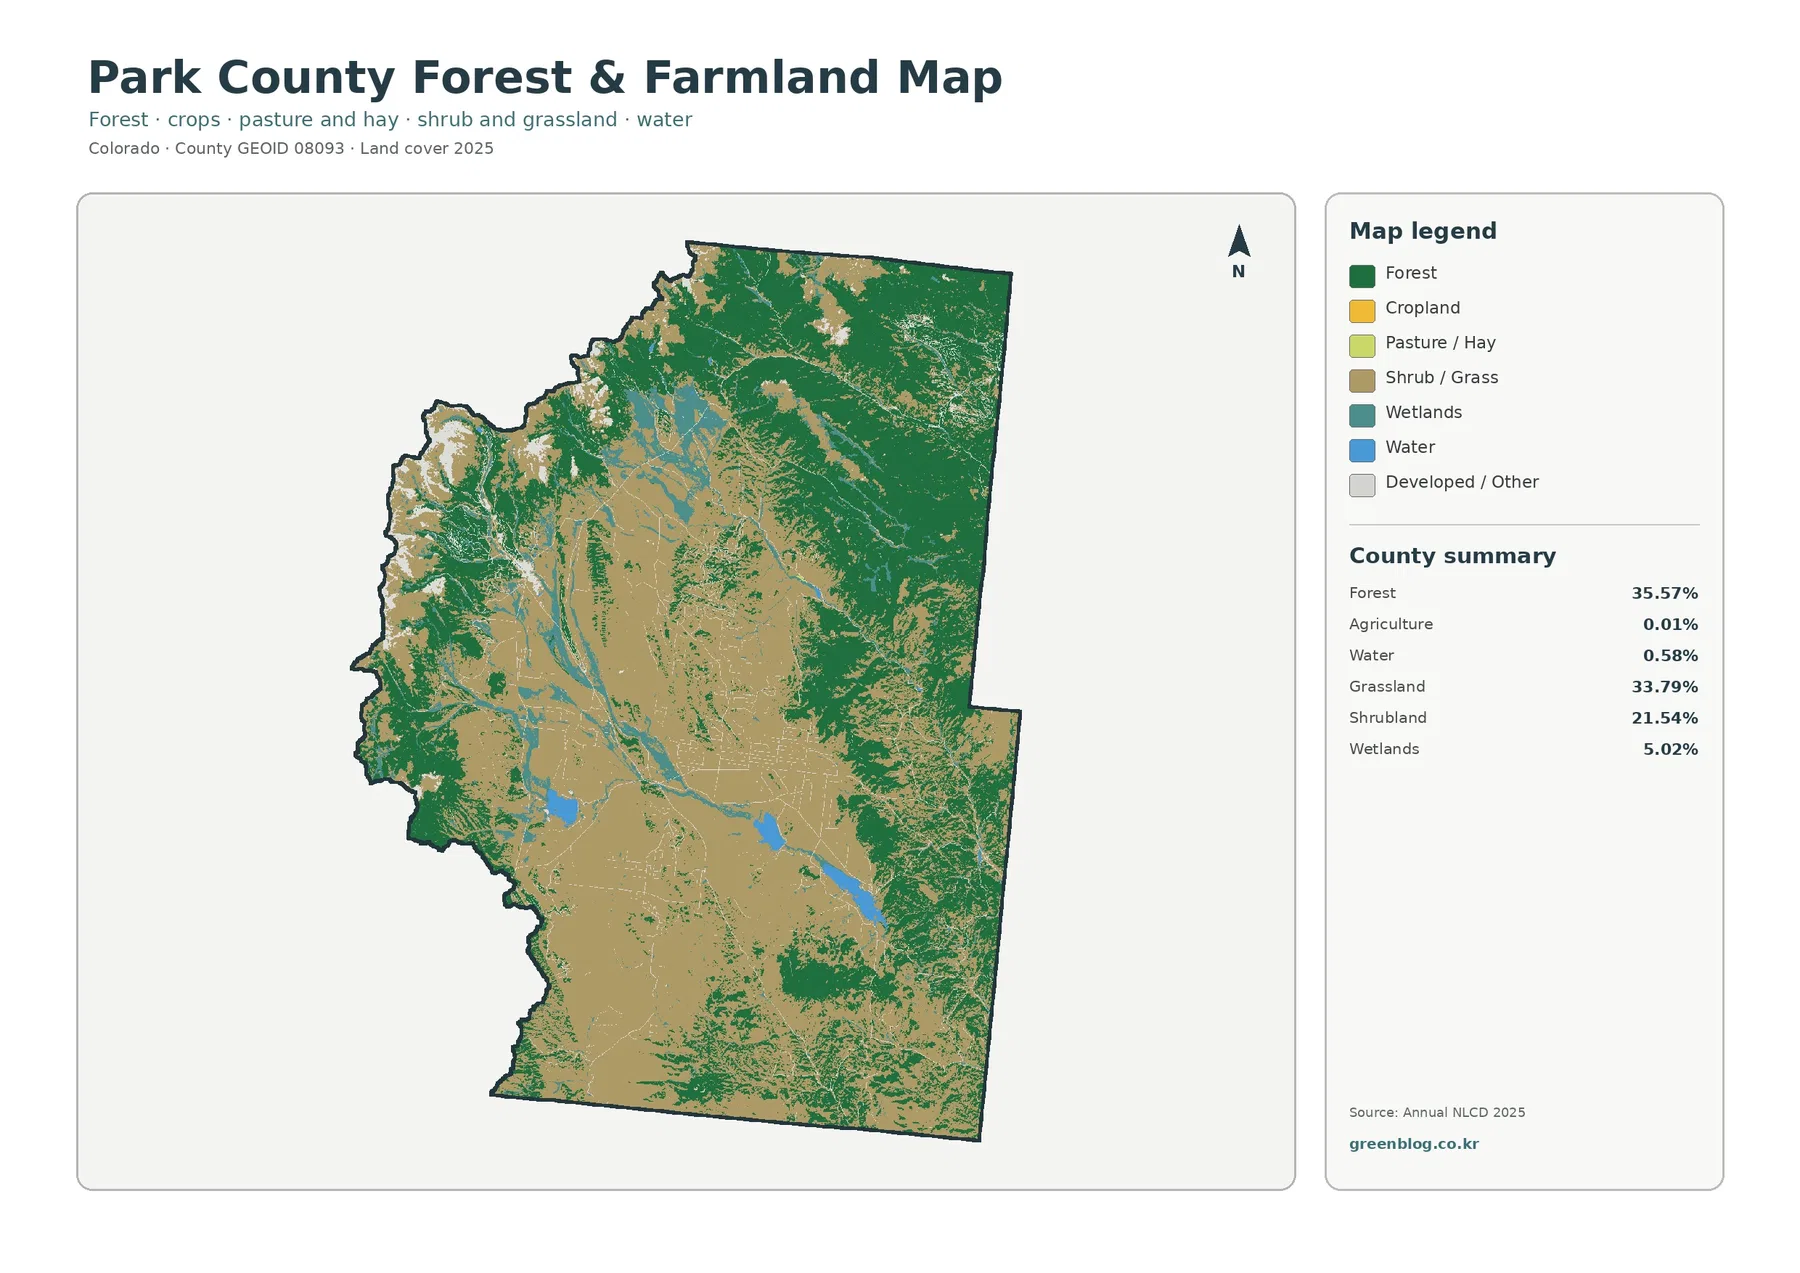
The forest-and-farmland map makes one of Park County’s most unusual statistics very clear: agriculture is only 0.01% in the supplied 2025 summary. Instead of large crop blocks, the map is dominated by forest, grassland, shrubland, wetlands, and water. This is very different from eastern Colorado counties where cropland may form broad rectangular patterns across much of the map.
The 0.01% figure does not mean that ranching or other agricultural activity is absent from Park County. It means that only a very small share of the raster cells in this particular land-cover classification is assigned to the agriculture category. Pasture, hay, natural grassland, and ranching landscapes can be represented differently depending on the classification system. Land cover therefore should not be substituted for agricultural economics, parcel ownership, grazing use, or legal land-use records.
This map is useful because it simplifies the contrast among forest, open vegetation, wetlands, and water. Forest remains 35.57%, grassland 33.79%, shrubland 21.54%, wetlands 5.02%, and water 0.58%. Across the basin, grass and shrub colors dominate the open ground while forest wraps around much of the higher terrain. Wetlands and water interrupt those broad classes in narrow corridors and irregular patches, making the wetter parts of South Park easier to spot.
The map should still be treated as a county-scale raster product. It does not show individual ranch boundaries, legal wetland limits, field ownership, or current management status. A small field or narrow wetland may be mixed with neighboring cover in a single cell. Parcel-level decisions require more detailed county GIS data, surveys, and topic-specific environmental information.
Very little impervious surface across the county
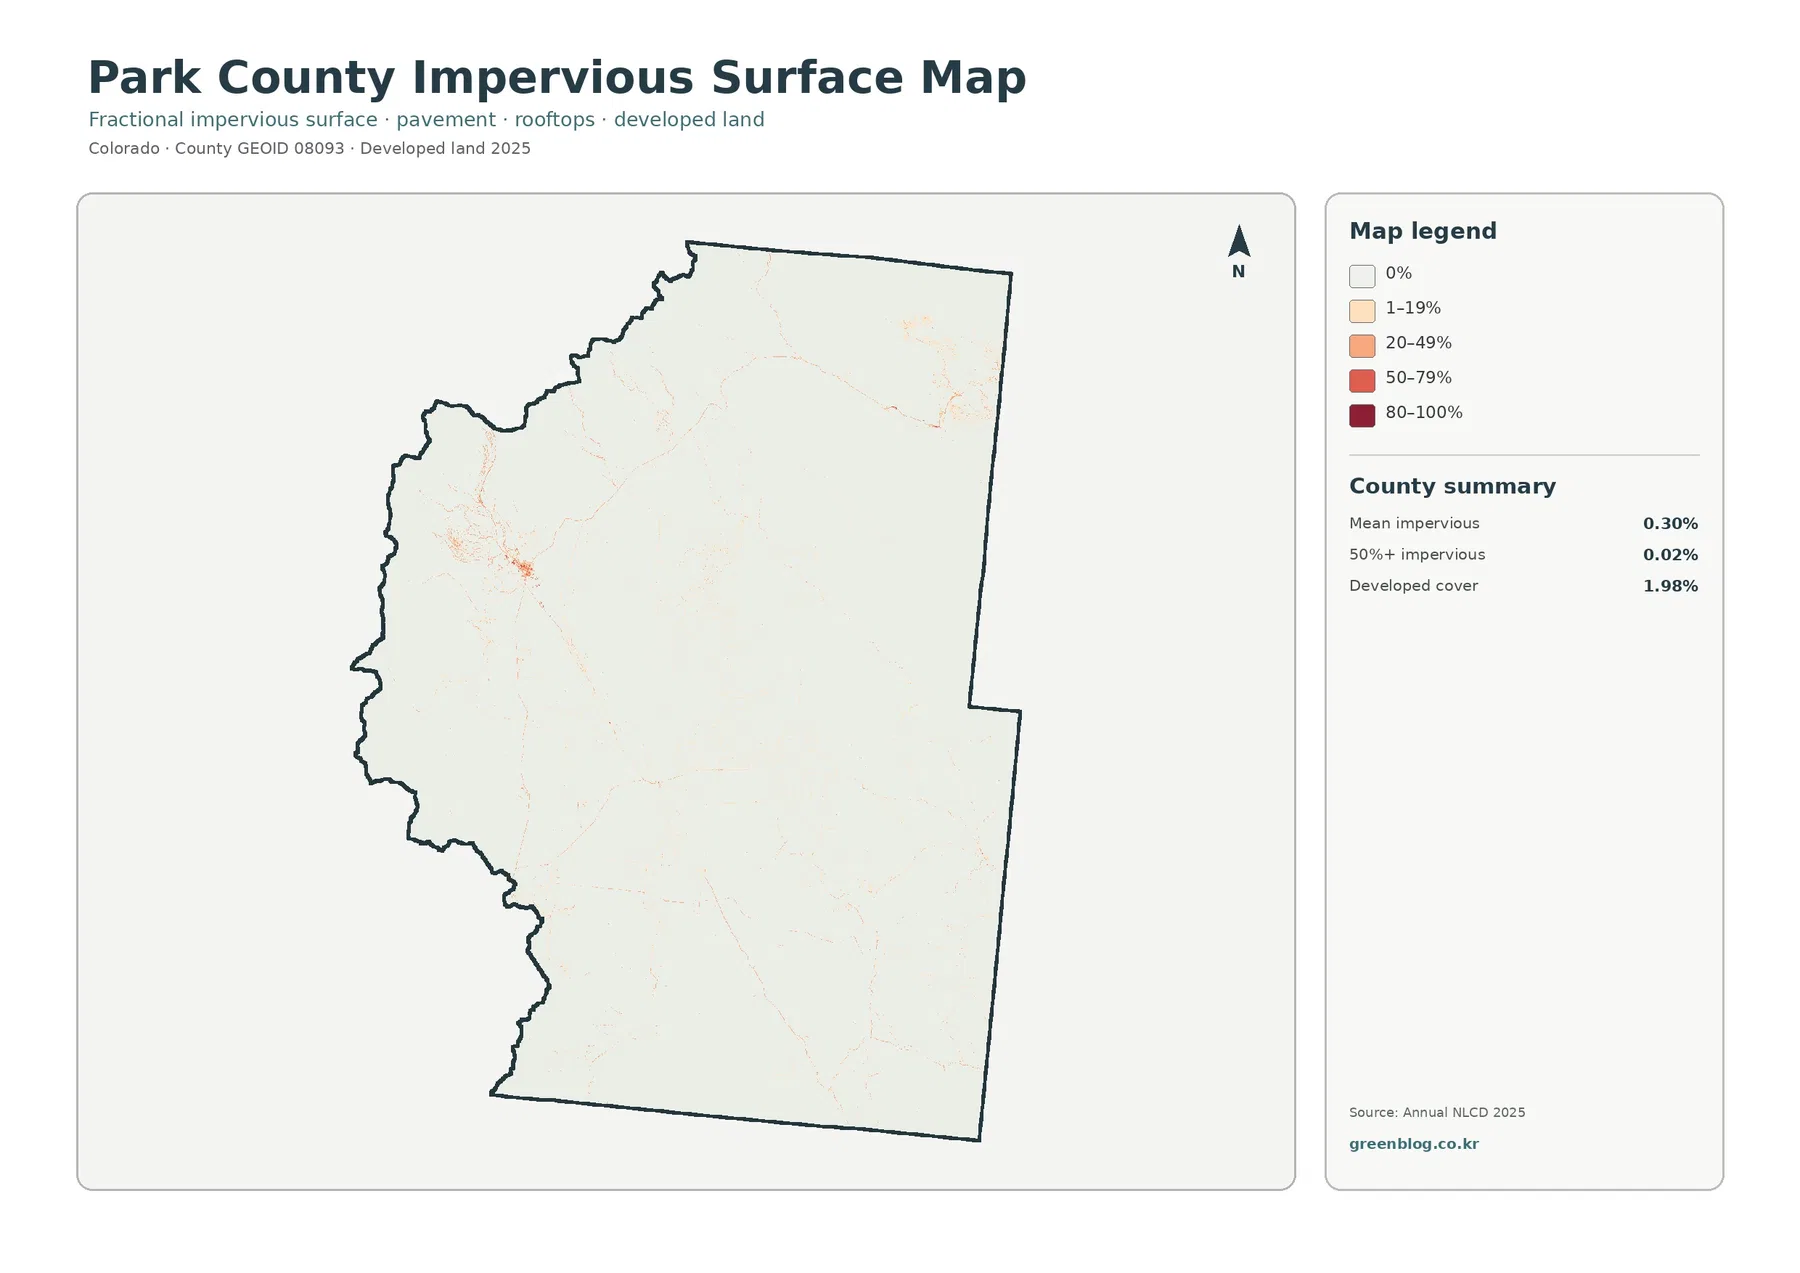
The impervious-surface map shows pavement, rooftops, parking areas, and other hard surfaces that do not readily absorb water. Park County has a mean impervious value of just 0.30%, and only 0.02% of the county is mapped at 50% impervious or higher. Developed land covers 1.98% in the general land-cover summary. As a result, most of the impervious map is nearly white, with stronger values limited to a few compact clusters and thin linear features.
A countywide mean of 0.30% does not imply that every location has the same amount of hard surface. The map shows a highly uneven pattern: developed locations and road corridors have noticeably higher values, while large forest, grassland, and shrubland areas remain near zero. For Park County, the map is more useful for finding concentrations of built surface than for describing the county with a single average.
Thin lines on the map may correspond with developed transportation surfaces, but the product is not a road map. It does not provide road names, classifications, traffic volumes, building functions, municipal limits, or parcel boundaries. Those details require separate transportation and administrative datasets. The impervious layer only answers a narrower question: where does the surface appear more or less covered by hard, water-resistant materials?
Comparing this layer with the general land-cover map adds useful context. A small developed cluster can be seen against surrounding forest, grassland, or shrubland, while the general map shows the broader cover category around it. The two layers together show how limited the developed footprint is within a county dominated by natural and semi-natural surfaces.
Reading the 6.76% mapped class difference from 1985 to 2025
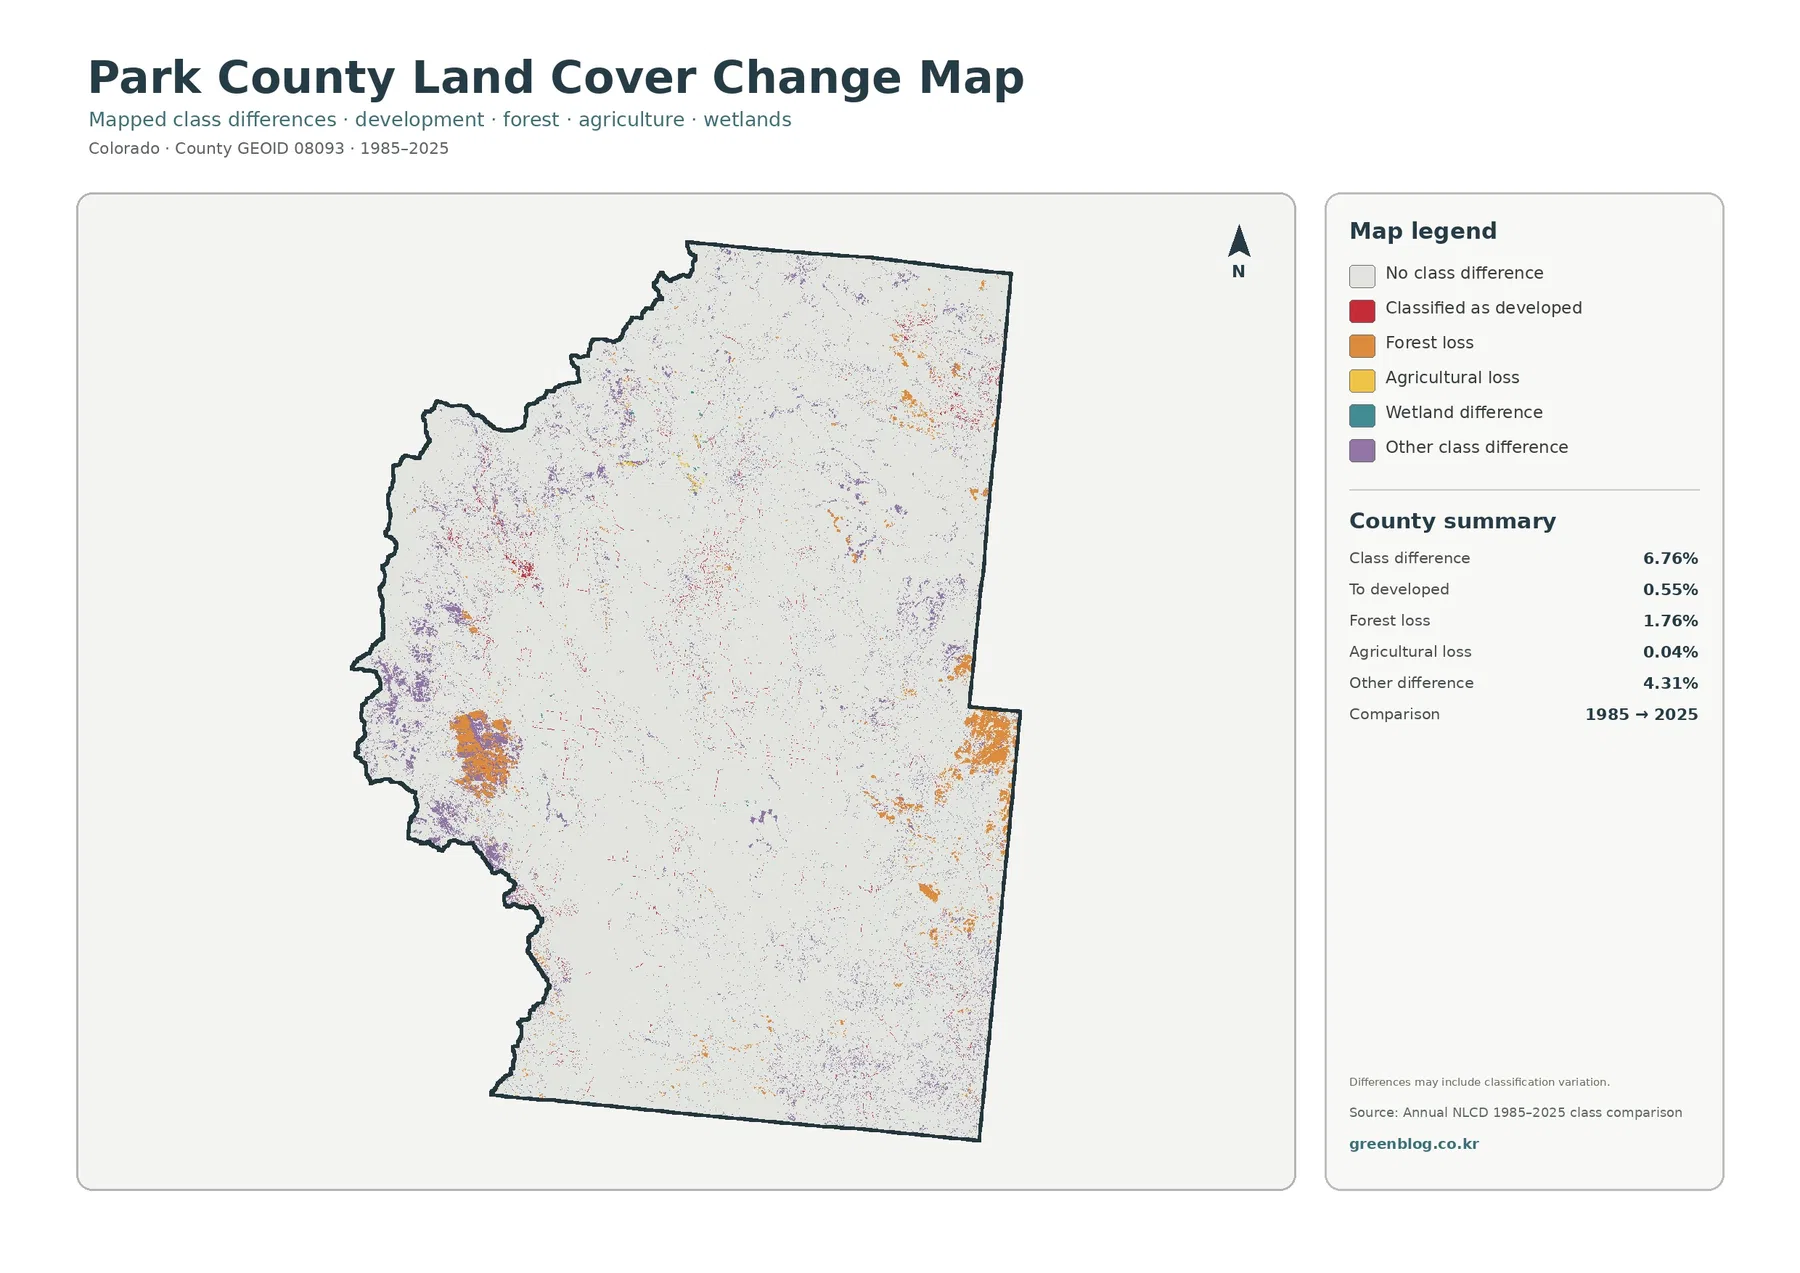
The change map reports a 6.76% class difference between 1985 and 2025. Within that total, 0.55% is categorized as a change to developed, 1.76% as forest loss, 0.04% as agricultural loss, and 4.31% as other class difference. Colored pixels are scattered across the county, with a few larger patches on mountain slopes and around parts of the basin edge.
The 6.76% value should not be labeled a damage rate, habitat-loss rate, or direct measure of land degradation. The map compares the class assigned to each raster cell at two dates. Real changes can contribute to the result, but differences in imagery date, snow or moisture conditions, seasonal vegetation, mixed pixels, sensor characteristics, and classification methods can also produce different labels.
The 1.76% forest-loss class deserves the same caution. Orange areas indicate cells that were mapped as forest at the earlier date and as another class at the later date, but that does not identify the cause. Fire, vegetation change, management, classification uncertainty, or other processes could be involved. Intermediate Annual NLCD years, aerial imagery, fire history, and forest records would be needed before assigning an explanation to a specific patch.
The 0.55% mapped change to developed can be checked against the current impervious-surface layer. If a red change patch also appears as a higher impervious area in the 2025 map, the two products provide mutually useful context. If the current impervious value remains low, the user should consider other class transitions or classification effects rather than assuming a new built area.
Wetlands and water within the open South Park landscape
One of the most useful features of the Park County maps is the visibility of wetlands within the open basin. Wetlands account for 5.02%, while water is 0.58% in the supplied summary. Teal and blue areas form corridors and patches inside grassland and shrubland, creating a pattern that is easy to miss when South Park is described only as a broad high-elevation grassland.
National Park Service materials for the South Park National Heritage Area emphasize the diversity of the basin and surrounding mountain landscape. The land-cover maps add a simple visual layer to that description by showing where wet surfaces occur relative to forest and open vegetation. However, an NLCD wetland class is not the same as a legally delineated wetland, and a mapped water class does not provide water depth, seasonal flow, ownership, or regulatory status.
The impervious map can also be compared with the water and wetland pattern, but proximity should be interpreted carefully. A hard-surface cluster near a wet area does not by itself establish flood risk, runoff impact, or water-quality effects. Those questions require watershed boundaries, slope, soils, drainage infrastructure, precipitation, and hydrologic data. The maps here are best used to locate patterns and decide where more detailed analysis may be useful.
A practical order for comparing all four maps
Because Park County has no single land-cover class that overwhelms the entire map, the four layers work best as a sequence. Start with the general 2025 map to establish the countywide balance among forest, grassland, shrubland, wetlands, and developed land. Then use the forest-and-farmland layer to see how small the agriculture class is and how open vegetation differs from mountain forest. The impervious layer isolates the built footprint, and the change layer should come last so that historical differences are not confused with current conditions.
- Use the 2025 land-cover map for the overall mix of forest 35.57%, grassland 33.79%, shrubland 21.54%, wetlands 5.02%, and developed land 1.98%.
- Use the forest-and-farmland map to compare the nearly absent agriculture class at 0.01% with forest, open vegetation, wetlands, and water.
- Use the impervious-surface map to locate the county’s limited hard surfaces, with a mean impervious value of 0.30%.
- Use the 1985–2025 change map to investigate where the mapped class differs across 6.76% of the county.
For classroom, planning, or presentation use, keeping the same county outline and orientation across all four maps makes comparison straightforward. Each product is still a generalized raster view at county scale. Narrow roads, small wetlands, small parcels, and boundary features may be mixed with neighboring cover classes. The maps are not surveys and should not be used to establish property lines, zoning, ownership, construction suitability, or regulatory boundaries.
South Park’s broad basin and surrounding mountains also mean that the same cover class can appear in different settings. Grassland may form a large continuous basin surface in one place and a small opening among forest in another. Reading the legend together with the shape, size, and neighboring colors of each patch gives a more accurate picture than treating every pixel of a class as identical.
Download the four Park County land-cover JPG maps
The ZIP below contains the four original JPG maps described on this page: 2025 land cover, forest and farmland, impervious surface and developed land, and the 1985–2025 class-difference map. Each image is 2480×1754 pixels. The supplied asset manifest does not mark these files as meeting the A3 high-resolution reference, so they are suitable for web pages, documents, lessons, and ordinary presentations, while very large printing or detailed GIS analysis should use the original MRLC data or another appropriate high-resolution source.
Frequently Asked Questions
What is the largest land-cover class in Park County?
Forest is the largest 2025 class at 35.57%, followed closely by grassland at 33.79%. Shrubland accounts for 21.54%, wetlands 5.02%, and developed land 1.98%.
Does agriculture at 0.01% mean there is almost no agricultural activity?
No. The 0.01% figure is the share of raster cells assigned to the agriculture land-cover class in the supplied 2025 map. Ranching, pasture, hay, and natural grassland can be represented differently, so the number is not a measure of the county’s agricultural economy.
Is the 6.76% 1985–2025 class difference a damage rate?
No. It is the share of cells assigned to different land-cover classes at the two comparison dates. Real change may be included, but imagery timing, seasonal conditions, mixed pixels, and classification methods can also affect the result.
Sources and reference material
Percentages and change values on this page come from the supplied Park County map assets based on the 2025 Annual NLCD summary and the 1985–2025 comparison. The geographic discussion of South Park is supported by National Park Service and U.S. Geological Survey material. The links below provide the underlying land-cover resources, boundary data, and additional information about the South Park region.
- MRLC Annual NLCD Data
- USGS Annual NLCD Land Cover Classification
- U.S. Census Bureau TIGER/Line Shapefiles
- National Park Service – South Park National Heritage Area
- U.S. Geological Survey – Hartsel Quadrangle, Park County
Map File Information
Download four JPG maps for Park County: 2025 land cover, forest and farmland, impervious surface and developed land, and the 1985–2025 class-difference map.
- Included Files: Use only the versions confirmed in the article and supplied images
- File Type: Use the confirmed download contents
- Intended Use: Printing, education, presentations, and map-based projects
Related Maps
- Adams County Colorado Land Cover Map
- Alamosa County Colorado Land Cover Map
- Arapahoe County Colorado Land Cover Map
Green Map creates custom-edited map images using open geographic data sources such as geoBoundaries, Natural Earth, OpenStreetMap, and government open data.
These maps are edited visual materials, not raw data files, and are provided for education, documents, presentations, and graphic reference.