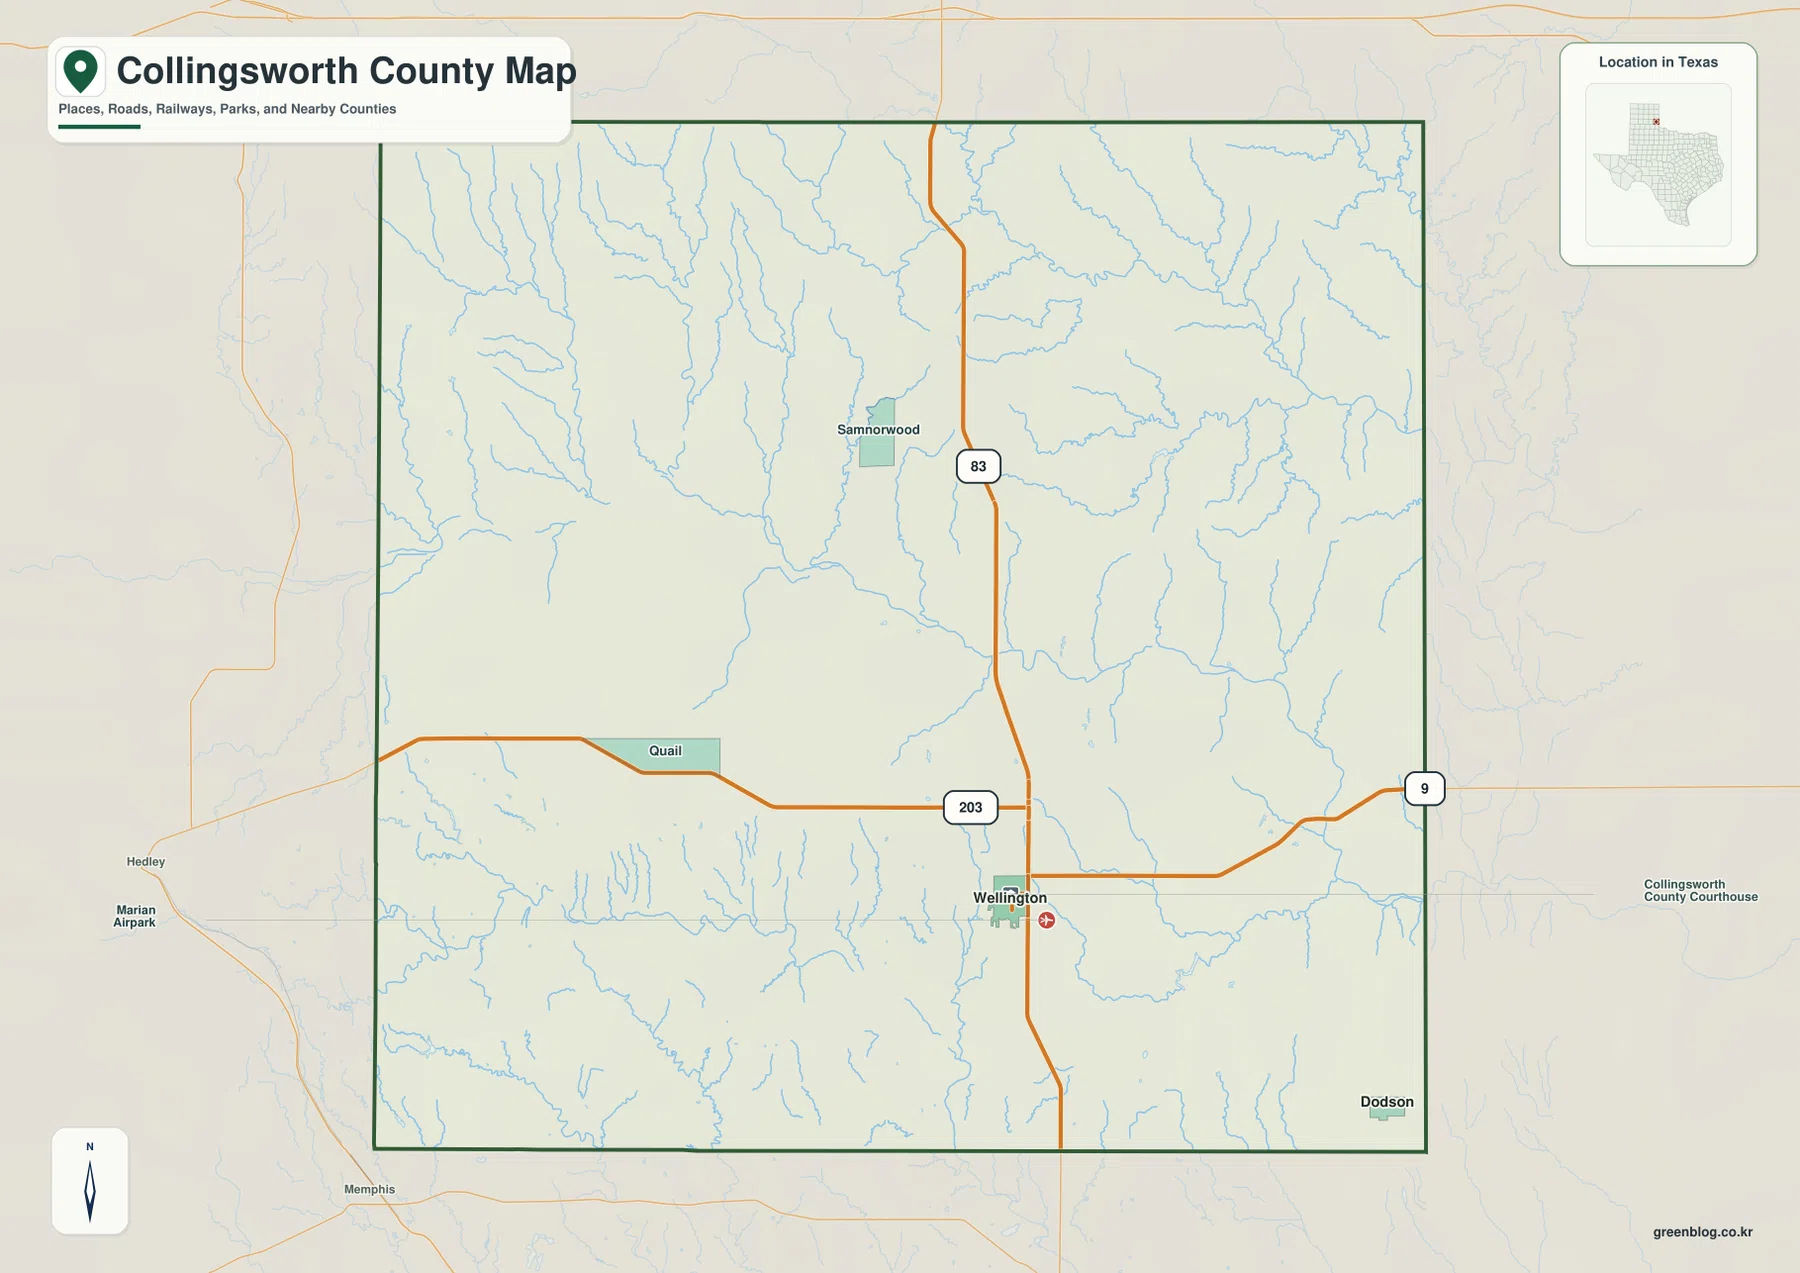
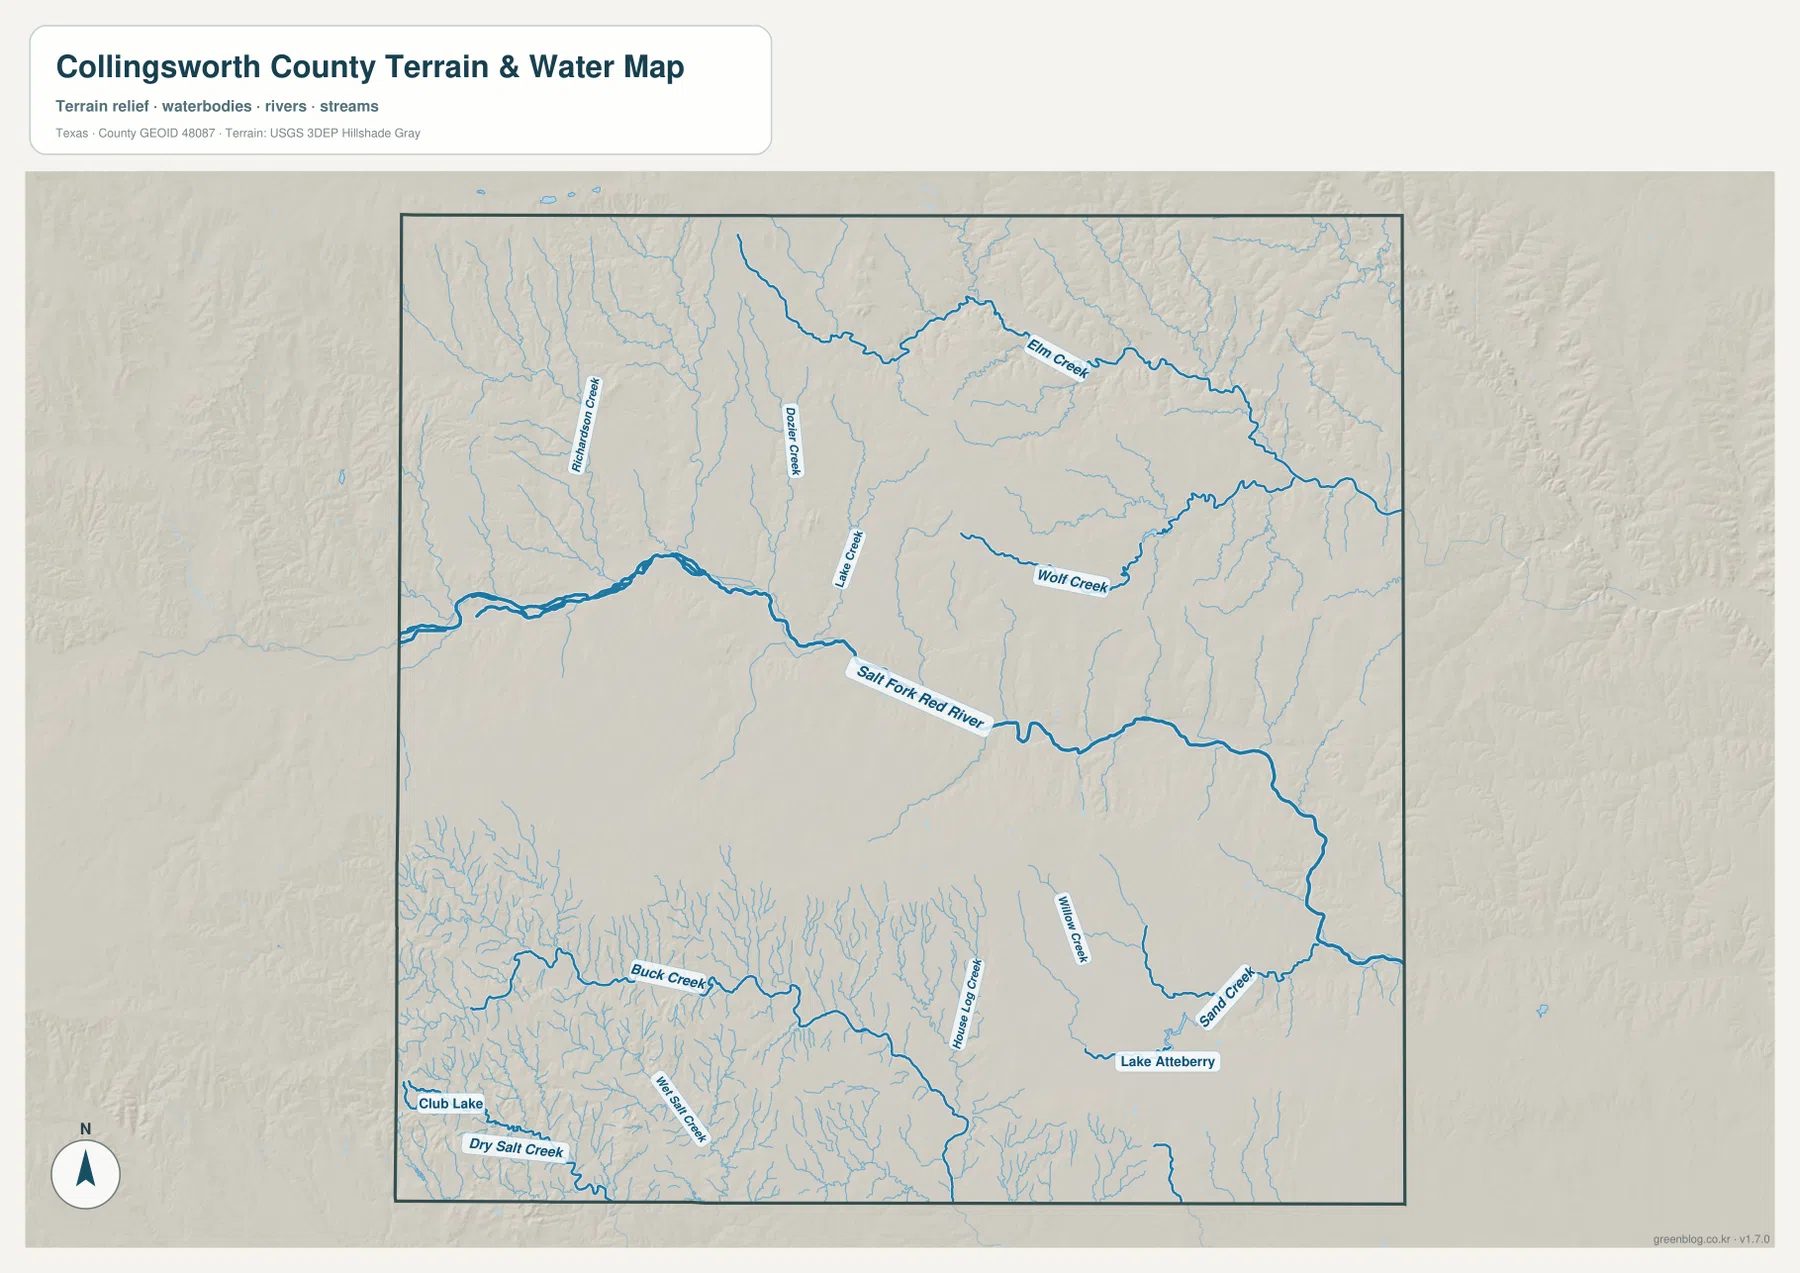
Collingsworth County occupies the eastern side of the Texas Panhandle, where Wellington provides the clearest road and settlement reference while the Salt Fork Red River cuts a broad valley across the middle of the county. US 83 runs north and south through Wellington, State Highway 203 extends west toward Quail, and Samnorwood and Dodson help locate the more distant northern and southeastern parts of the county. The terrain-and-water map adds Elm Creek, Wolf Creek, Buck Creek, Sand Creek, Club Lake, and Lake Atteberry. Elevation ranges from about 533 to 867 meters with a mean near 649 meters, creating a strong contrast between high western uplands and the lower central and eastern drainage country. The county, city, water, and elevation maps shown here are also available together as four high-resolution A3 JPG files in a ZIP download.
Wellington is the easiest place to use as an anchor. US 83 passes directly through the town, Samnorwood lies farther north along the same general corridor, and Quail sits to the west on the State Highway 203 side. Dodson is close to the southeastern edge and is much more isolated from the main built-up area. Once these locations are familiar, the broad Salt Fork valley explains much of the physical geography that the road map hides: a large low corridor crosses the county while tributary valleys cut down from the higher western and northern terrain.
Table of Contents
Wellington Sits Where US 83 Meets the State Highway 203 Corridor
Wellington has the strongest road concentration on the general county map. US 83 approaches from the north, passes through the built-up area, and continues toward the southern county line. State Highway 203 reaches Wellington from the Quail side and continues eastward. The Collingsworth County Courthouse is labeled east of the central town area, reinforcing Wellington’s role as the administrative and transportation reference point.
Following US 83 north leads toward Samnorwood. The farther the map moves away from Wellington, the more the surrounding landscape is dominated by small blue tributaries rather than streets. Samnorwood therefore provides a useful marker for the northern half, especially when the road map is compared with the elevation surface and the heavily dissected uplands north of the Salt Fork valley.
Quail sits west of Wellington along the Highway 203 direction. There is no continuous developed corridor between the two places; rural roads, creeks, and open uplands fill most of the gap. Hedley and Memphis appear outside the county to the west and southwest, giving the Quail side a useful regional context. The elevation map also shows that this western half is generally higher than the eastern side.
Dodson is near the southeastern edge, well away from Wellington’s main road cluster. The general map contains fewer settlement labels in this part of the county, but the terrain maps show that the area is not featureless. Sand Creek, Lake Atteberry, and a network of tributaries occupy the southeastern lowlands. This makes Dodson a useful place reference for the lower eastern side of Collingsworth County.
The Ranked City Map Shows Wellington 1,883 and Dodson 20
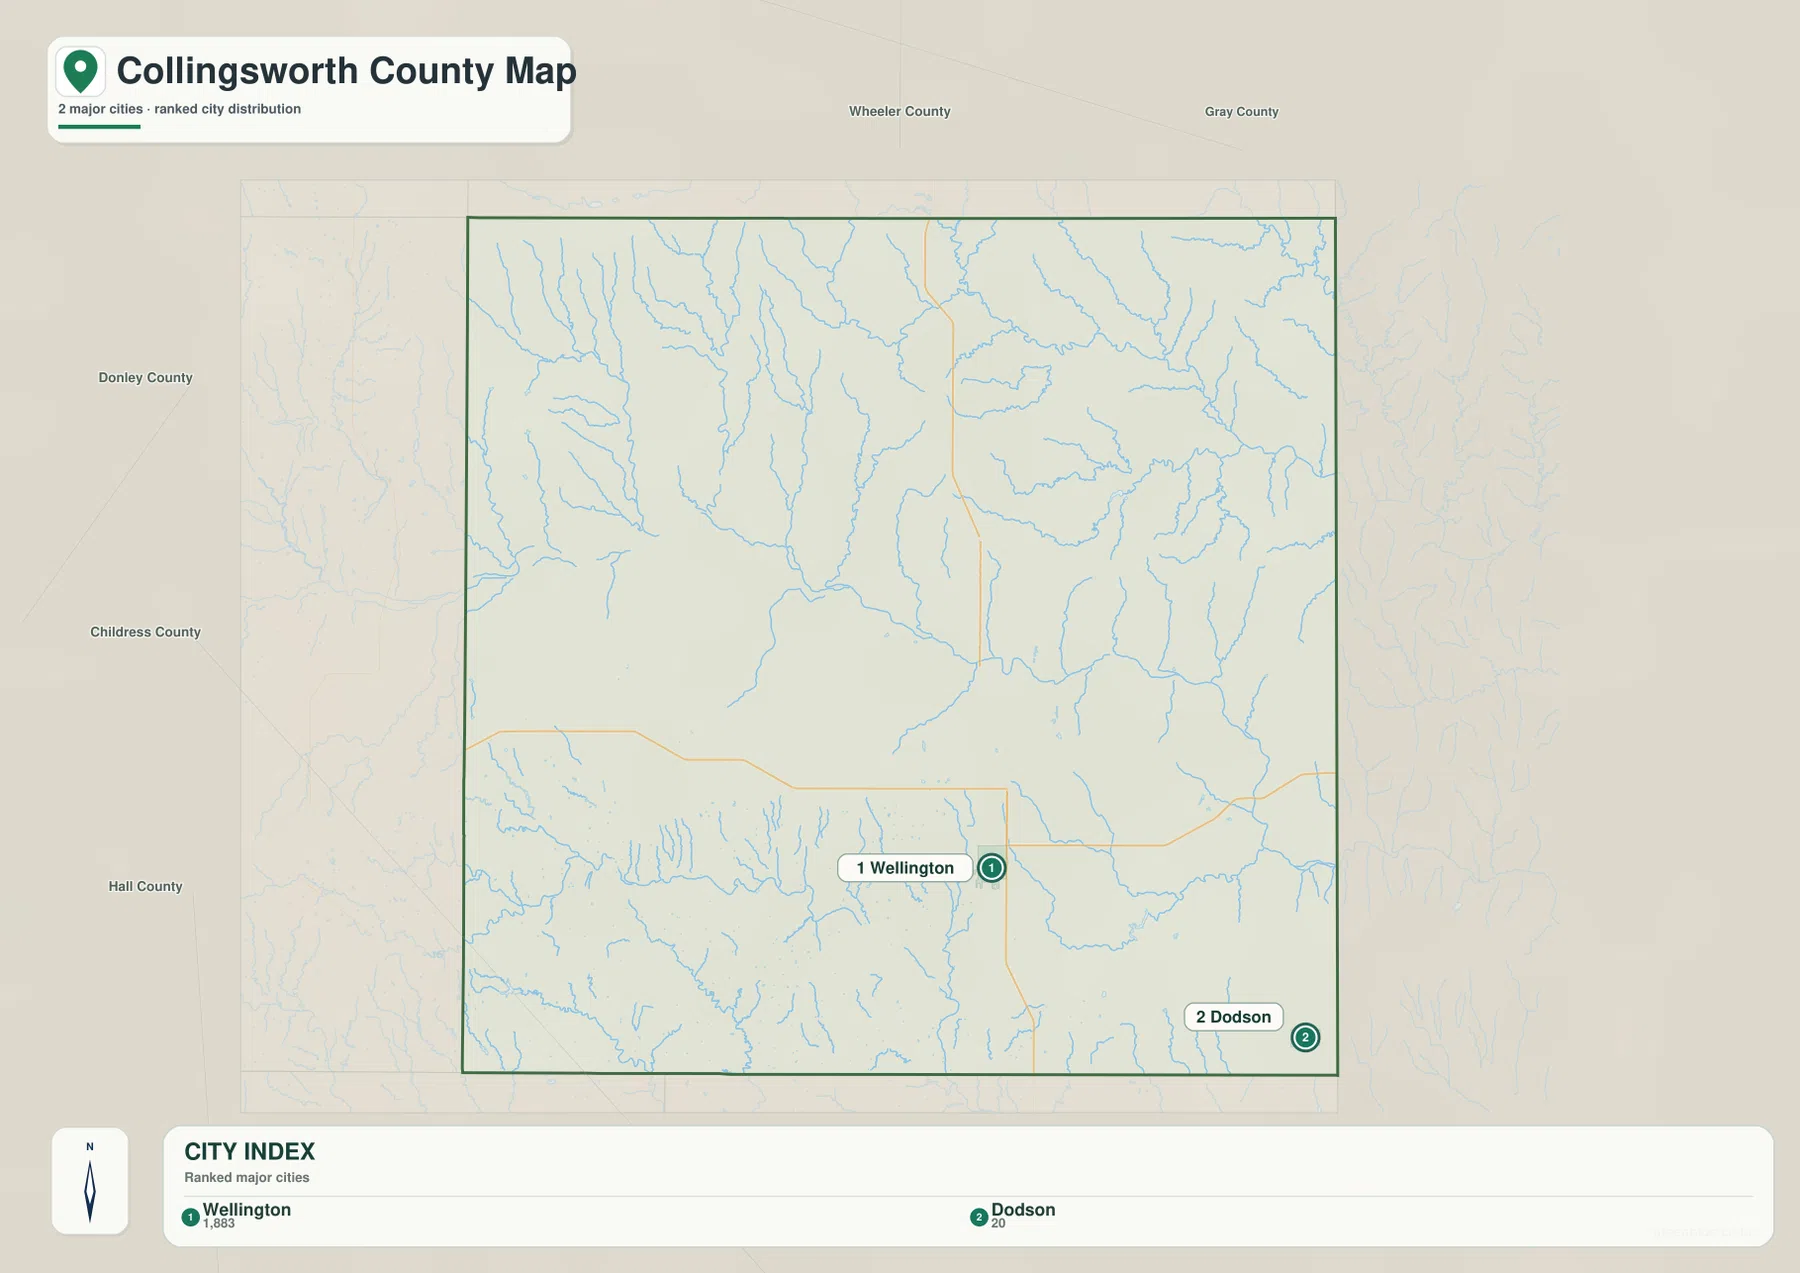
The ranked city map is intentionally simple. Its CITY INDEX lists Wellington at 1,883 and Dodson at 20, with only those two locations emphasized as ranked major cities. Wellington is positioned near the south-central part of the county, while Dodson is much closer to the southeastern boundary. The large rural space between them is immediately visible once minor road detail is removed.
This map does not draw a connector line or print a mileage value between Wellington and Dodson. The numbers 1,883 and 20 should therefore be read as the figures shown in the supplied CITY INDEX, not as distance or travel time. For transportation, the county road map is the better reference. Quail and Samnorwood are also visible on the general map but are not included in this two-place ranked layer.
The surrounding county labels help place the two points in a wider regional frame. Wheeler County lies north of Collingsworth County, while Hall and Childress counties appear to the west and southwest. Gray County is shown toward the east in the broader city-map view. Wellington occupies a more central position within these relationships, whereas Dodson is clearly shifted toward the southeastern side.
The simplified city view is also useful for seeing how strongly the Salt Fork valley divides the county. Wellington and Dodson both lie in the southern half of the map, while the higher northern uplands contain no ranked city point on this layer. The settlement picture therefore becomes easier to understand when the city map is paired with the water and elevation maps rather than treated as a complete description by itself.
Salt Fork Red River Forms the Main Valley Across the County
Salt Fork Red River is the dominant feature on the terrain-and-water map. It enters from the west, bends broadly across the center of Collingsworth County, and continues eastward through a wide low corridor. Numerous tributaries join from both sides, so the river is much more visually important on the water map than on the general road layer. Its valley separates higher western and northern terrain from large portions of the southern and eastern lowlands.
Elm Creek and Wolf Creek provide strong references north of the main river. Elm Creek follows a long course through the northeastern part of the county, while Wolf Creek occupies a lower corridor farther south. Smaller branching tributaries fill the northern half, especially toward the higher western and northwestern terrain. On the elevation surface, these channels correspond closely with narrow green valleys cut into the uplands.
South of the Salt Fork, Buck Creek becomes one of the most noticeable long channels. Sand Creek is prominent in the southeast near Lake Atteberry, while Club Lake and Dry Salt Creek provide smaller references in the southwestern corner. These water features show that the southern half contains several separate drainage corridors rather than one smooth plain extending away from the main river.
This terrain-and-water map is intended for general geographic reference. It is not a flood-hazard map, parcel or legal-boundary map, depth chart, water-quality report, fishing-status map, or navigation product. Those uses require specialized official information. For ordinary map reading, Salt Fork Red River, Elm Creek, Wolf Creek, Buck Creek, Sand Creek, and the labeled lakes provide a practical framework for understanding the county’s drainage.
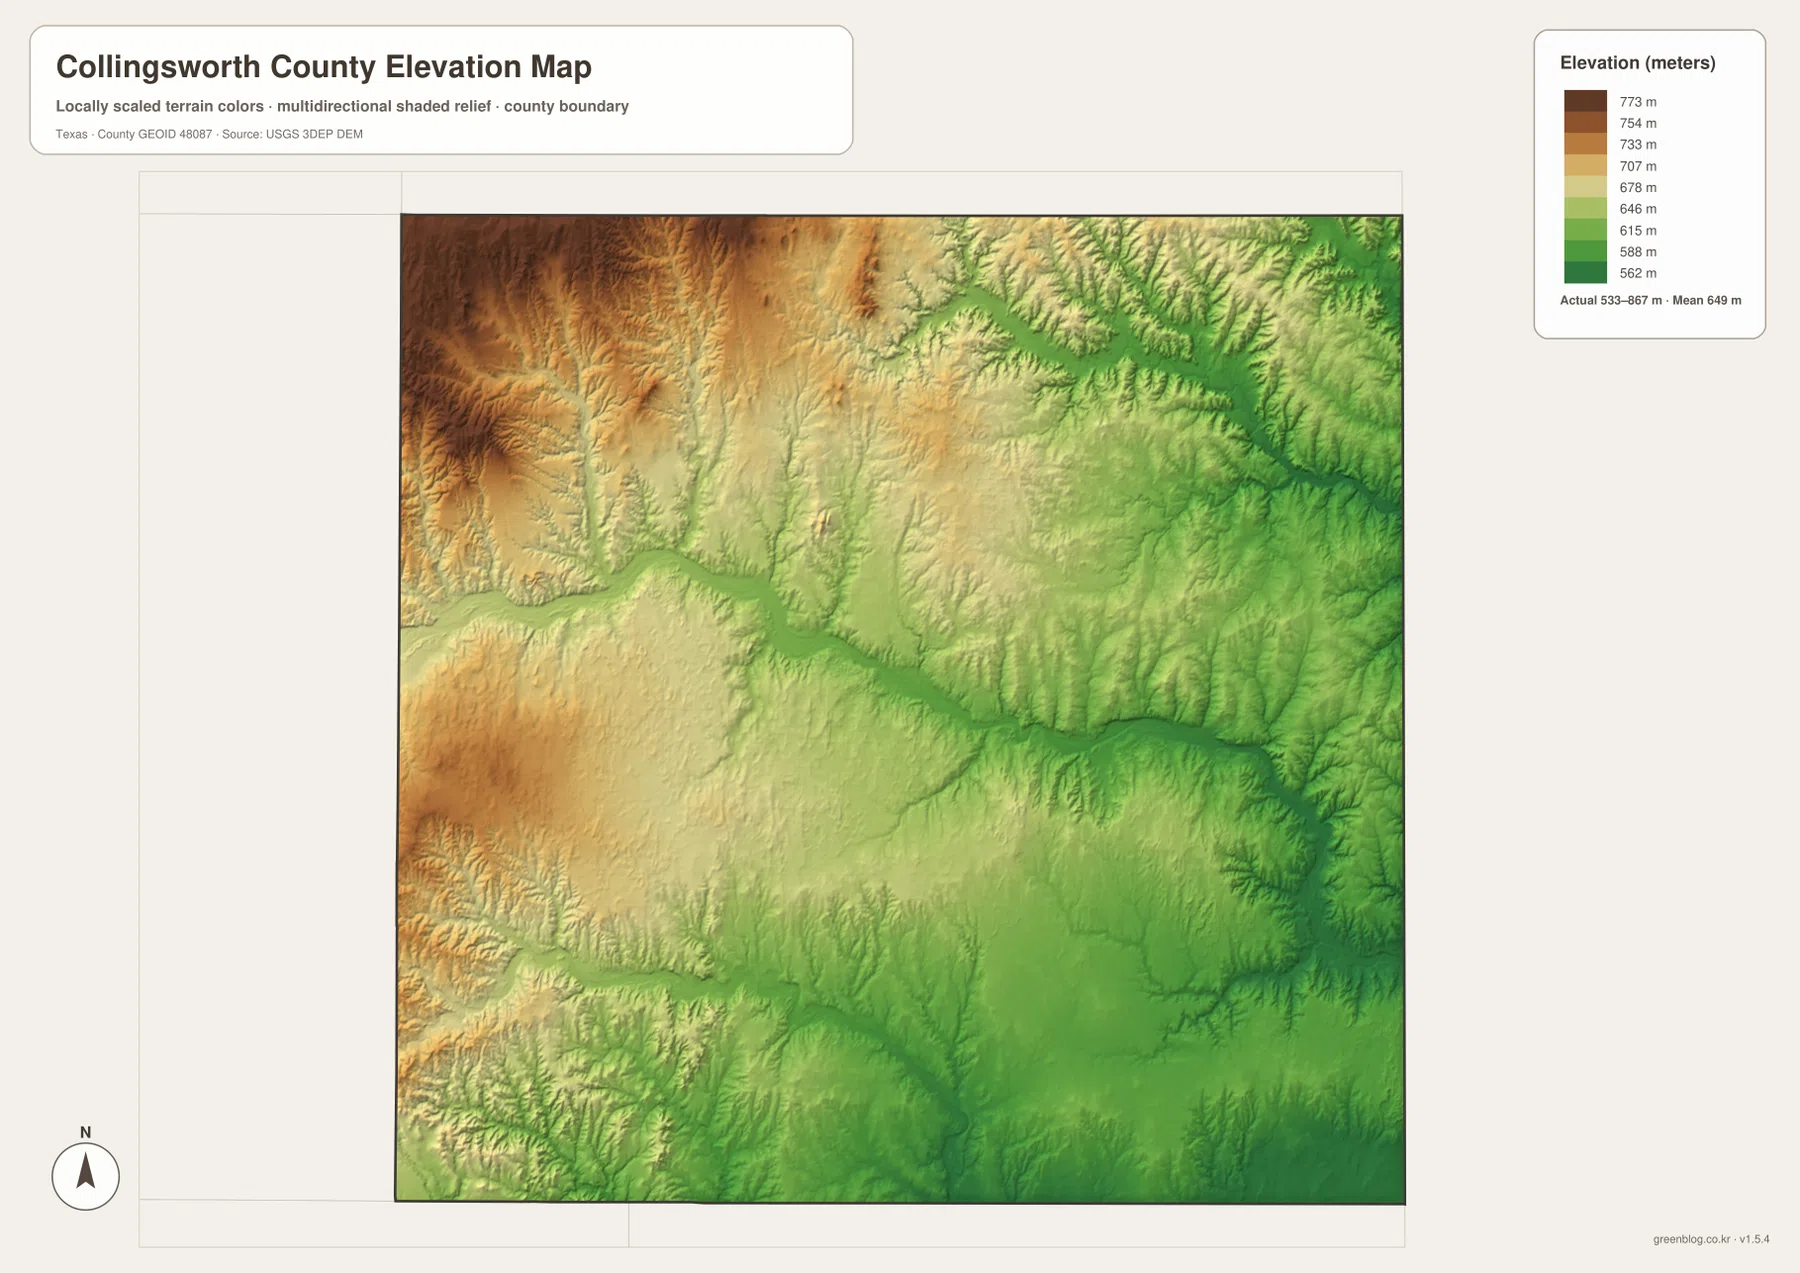
Elevation from About 533 to 867 Meters Drops from Western Uplands into the Salt Fork Valley
The supplied elevation map reports an actual range of approximately 533 to 867 meters and a mean near 649 meters. The highest dark-brown terrain is concentrated in the west and northwest, with another broad high area in the southwest. Salt Fork Red River forms a long green lowland through the center, and the eastern and northeastern parts are generally lower than the western uplands.
The northwest is not a smooth plateau. Narrow green creek valleys cut repeatedly into the brown high ground, creating a strongly dissected surface. These low channels align with the tributary network visible on the terrain-and-water map. As the land approaches the Salt Fork corridor, the elevation drops sharply and the main river valley becomes one of the clearest features on the entire map set.
The northeastern side is lower overall and contains broader drainage valleys. Elm Creek occupies one of those corridors, while the eastern Salt Fork segment lies in an extensive green lowland. In the south, Buck Creek and Sand Creek also follow lower terrain between gently higher ridges. The southeast around Dodson is therefore physically different from the higher Quail side in the west.
This elevation surface is suitable for county-scale comparison, not survey or engineering measurement. It should not be used to determine the precise elevation of a field corner, road grade, house, or construction site. The 533–867 meter range and 649 meter mean are best treated as broad reference values showing the strong transition from western uplands into the central Salt Fork valley and lower eastern drainage country.
Wellington Makes the Road–River–Relief Relationship Easy to See
Wellington is the most useful place for comparing all four map layers. On the county map, US 83 and State Highway 203 create the main transportation reference. On the water map, Salt Fork Red River and its tributaries lie immediately north and west of the town area. On the elevation map, that river corridor appears as a broad low green belt. Wellington therefore sits close to the transition between the central road hub and the county’s largest lowland feature.
Traveling west toward Quail brings the map closer to higher terrain. Brown and orange uplands become more extensive, and tributary valleys are sharply cut into the surface. Traveling southeast toward Dodson produces the opposite impression: lower green terrain becomes more common, with Sand Creek and Lake Atteberry providing water references. North toward Samnorwood, high rolling terrain and narrow drainage valleys return.
This contrast explains why the county looks simple on the road map but much more rugged on the physical maps. US 83 and Highway 203 are excellent orientation lines, yet Salt Fork Red River and the western uplands explain the land around those roads. Reading the maps together makes Wellington, Quail, Samnorwood, and Dodson feel like places in distinct terrain settings rather than isolated labels on a boundary outline.
Choosing the Best Collingsworth County File for Roads, Cities, Water, or Relief
The general county map is the most complete single reference for Wellington, Samnorwood, Quail, Dodson, US 83, and State Highway 203. The ranked city map is cleaner when the purpose is to compare Wellington and Dodson or show their positions without minor road detail. The terrain-and-water map is the best choice for Salt Fork Red River, Elm Creek, Buck Creek, Sand Creek, and the labeled lakes. The elevation map most clearly shows the high western uplands and the lower central and eastern valleys.
Small creek labels and minor road details can be difficult to read in a reduced browser preview. The original JPG files are more convenient for enlargement and printing. They also work well for side-by-side comparison with Wheeler, Childress, Hall, Donley, or other Panhandle counties when the same map type and similar display scale are used.
The ZIP below contains four high-resolution A3 JPG files corresponding to the county, city, water, and elevation maps shown in the article. They can be enlarged for detailed label reading, printed for classroom or personal reference, or arranged with neighboring county maps for regional comparison.
Frequently Asked Questions
Why does the ranked city map show only Wellington and Dodson?
The supplied ranked-city layer selects two major places and lists Wellington at 1,883 and Dodson at 20 in the CITY INDEX. Quail and Samnorwood are visible on the general county map but are not included in this ranked-city layer.
Where does Salt Fork Red River cross Collingsworth County?
It crosses the central part of the county from west to east in a broad, winding valley. Wellington lies close to the southern side of that corridor, while Elm Creek, Wolf Creek, and other tributaries descend from the north and Buck Creek and other channels approach from the south.
Which part of Collingsworth County is highest on the supplied elevation map?
The west and northwest contain most of the highest terrain. The map reports an elevation range of about 533–867 meters with a mean near 649 meters, while Salt Fork Red River and the eastern creek valleys occupy much lower ground.
Sources and Reference Data
- U.S. Census Bureau TIGER/Line Shapefiles — official geographic boundary, road, and place data.
- USGS National Hydrography — official information about rivers, creeks, lakes, and hydrography.
- USGS 3D Elevation Program — official elevation and terrain data information.
- USGS The National Map Viewer — interactive access to boundaries, transportation, hydrography, terrain, and other geographic layers.
Map File Information
Download the Collingsworth County county, city, water, and elevation maps together as high-resolution A3 JPG files.
- Included Files: 4 maps
- File Type: JPG
Related Maps
- Wheeler County Texas map
- Armstrong County Texas map
- Motley County Texas map
- Wilbarger County Texas map
- Swisher County Texas map
Green Map creates custom-edited map images using open geographic data sources such as geoBoundaries, Natural Earth, OpenStreetMap, and government open data.
These maps are edited visual materials, not raw data files, and are provided for education, documents, presentations, and graphic reference.