Brown County in west-central Texas is easiest to understand by starting with Brownwood and Early near the middle of the county, then looking north toward Lake Brownwood and east toward the higher ridges. The maps on this page show how towns, major highways, waterways, and elevation fit together, and the same subjects are available as high-resolution A3 JPG files in a downloadable ZIP for printing or closer inspection.
Brownwood sits slightly west of the county’s center, with Early immediately to the east. Bangs lies to the west, while Blanket and Zephyr extend the settlement pattern toward the east and southeast. Several U.S. highways converge around Brownwood and Early, so that central pair becomes a useful reference point for locating other communities, the county boundary, and the route north toward Lake Brownwood.
The four supplied views separate information that would be crowded on a single map. One emphasizes county boundaries, roads, places, and nearby counties; another measures straight-line connections from Brownwood to Early, Bangs, and Blanket. The water view brings Lake Brownwood and Pecan Bayou forward, while the elevation image shows a broad range of roughly 376 to 603 meters, with higher ground concentrated most clearly toward the east and northeast.
Table of Contents
Roads radiating from Brownwood and the shape of Brown County
The county map provides the best overall orientation because it places towns, highways, waterways, and the boundary in one frame. Brownwood and Early form the main cluster near the middle of the map, where U.S. 67, U.S. 84, U.S. 183, and U.S. 377 meet or separate. Texas routes 279 and 586 are also visible, making it clear that Brownwood is not simply the largest label on the map but a practical crossroads for moving toward the west, east, north, and south of the county.
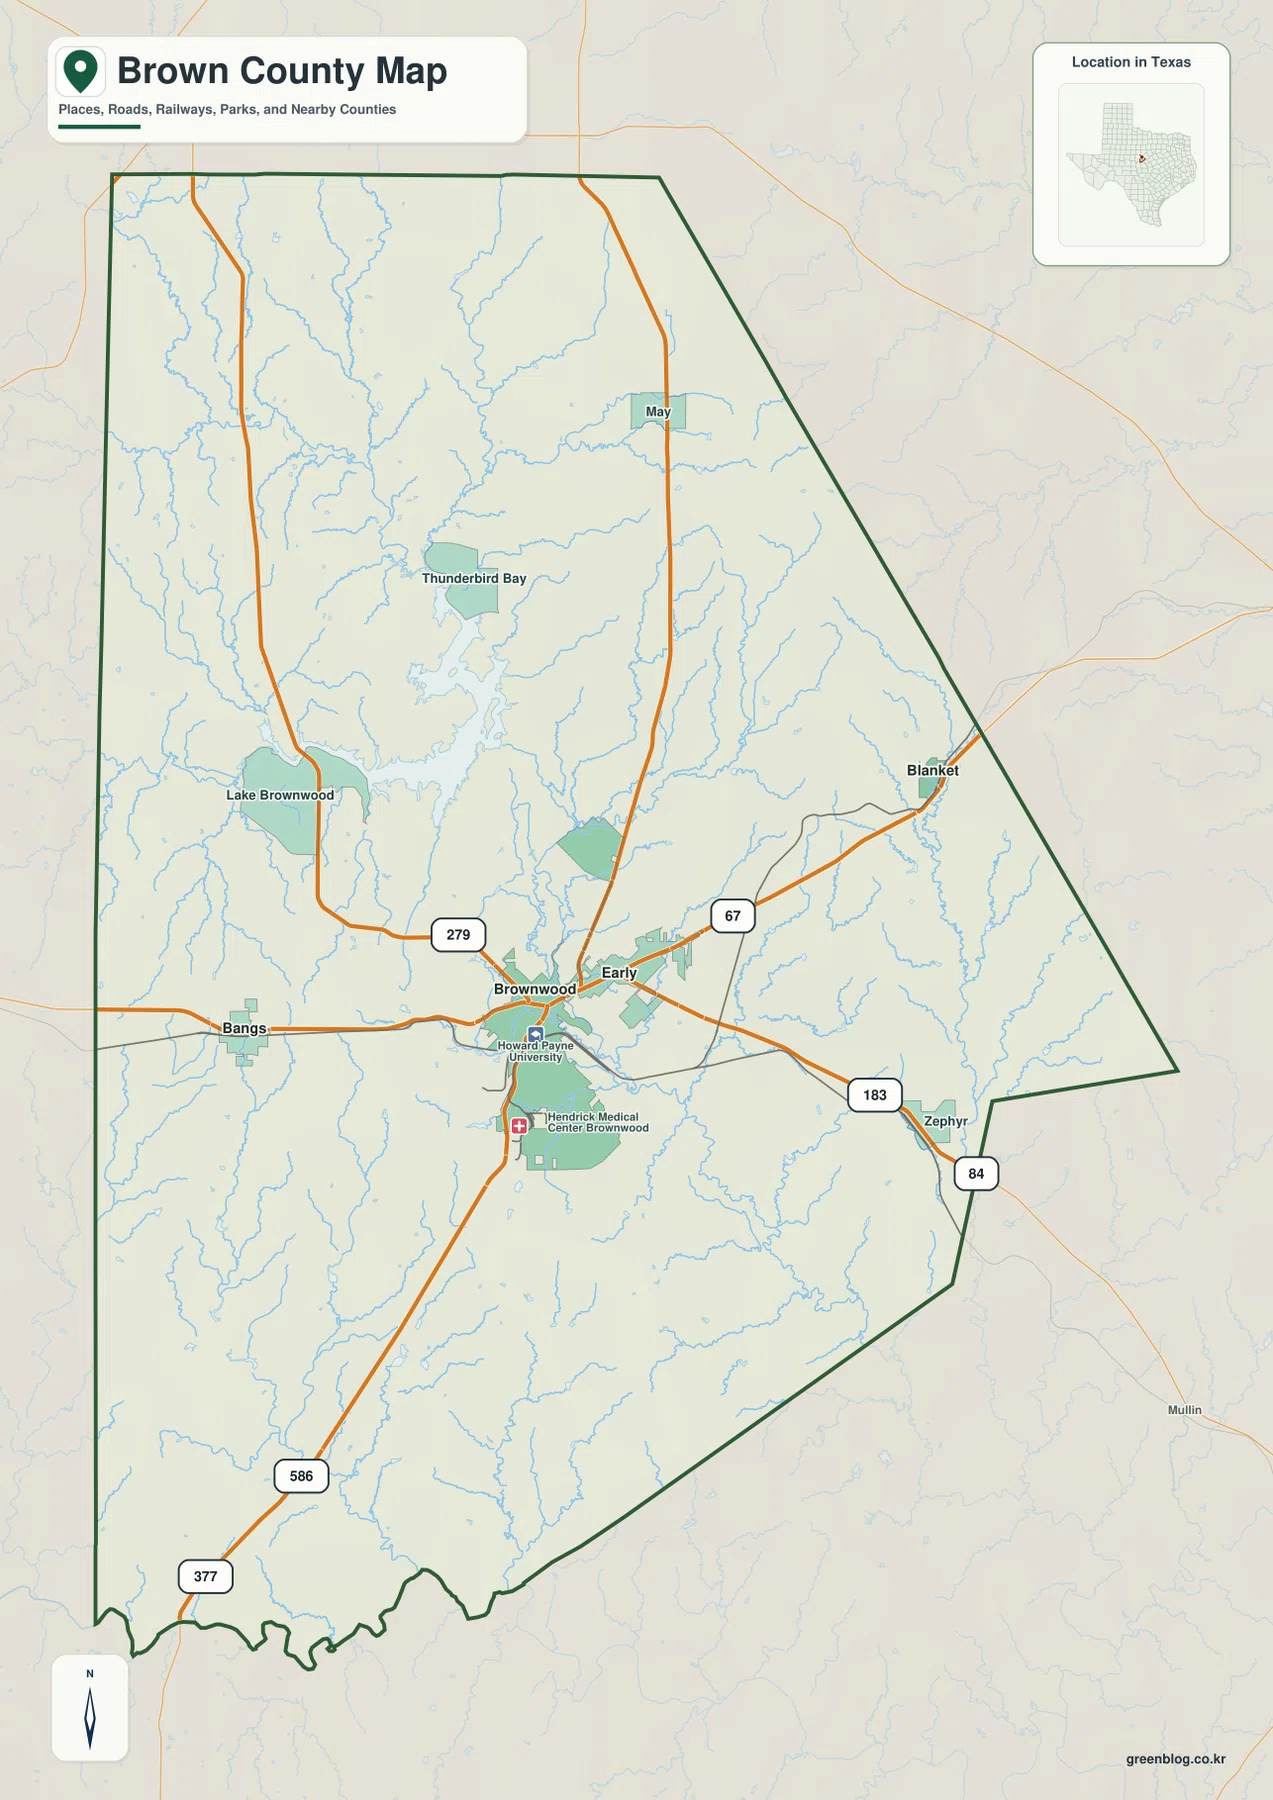
Bangs appears west of Brownwood, while Blanket and Zephyr sit to the east and southeast. May is farther north, and Thunderbird Bay is labeled closer to the Lake Brownwood area. This distribution gives the county a strong central focus without making every settlement part of one continuous urban area. The map is especially useful when a reader wants to see a town and immediately relate it to a highway, a water feature, or the edge of the county.
The county outline is also worth noticing. Much of the western side is comparatively straight, while the eastern boundary uses longer diagonal segments and an angular step in the southeast. Neighboring county names around the outside help place Brown County within the surrounding region. These boundary lines are appropriate for general geographic reference, but legal boundary questions and current road conditions should be checked against the responsible government agency or an up-to-date navigation source.
How Early, Bangs, and Blanket sit around Brownwood
The city-connections map strips away much of the detail and makes Brownwood the hub. Early is shown about 2 miles to the east, Bangs about 9 miles to the west, and Blanket about 13 miles to the east. Those numbers are straight-line distances between mapped points, not driving distances, so they should be read as a quick comparison of spacing and direction rather than as a mileage guide for a road trip.
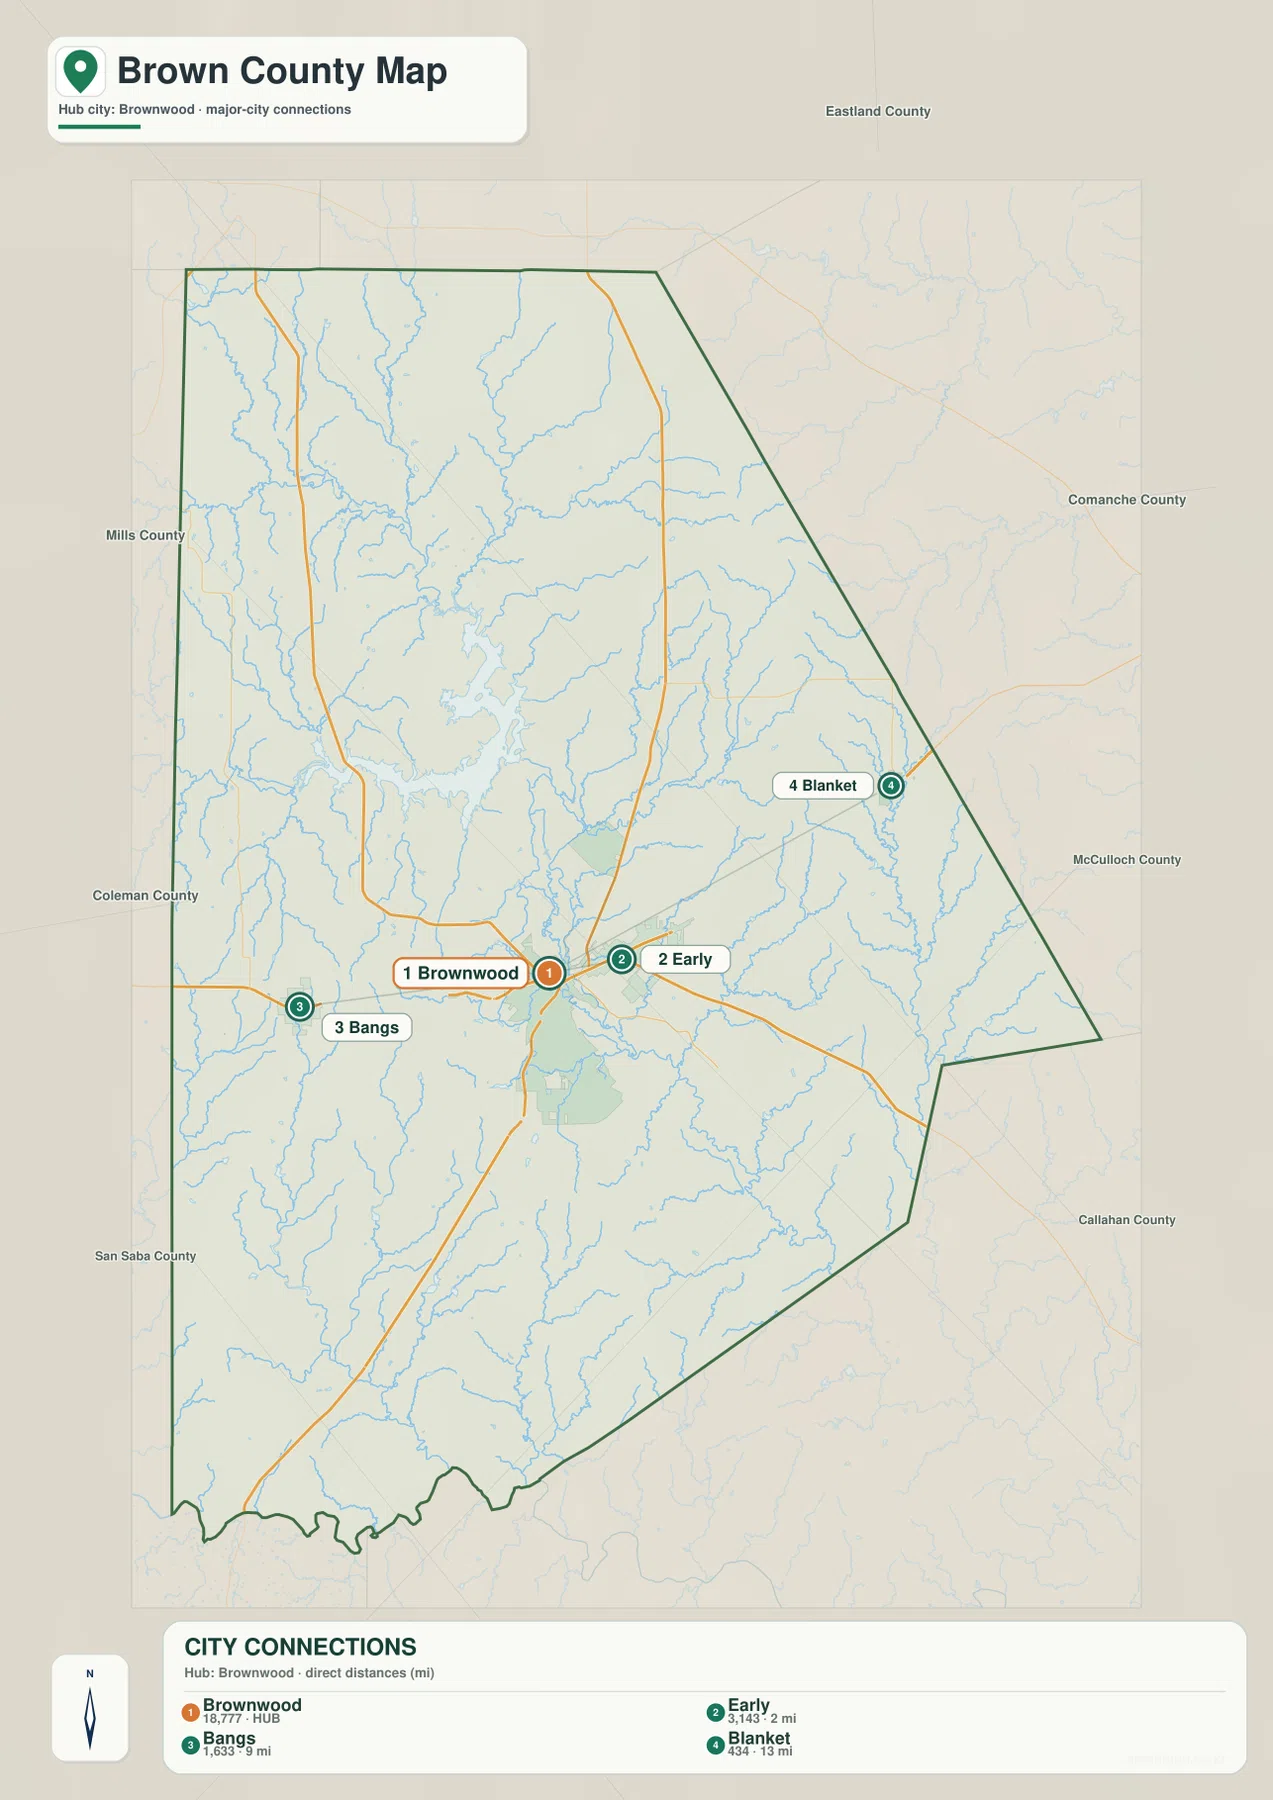
The 2-mile Brownwood-to-Early connection makes the closeness of those two communities obvious. Bangs and Blanket are farther away on opposite sides of the hub, so the map also shows how several of the county’s better-known places are arranged along an east-west pattern rather than being concentrated at a single point. When paired with the county map, the simple connectors gain more meaning because the roads linking those places can be seen at the same time.
For travel planning, the straight-line figures are only a starting point. Actual driving distance depends on the street used, the exact origin and destination, and the route available between them. For classroom use, a county overview, or a quick explanation of where the towns are relative to Brownwood, however, this simplified view is easier to read than a map filled with every road and local label.
Lake Brownwood, Pecan Bayou, and the county’s branching waterways
Lake Brownwood dominates the northern part of the water map. Its shoreline is irregular, with narrow arms and embayments extending into the surrounding terrain, and a network of smaller streams approaches the lake from several directions. Because Brownwood itself lies well to the south of the lake, comparing the county and water views gives a clear sense of the separation between the central urban area and the northern lake district.
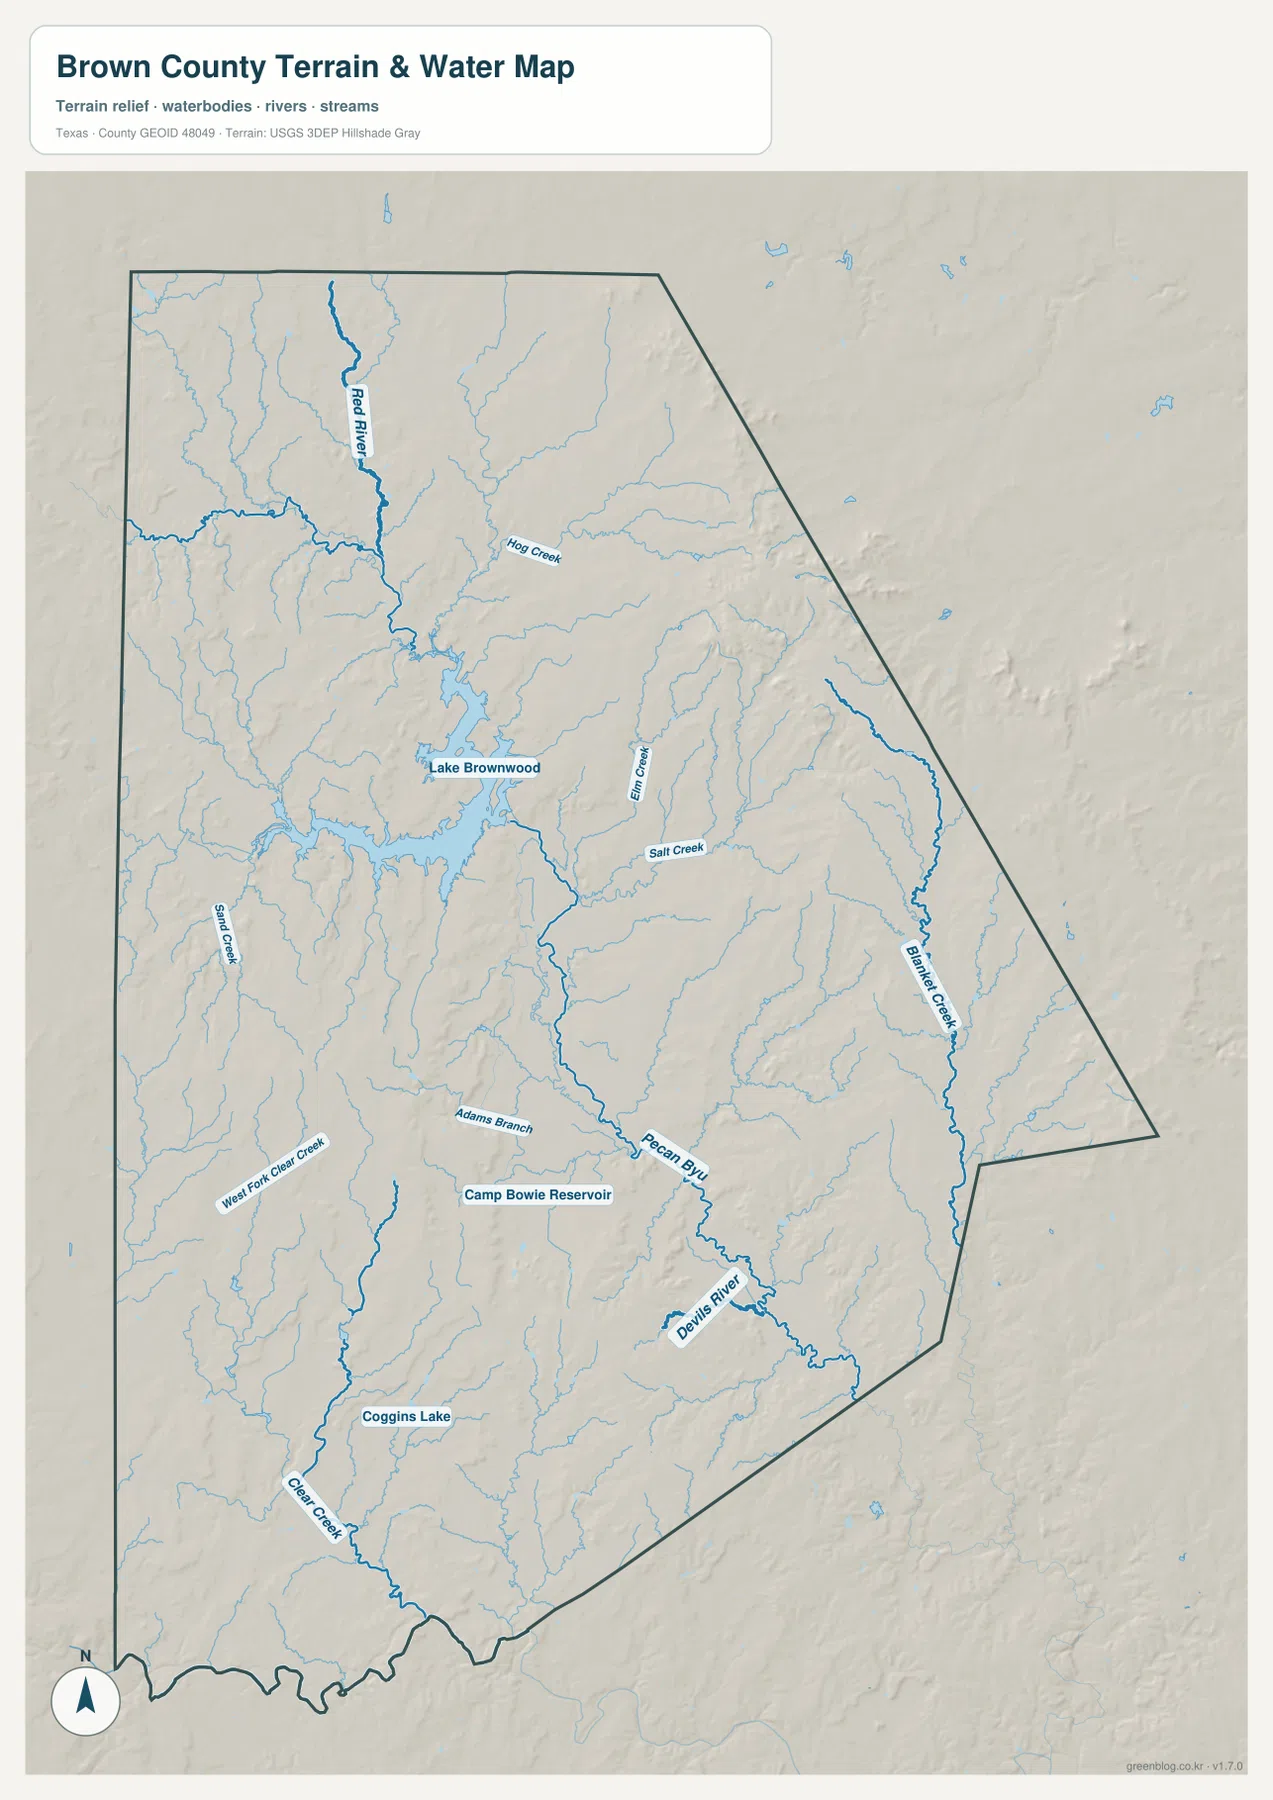
South of the lake, Pecan Bayou becomes the most useful labeled waterway for following drainage through the middle of Brown County and toward the southeast. Numerous smaller tributaries join the larger channel, while Camp Bowie Reservoir and Coggins Lake add smaller named water bodies in the southern half of the map. Removing most road information lets the branching stream network remain visible even where several channels are close together.
A practical way to read this view is to start at Lake Brownwood, follow the larger connected watercourses southward, and then examine the smaller tributaries that feed them. The image is intended to show location and general drainage relationships. It is not a flood map, depth chart, navigation product, or legal water-boundary document, so decisions involving flood risk, boating, property limits, or water management should use current information from the appropriate agencies.
Higher eastern ridges and lower central-to-southern ground
The elevation map reveals relief that is easy to miss on the road-focused view. Its legend gives an actual range of about 376 to 603 meters and a mean near 463 meters. Brown and tan tones are strongest along higher ground in the east and northeast, while greener colors cover broader lower areas through the center and south. The result is a county with repeated ridges and valleys rather than a uniformly flat surface.
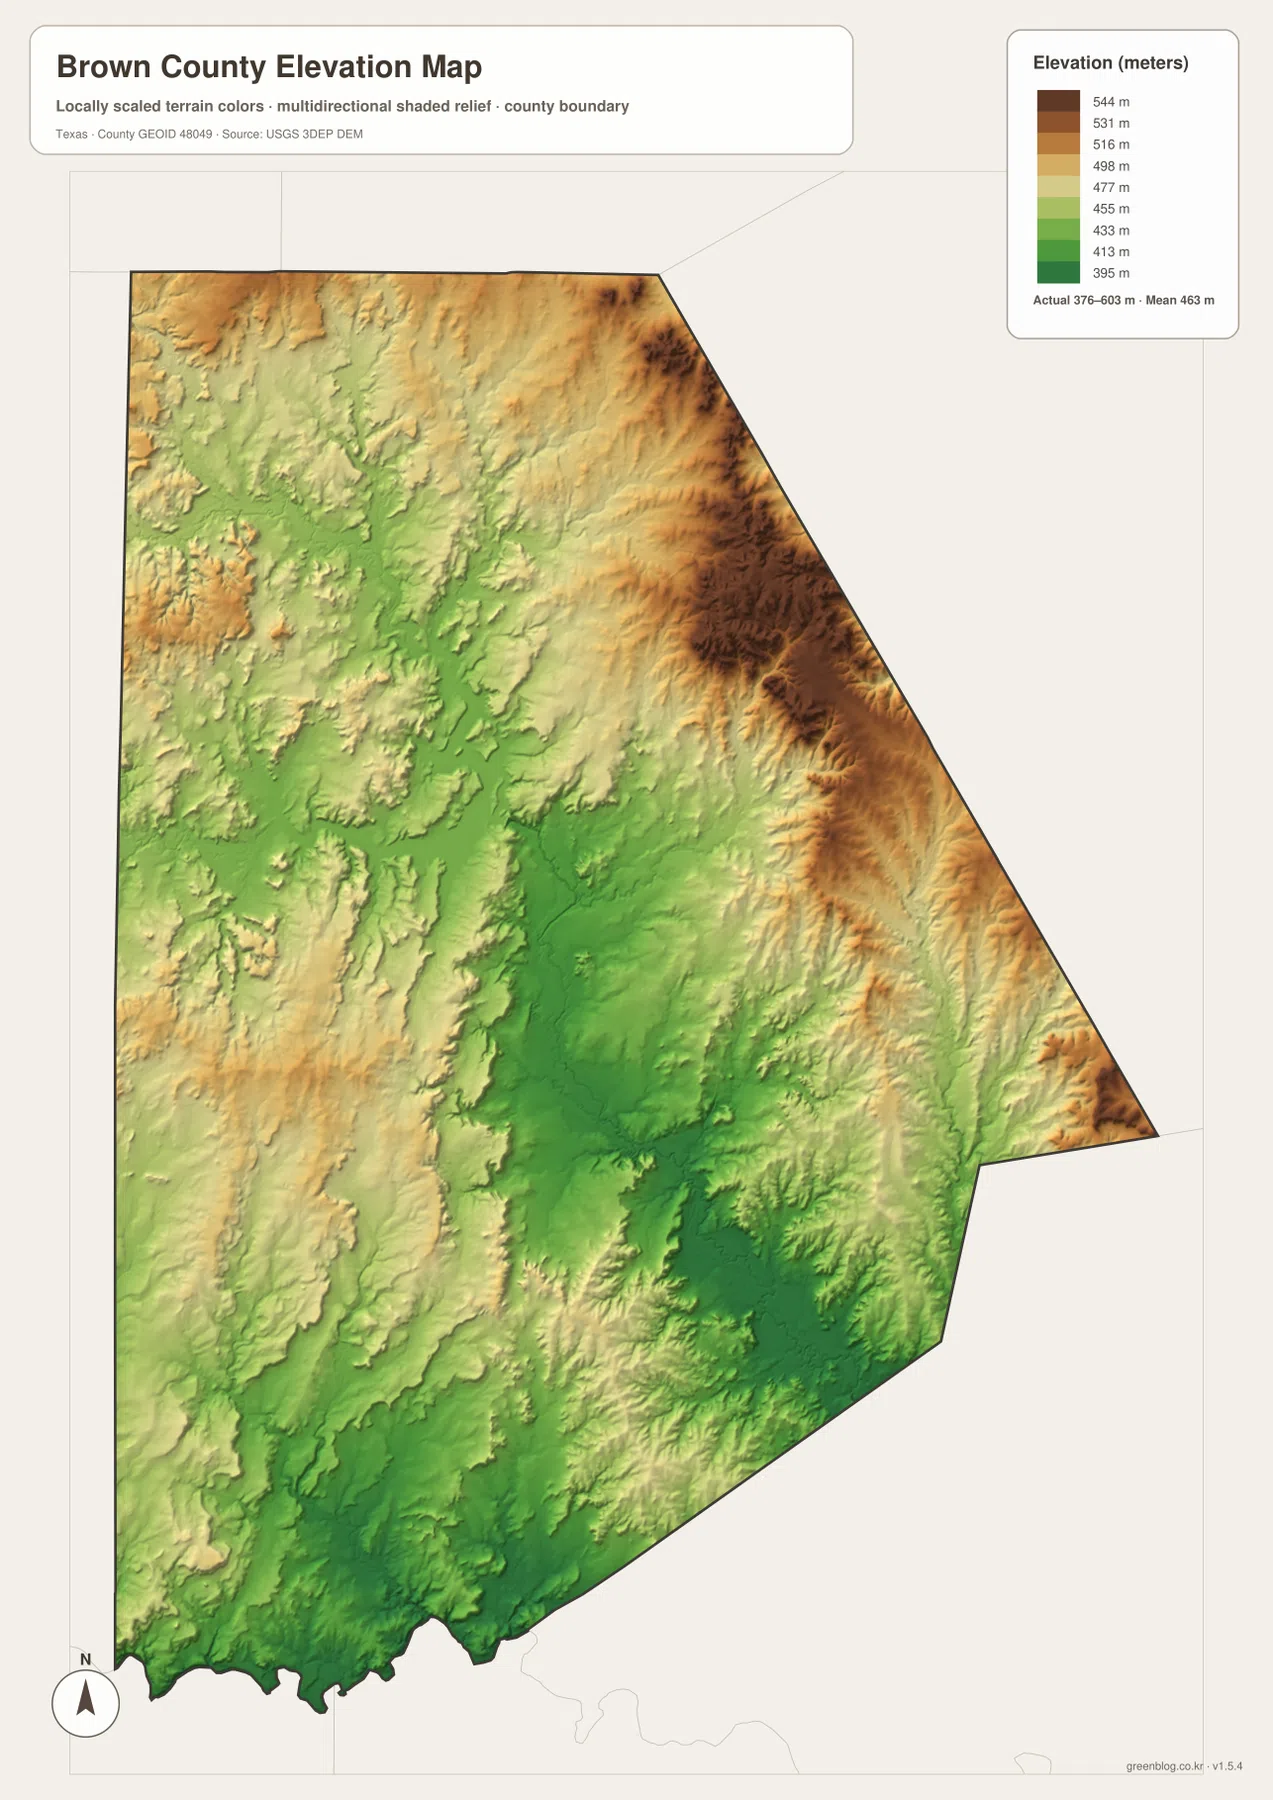
Placing the elevation and water maps side by side makes the relationship between valleys and drainage easier to recognize. Many stream corridors occupy lower green areas between higher ridges, and the terrain around Lake Brownwood contains a mix of shallow valleys and upland fingers instead of one flat basin. Farther south, lower colors spread over a wider area, though small local rises are still visible in the shaded relief.
The legend is designed for broad county-scale comparison, not site-level measurement. It can show that one part of Brown County is generally higher than another, but it cannot provide a survey-grade elevation for a building pad, property corner, or road project. Engineering, construction, and precise grade decisions require current official elevation data and appropriate professional measurements.
Choosing the map that matches what you need to find
If the question is where Brownwood, Early, Bangs, Blanket, major highways, and the county edge are located, begin with the county map. Use the city-connections view when the main goal is to compare direction and straight-line distance from Brownwood. The water map is clearer for Lake Brownwood, Pecan Bayou, reservoirs, and tributaries, while the elevation image is the most direct way to compare higher ridges with lower valleys.
Two views often work better than one. For example, the county map can establish the route and direction from Brownwood toward Lake Brownwood, then the water map can show the lake shoreline and surrounding tributaries in more detail. The city map quickly establishes how close Brownwood and Early are, while the water and elevation maps together make it easier to see why stream corridors often line up with lower terrain.
The WebP versions in the article are optimized for convenient online viewing. The downloadable ZIP contains the corresponding county, city, water, and elevation maps as high-resolution A3 JPG files, which are better suited to printing, enlarging small labels, or preparing a classroom or presentation handout. These remain general-reference maps, so legal boundaries, live road conditions, flood determinations, and precise elevations should always be confirmed with current official sources.
Frequently Asked Questions
How close are Brownwood and Early on the city-connections map?
The map shows a straight-line distance of about 2 miles between Brownwood and Early. That is useful for understanding how closely the two communities sit together, but it is not a driving distance; an actual trip varies with the streets used and the exact start and end points.
Which view is best for Lake Brownwood and Pecan Bayou?
Start with the county map if you want to relate the water features to towns and highways, then switch to the water map for a clearer view of Lake Brownwood, Pecan Bayou, and the branching tributaries. The water view removes much of the road clutter, so the connections among streams and reservoirs are easier to follow.
Can the elevation map be used for surveying or construction?
No. The elevation map is a county-scale reference for broad relief and relative height differences. Although the legend shows an approximate 376–603 meter range, site-specific engineering, construction, and property decisions require current official elevation data and appropriate professional surveying.
Map File Information
Download the supplied Brown County county, city-connection, water, and elevation maps as high-resolution A3 JPG files. The ZIP contains all four map files shown in this article.
- File Type: JPG
Related Maps
- San Saba County Texas map
- Shackelford County Texas map
- Taylor County Texas map
- Runnels County Texas map
- Palo Pinto County Texas map
Sources and county references
For local government information, visit the official Brown County website, and for county background consult the Texas State Historical Association Brown County entry. Geographic reference data can be checked through U.S. Census Bureau TIGER/Line for boundaries and roads, USGS National Hydrography for waterways, and the USGS 3D Elevation Program for elevation information. The maps on this page are intended for general reference, printing, and learning rather than legal, engineering, flood-determination, or real-time navigation use.
Green Map creates custom-edited map images using open geographic data sources such as geoBoundaries, Natural Earth, OpenStreetMap, and government open data.
These maps are edited visual materials, not raw data files, and are provided for education, documents, presentations, and graphic reference.