Hempstead County lies in southwestern Arkansas, where Hope forms the strongest road and settlement center on the supplied maps and the Little River bends along the lower southwestern edge. The northern and central parts of the county contain more rolling uplands cut by many small streams, while the southwest opens into a broader, lower river landscape. This page shows the locations of Hope, Perrytown, Fulton, Blevins, Washington, and McNab, along with major roads, named creeks and lakes, and an elevation range of about 67 to 169 meters. You can download the same four maps as high-resolution JPG files in one ZIP.
Hope is the most prominent place on both the general county map and the ranked city map. It sits in the southeastern half of the county, where several routes converge before continuing west toward Fulton, north toward Washington and Blevins, and south toward Patmos. Roads 67, 278, 29, and 174 are among the clearest labels around the city. Using Hope as the first reference point makes it much easier to understand where the smaller communities, creeks, and lower river country lie.
Table of Contents
Start at Hope and follow the roads outward
The road pattern around Hope is denser than in most other parts of the county. Route 67 runs west toward Fulton, while Route 278 continues east from the city. Route 29 heads south toward Patmos, and Route 174 serves the area south and southwest of Hope. To the northwest, Routes 73 and 4 lead toward Washington, while roads such as 299, 332, and 371 connect the northeastern side around Perrytown and Blevins. Looking at these directions first is more useful than trying to memorize every number.
Moving west from Hope, the map passes through a less urban landscape toward McNab and Fulton near the Little River side of the county. Northward, Washington appears before Blevins and McCaskill farther up the map. Perrytown is close to Hope on the east side, and Patmos sits much farther south near the lower county boundary. The change from the concentrated Hope road network to the more widely spaced western and northern routes is one of the clearest differences visible on the general map.
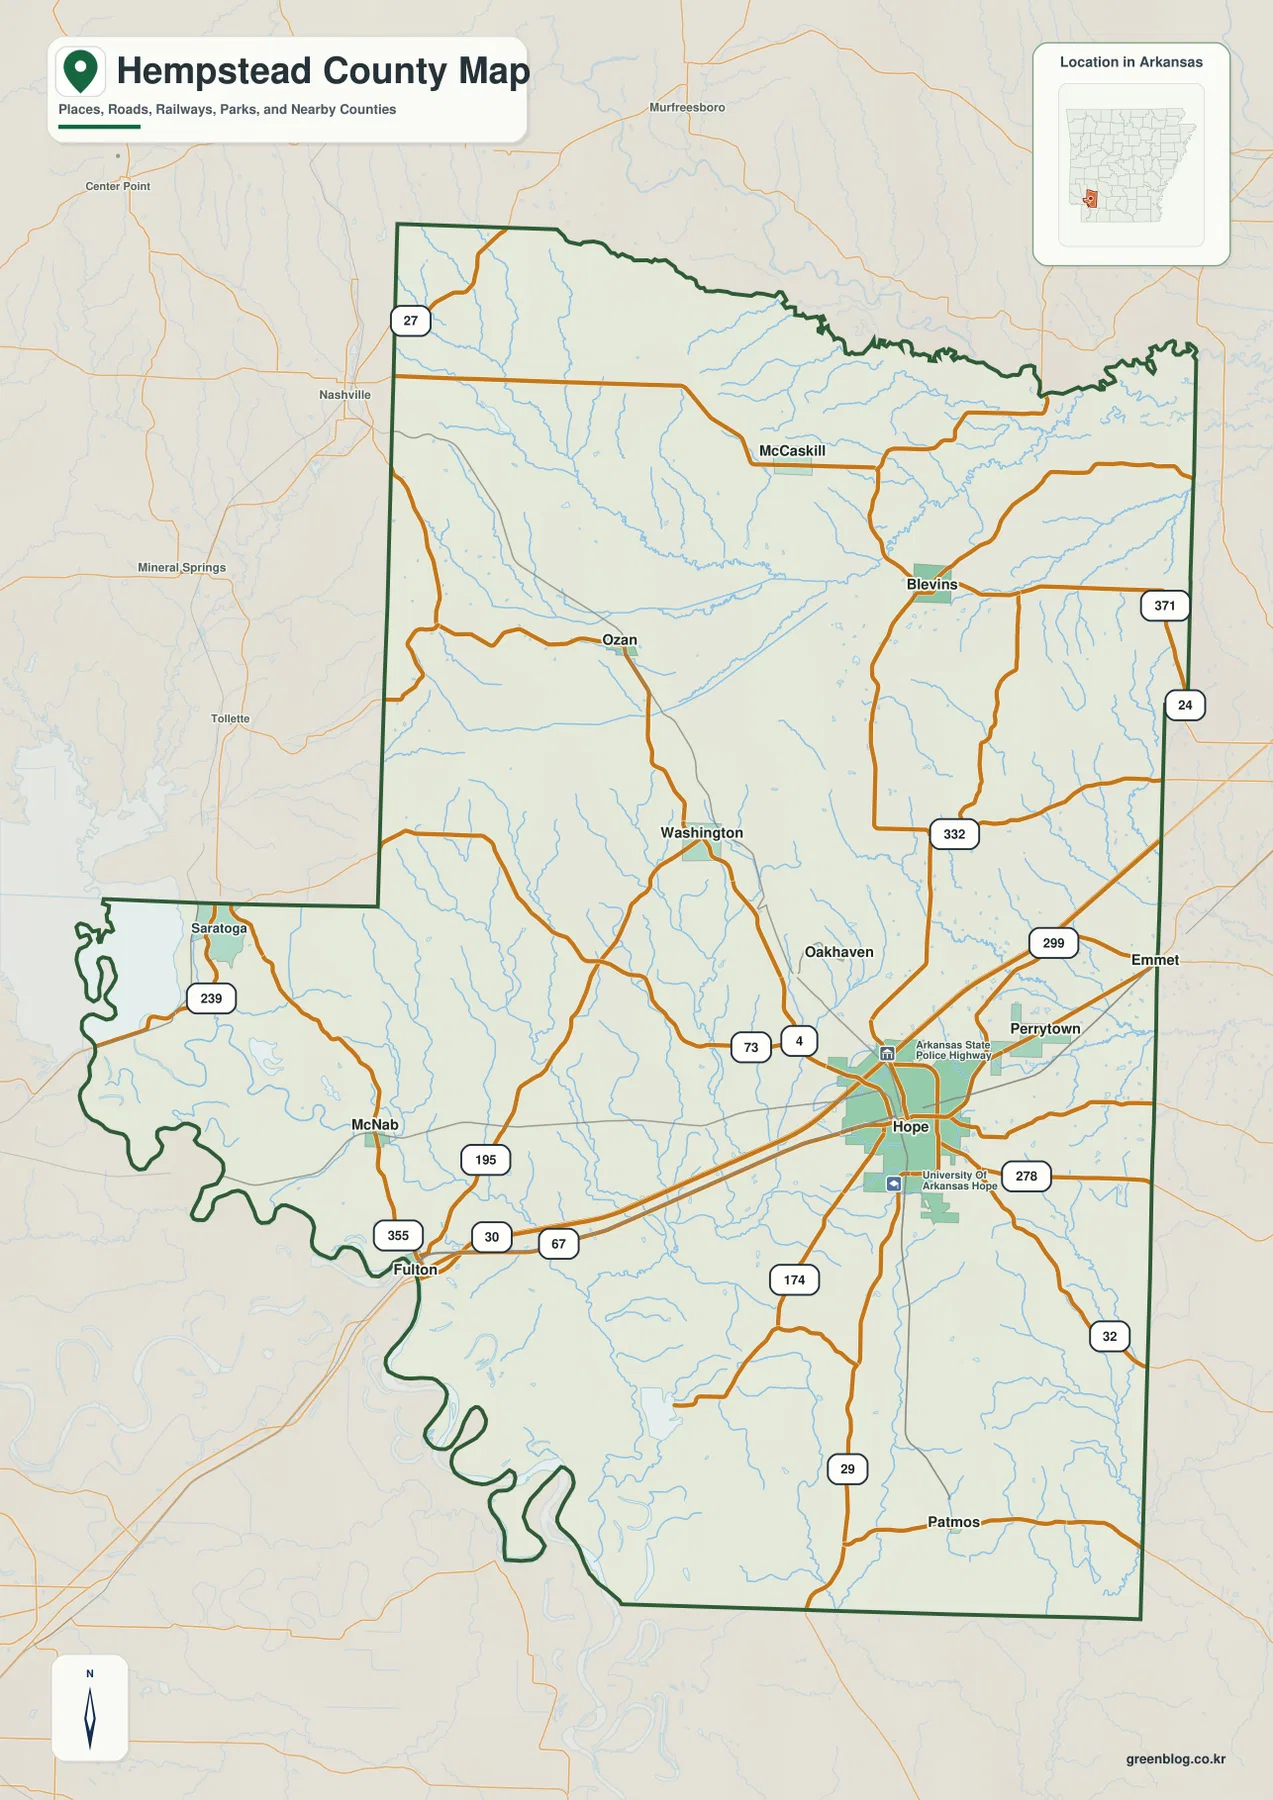
The county outline changes character along the southwest. Instead of a simple straight border, the boundary follows large bends near the Little River, creating a series of lobes and curves. The eastern and southern sides include longer straight sections, while the northern edge has many smaller irregular turns. Nearby places such as Nashville, Murfreesboro, and Emmet are shown lightly outside the county for orientation. These labels help place Hempstead County within southwestern Arkansas without taking attention away from the local map.
The ranked city map shows one strong center and five smaller places
The city map ranks six major communities. Hope is number 1, followed by Perrytown at 2, Fulton at 3, Blevins at 4, Washington at 5, and McNab at 6. The numbered circles are ranking markers, not mileage labels. Hope occupies the southeastern center of the settlement pattern, while the other communities are spread west, northwest, and north across the county. This arrangement makes the city map especially useful for understanding distribution rather than travel distance.
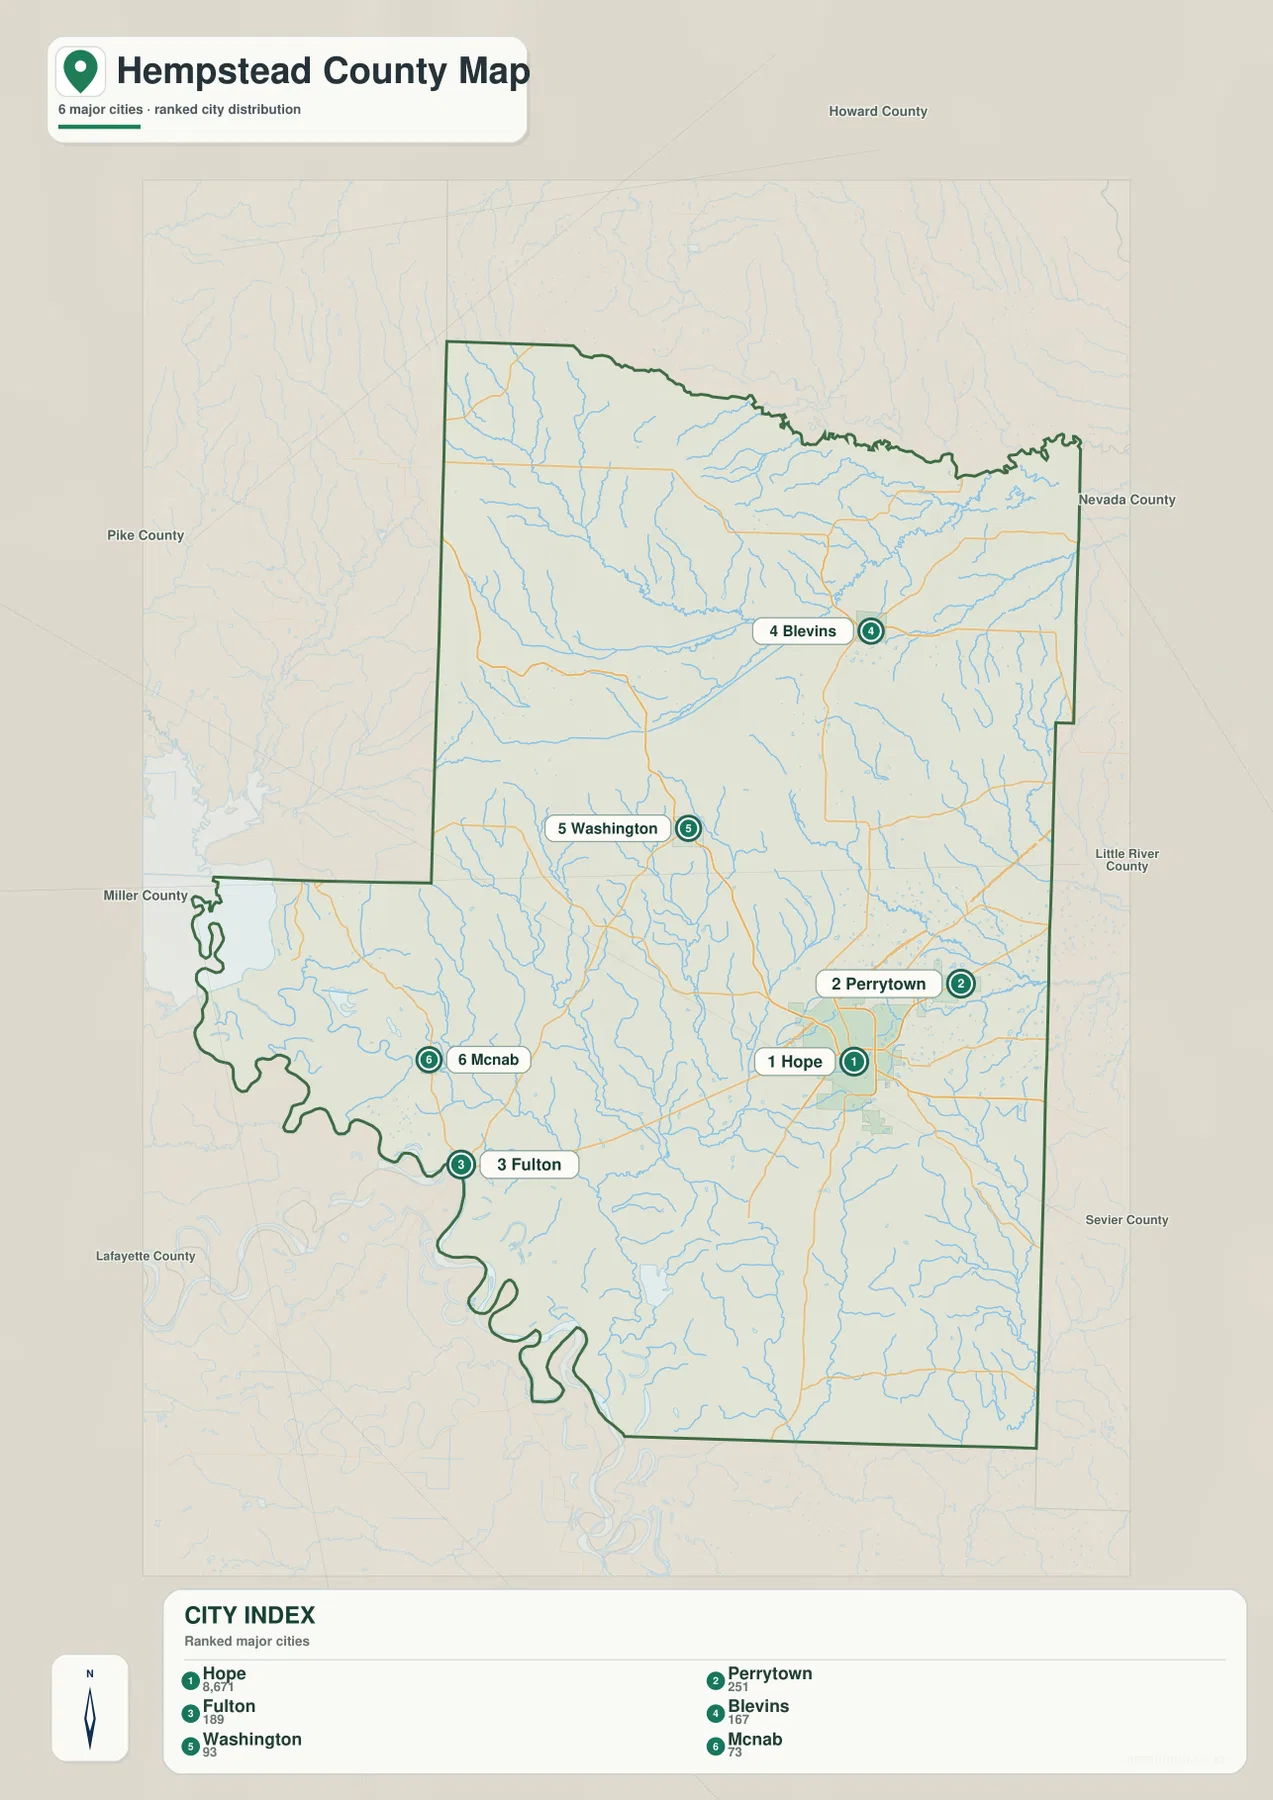
Hope and Perrytown sit relatively close together on the southeastern side, while Blevins is far to the north. Washington is west of the county’s center, and Fulton and McNab lie closer to the southwestern Little River country. The six places therefore do not form a single chain. Comparing this simplified city view with the general road map makes it easier to see which routes connect each direction from Hope.
The legend also contains numeric values beside the city names, but this article does not treat those values as current population statistics. The supplied map clearly supports the rank and location of the six cities, so those are the facts used here. Anyone who needs current population or administrative statistics should consult a recent Census source separately rather than interpreting a simplified map legend as a demographic table.
Little River lowlands contrast with the Ozan Creek uplands
The Little River is the largest water feature shown within the county boundary. It follows the southwestern edge in broad bends, where the terrain becomes low and open compared with the northern uplands. Beard Lake, Grassy Lake, and Red Lake are grouped near this western river area. If you locate Fulton and McNab on the general map and then switch to the terrain and water view, their relationship to the river lowland becomes much easier to understand.
North Fork Ozan Creek is the strongest labeled stream in the northern and northwestern part of the county. It cuts through rolling uplands before turning toward the center. Farther east, Terre Rouge Creek crosses the east-central side, while Caney Creek follows another long valley toward the south. Sandy Branch Creek, Bois D Arc Creek, and Bridge Creek add several more named channels through the central and southern landscape. Together, these waterways show a county divided by many creek valleys rather than one drainage corridor alone.
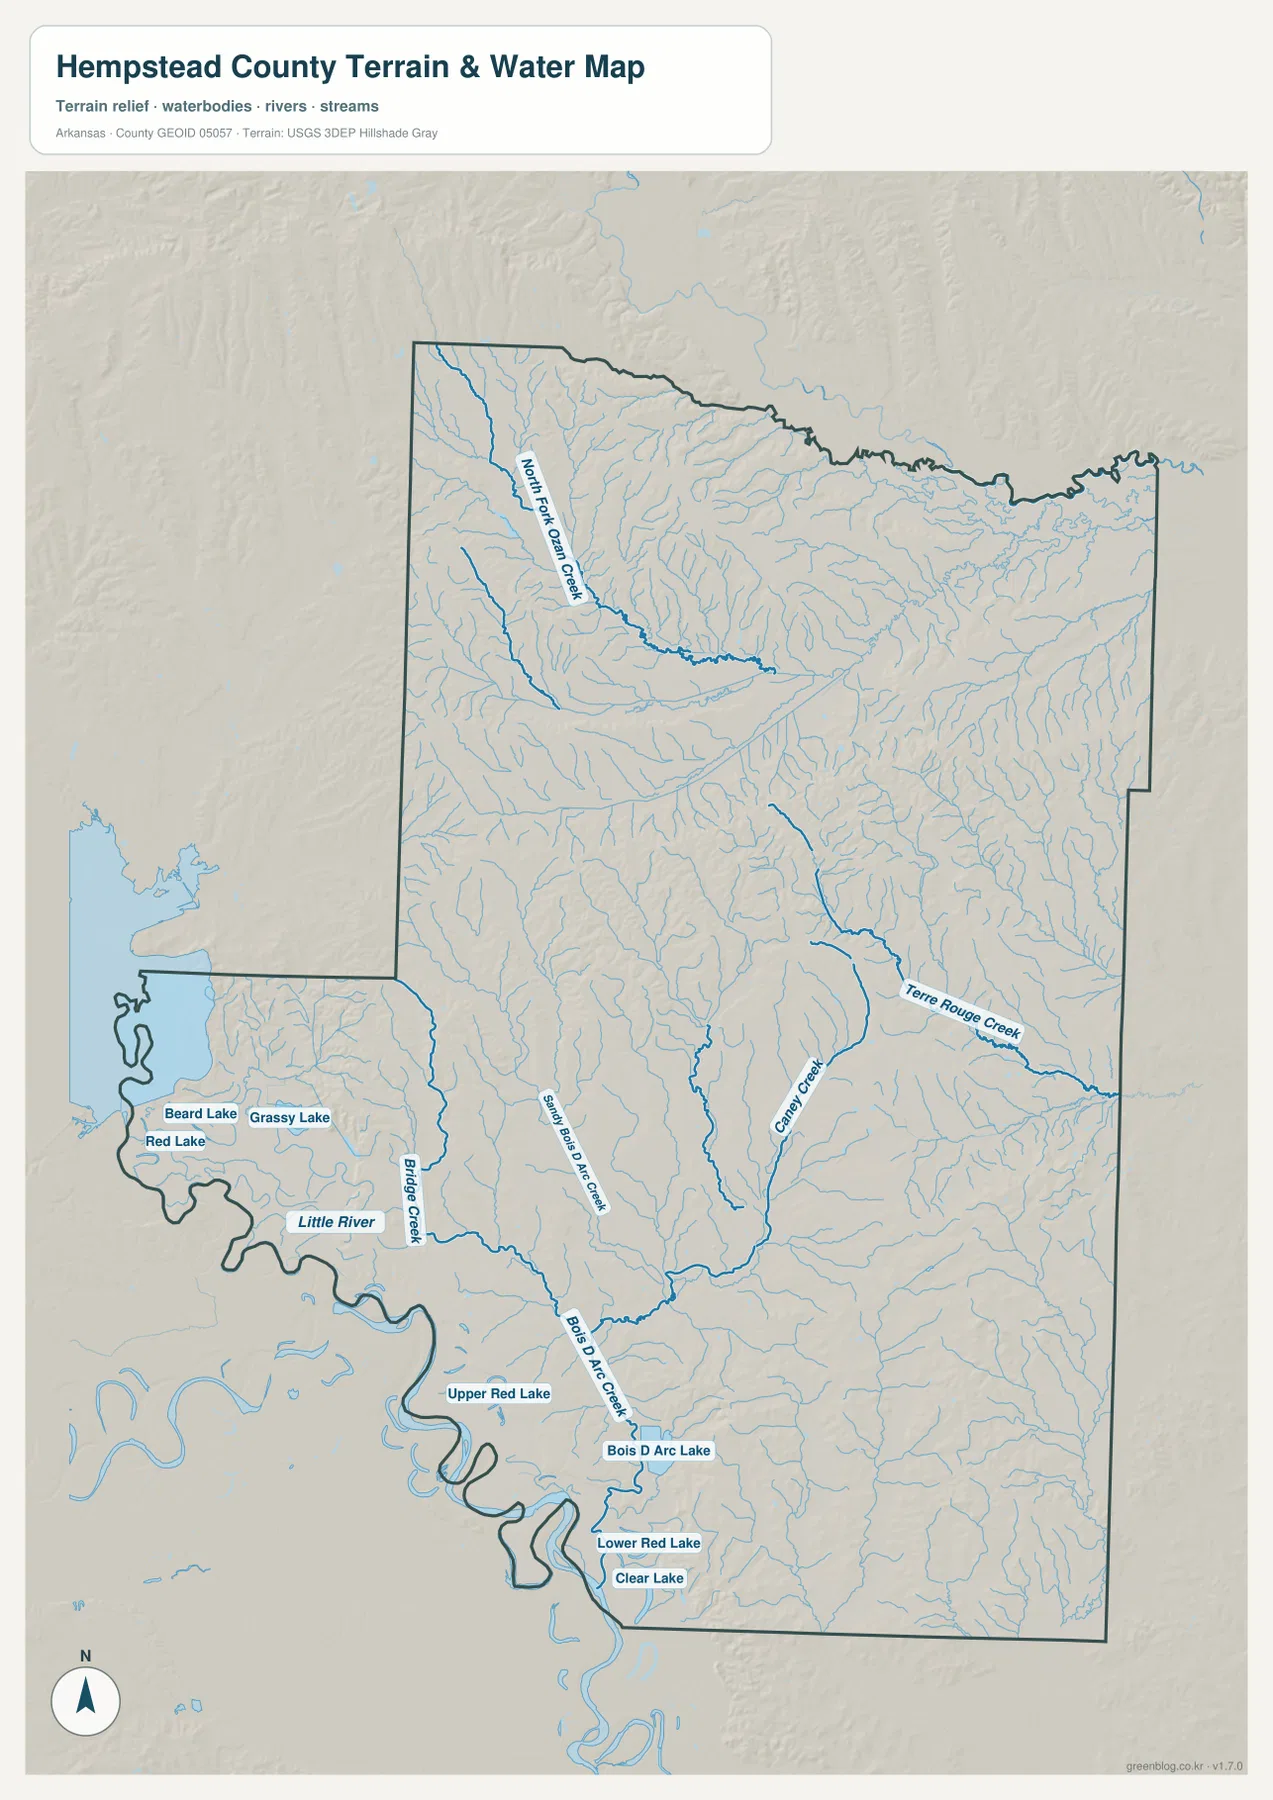
Near the southern river country, Upper Red Lake, Bois D Arc Lake, Lower Red Lake, and Clear Lake appear within a relatively small area. On the elevation map, this same section is dominated by lower green terrain. The north is very different: Ozan Creek and its tributaries run between more pronounced ridges and valleys. Seeing the lakes, streams, and shaded terrain together makes the north-to-southwest change more obvious than either map would on its own.
The water map is intended for general geographic reference. It does not show current river stage, flood risk, fishing regulations, parcel boundaries, or live road conditions. The Little River and smaller creeks may change with rainfall and local conditions. For recreation, flooding, or safety decisions, use current information from USGS or the appropriate local or state agency rather than relying on this reference map alone.
Elevation falls from northern ridges toward the Little River
The supplied elevation map shows an actual range of about 67 to 169 meters, with a mean near 104 meters. That is roughly 102 meters of relief across the county. Brown and tan colors cover much of the northern and north-central uplands, while green terrain becomes much more extensive along the Little River and the southern edge. Hope lies between these extremes in an area of smaller ridges and valleys rather than in the county’s highest or lowest ground.
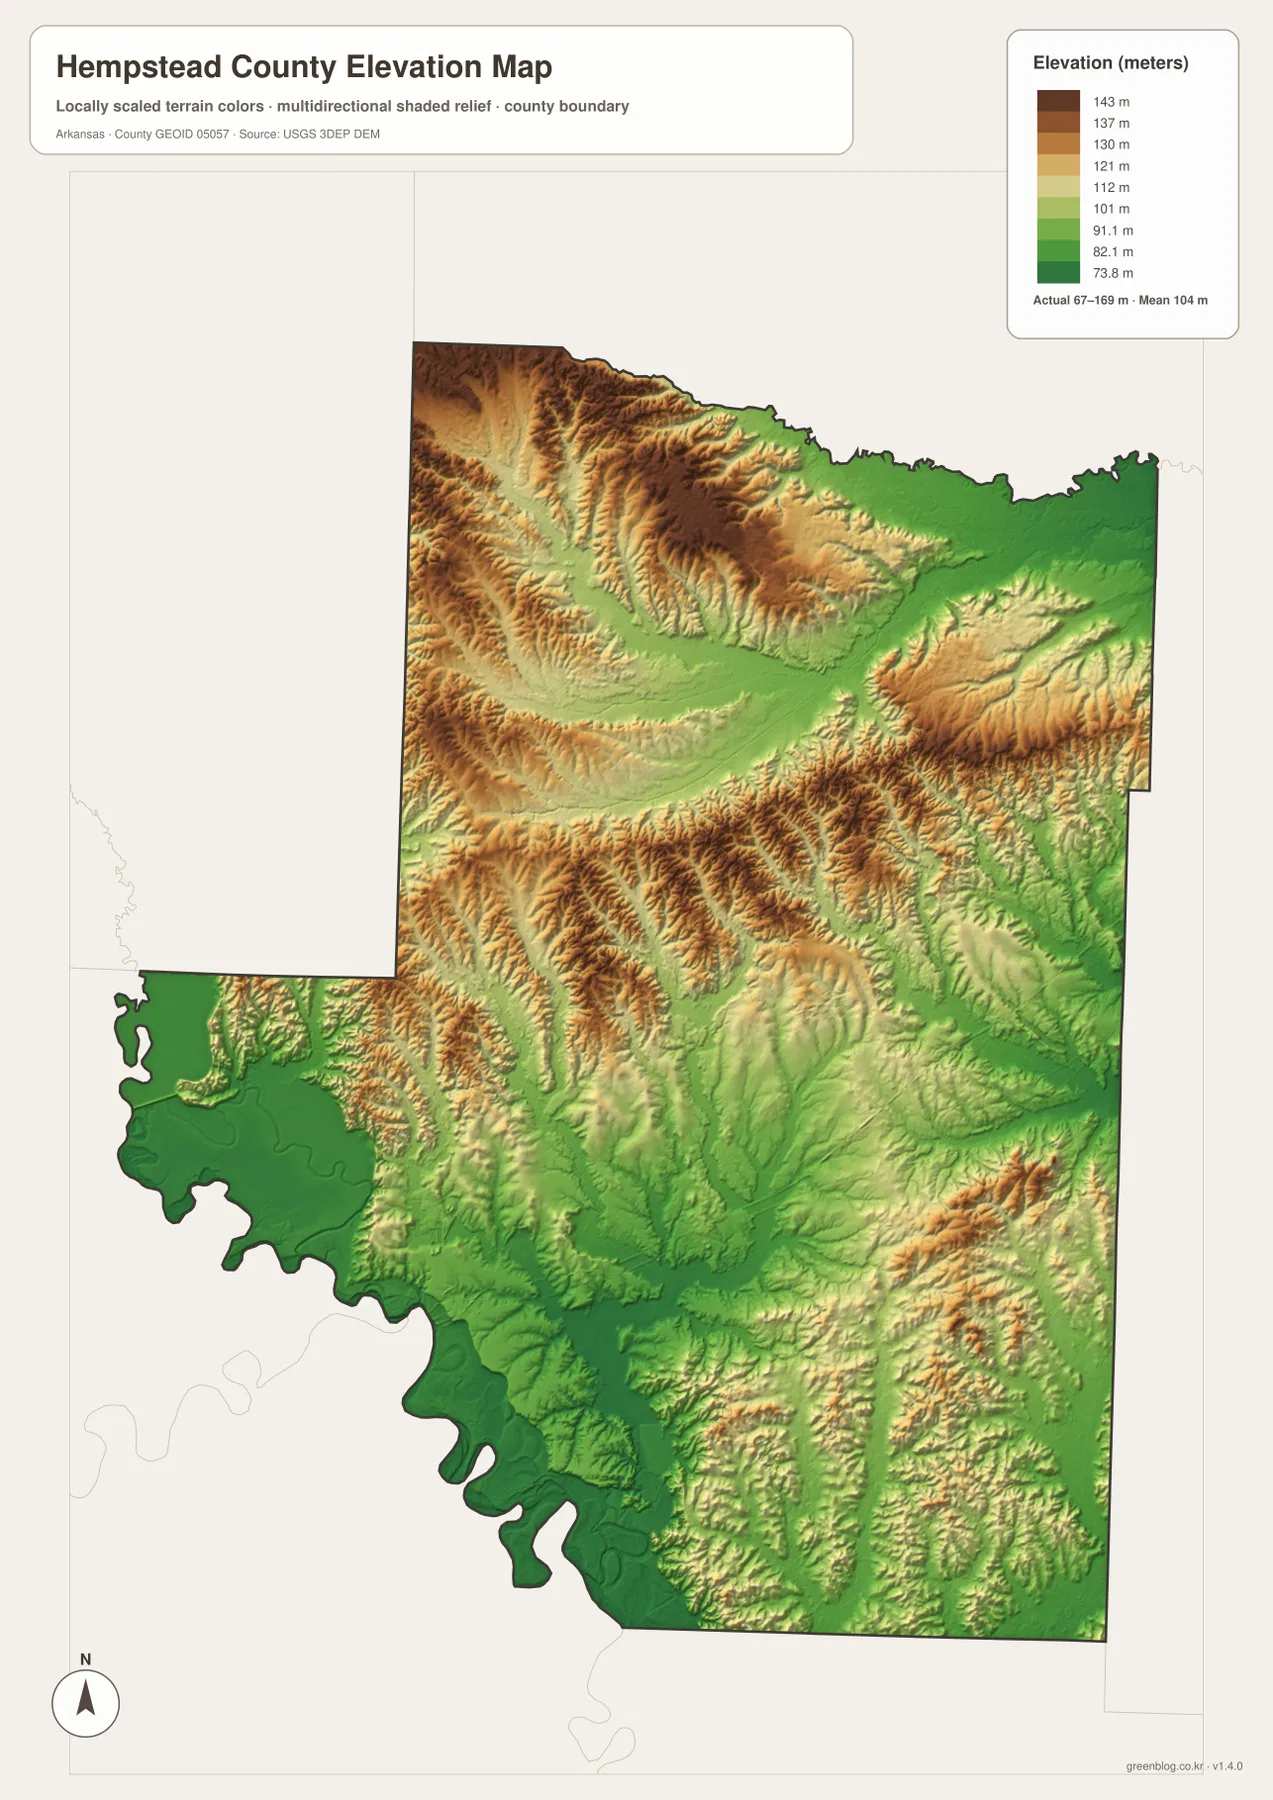
The northwestern section contains repeated high ridges separated by narrow lower valleys, and North Fork Ozan Creek follows one of those lower corridors. High terrain also extends across the north-central part of the county, although greener ground becomes more common near the northeastern boundary. Farther south, shorter ridges alternate with valleys that lead toward Bois D Arc Creek and the lower Little River country.
Comparing elevation with waterways helps explain why the named streams follow the routes they do. Green valleys on the elevation map often correspond with stream corridors on the water map, and the broadest low area lies along the Little River. This elevation view is still intended for county-scale comparison, not survey-grade measurement. Exact heights for parcels, roads, buildings, or construction work require original USGS 3D Elevation Program data or a professional survey.
Compare west and north from Hope to see the county’s strongest contrast
A practical way to use the four maps together is to start at Hope and move west. Following Route 67 toward Fulton, the road network becomes less concentrated and the landscape approaches the lower Little River zone. The water map adds more lakes and river bends, while the elevation map changes toward broad green lowlands. Looking at the same corridor in the road, water, and elevation views connects the map information without turning the page into a list of separate map types.
Looking north from Hope tells a different story. Washington appears first, with Blevins and McCaskill farther north, and the land becomes more strongly rolling. Toward Ozan and the northwestern side, North Fork Ozan Creek and many smaller tributaries occupy narrow valleys between higher ridges. Switching between the two directions makes the basic geography of Hempstead County clear: lower river country to the southwest and more dissected uplands across much of the north.
High-resolution JPG files for printing and close inspection
The WebP images in the article are optimized for quick page viewing. The download ZIP contains the same four maps as high-resolution JPG files, each measuring 2572 × 3638 pixels in portrait orientation. Use the general map for roads and communities, the city map for the ranked distribution of six major places, the terrain and water map for the Little River and named creeks, and the elevation map for comparing the northern uplands with the lower southwestern river area.
The JPG files are suitable for classroom reference, presentations, trip preparation, personal printing, and general orientation. They should not replace legal boundary records, parcel surveys, flood studies, engineering plans, or live navigation. When exact or current information is required, consult Census TIGER/Line boundaries, USGS hydrography, USGS elevation data, and the appropriate local or state source for the specific decision.
Frequently Asked Questions
Do the numbers 1 through 6 on the city map show distances?
No. They are ranking markers for the six major places shown on this map. Hope is ranked first, followed by Perrytown, Fulton, Blevins, Washington, and McNab. The numbers do not represent straight-line mileage or driving distance, so actual travel distance and time should be checked with a current road or navigation map.
Where does the Little River run through Hempstead County?
The Little River follows the southwestern side of the county in a series of broad bends. Fulton and McNab lie relatively close to this lower river area, and Beard Lake, Grassy Lake, Red Lake, and several other small lakes are shown nearby. The elevation map also shows this corridor as lower than much of the northern county.
Where is the highest terrain on the elevation map?
The highest terrain is concentrated across the northern and north-central uplands. The displayed countywide elevation range is about 67–169 meters with a mean near 104 meters. The southwestern Little River corridor is much lower, while North Fork Ozan Creek cuts through valleys between higher ridges in the northwest.
Map File Information
The ZIP contains the general county map, ranked city map, terrain and water map, and elevation map as high-resolution JPG files for printing or offline reference.
- File Type: ZIP containing 4 JPG files
Related Maps
Sources and references
- U.S. Census Bureau TIGER/Line Shapefiles – county boundary and road data
- USGS National Hydrography – rivers, streams, and waterbody data
- USGS 3D Elevation Program – elevation and terrain data
Green Map creates custom-edited map images using open geographic data sources such as geoBoundaries, Natural Earth, OpenStreetMap, and government open data.
These maps are edited visual materials, not raw data files, and are provided for education, documents, presentations, and graphic reference.