Eagle County is overwhelmingly covered by forest and shrubland in the 2025 summary. Forest accounts for 57.75% of the county and shrubland for 32.59%, while developed cover is only 2.54%. That small developed share is still easy to spot because it clusters in a narrow east–west band through the middle of the county instead of spreading evenly across the mountain landscape.
This page compares four views of the same county: current land cover, forest and farmland, impervious surface, and mapped land-cover differences from 1985 to 2025. The four original JPG maps are also available together in one ZIP near the end of the page for printing, reference, or side-by-side comparison.
Table of Contents
A narrow settled belt cuts through a county dominated by natural cover
The most useful way to begin reading Eagle County is to compare the central band with the much larger areas around it. The middle of the county contains the strongest concentration of developed pixels, while broad forest and shrubland areas occupy most of the land to the north and south. This contrast makes the developed pattern look more important on the map than its 2.54% countywide share might suggest.
Official Eagle County mapping helps orient that pattern. The county’s Open Space Plan shows I-70, U.S. 6, the Eagle River, and communities including Vail, Avon, Edwards, Eagle, and Gypsum along the same general east–west part of the county. The NLCD layer does not map roads, zoning, or development approvals, but its developed pixels occupy a similar geographic belt. That is a location comparison, not proof that any one road or river caused the mapped development.
Away from the central belt, the map changes quickly. Forest becomes especially extensive across the southern and eastern mountain areas, while shrubland is more prominent across the north and north-central portions. Pale barren and grassland areas break up the forest in several high, open zones, particularly toward the south. These broad differences are easier to understand after the reader stops treating the county as one uniform mountain block.
Land cover should also be separated from legal land use. A forest pixel does not identify ownership, timber policy, or a specific tree type. A developed pixel does not tell whether a parcel is residential, commercial, public, or privately owned. Annual NLCD classifies the surface that is detected in each raster cell, so the maps are best used for county-scale pattern comparison rather than parcel-level decisions.
What the 2025 land-cover classes reveal across Eagle County
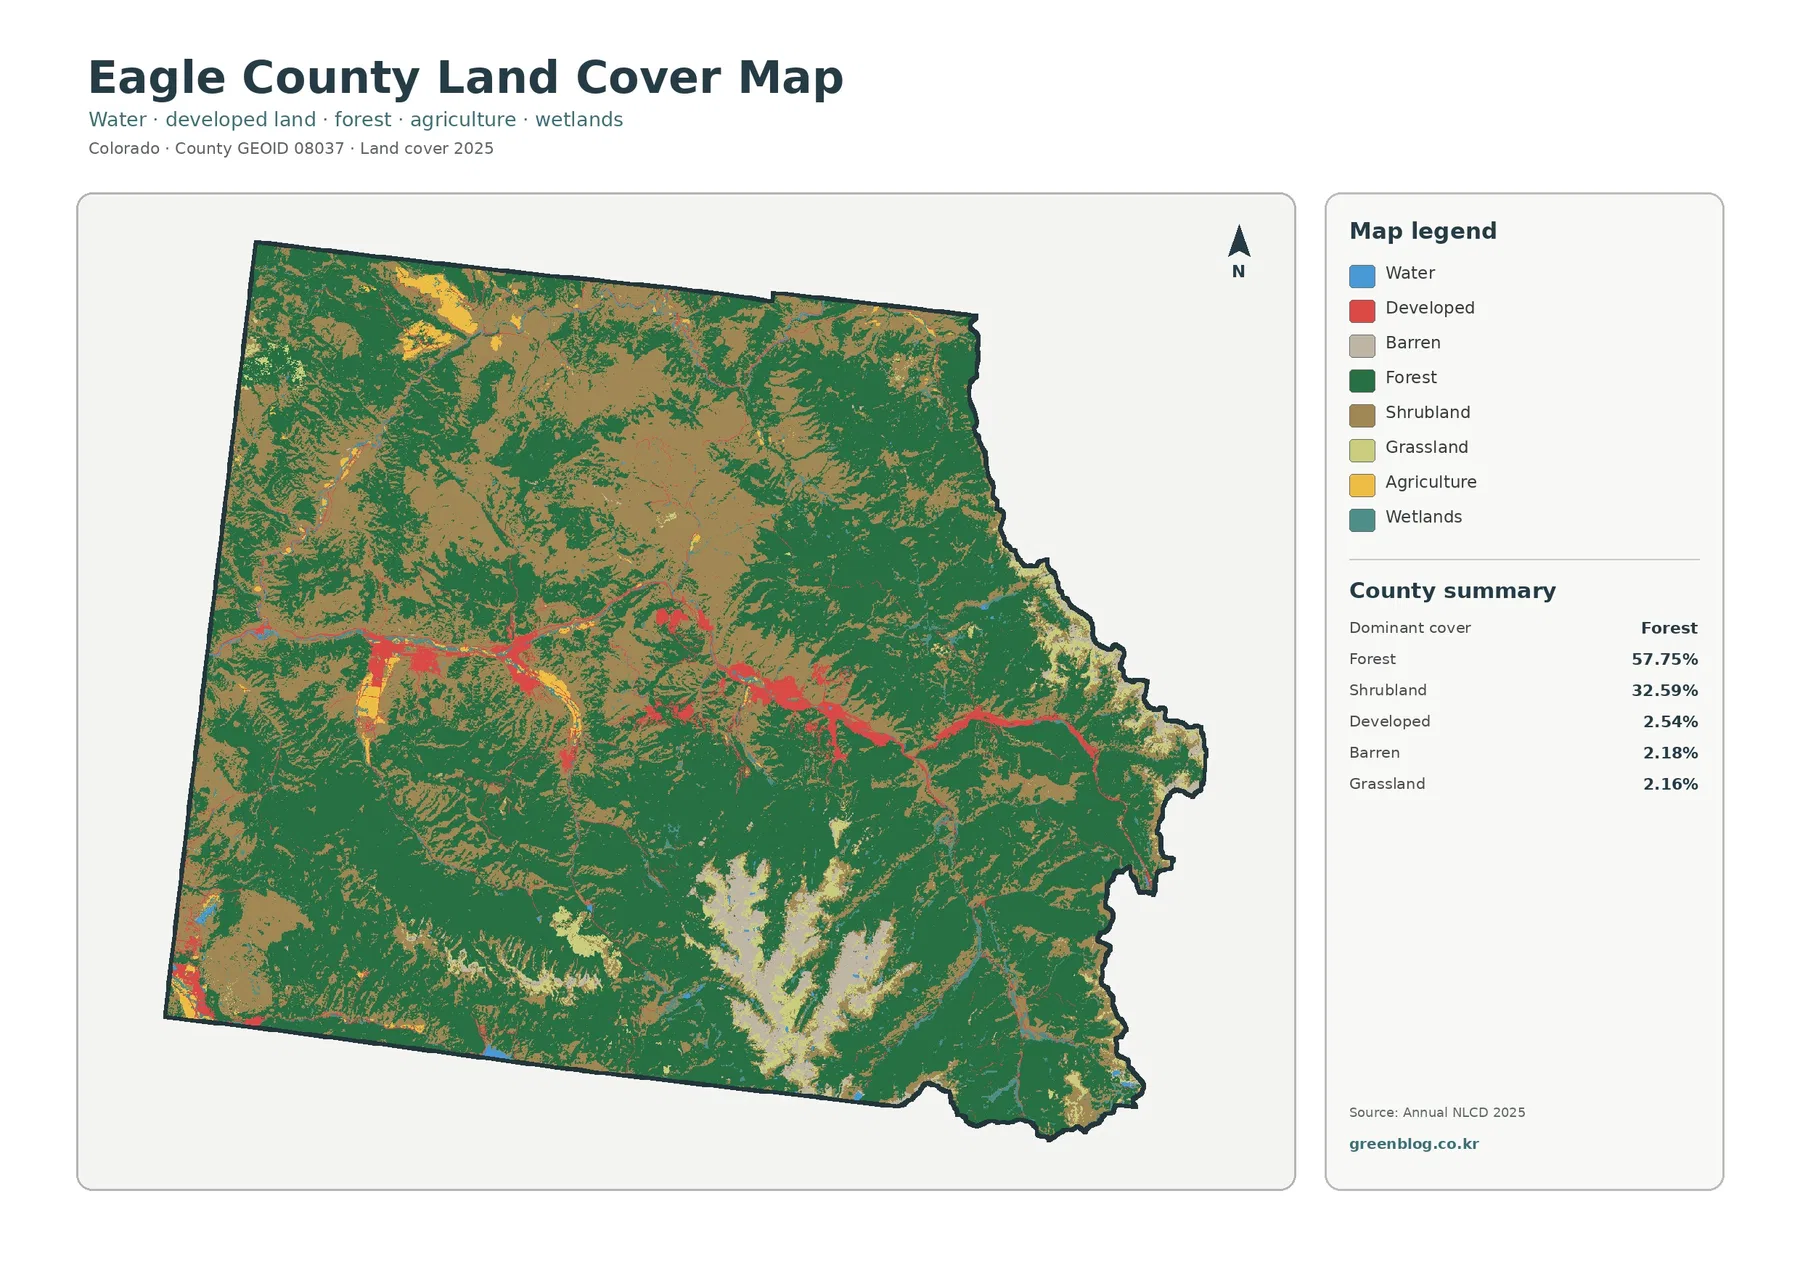
Forest is the dominant class at 57.75%, and its dark green color covers large connected areas through the south, east, and many slopes away from the central developed zone. Shrubland is the clear second-place class at 32.59%. Its brown-tan color is particularly broad across the northern half and also appears between forested areas elsewhere. Together, those two classes explain why most of the county reads as natural cover even before the smaller classes are considered.
The developed class forms a very different shape. Rather than appearing as one large urban block, red pixels stretch through the middle of the county and expand into several larger clusters along the route. Thin extensions branch away from the main band in a few places, but large developed surfaces are uncommon outside it. The map therefore shows concentration more clearly than the countywide percentage alone.
Barren cover represents 2.18% and grassland 2.16%. Both are small in the statistical summary, yet pale open areas become noticeable in parts of the southern high country where the continuous forest color breaks apart. Agriculture is only 0.91% and appears mainly as limited yellow patches in the western and northwestern portions and near parts of the central band. It is a localized class rather than a countywide background.
Wetlands account for 1.64% and water for 0.22%. Their colors appear in small, narrow, or scattered features, so they can be hard to see in a reduced preview. Those classes are useful for broad landscape context, but the mapped pixels are not legal wetland boundaries or surveyed stream edges. A project that requires exact jurisdictional boundaries needs a different source.
Impervious surfaces sharpen the difference between the central corridor and the mountains
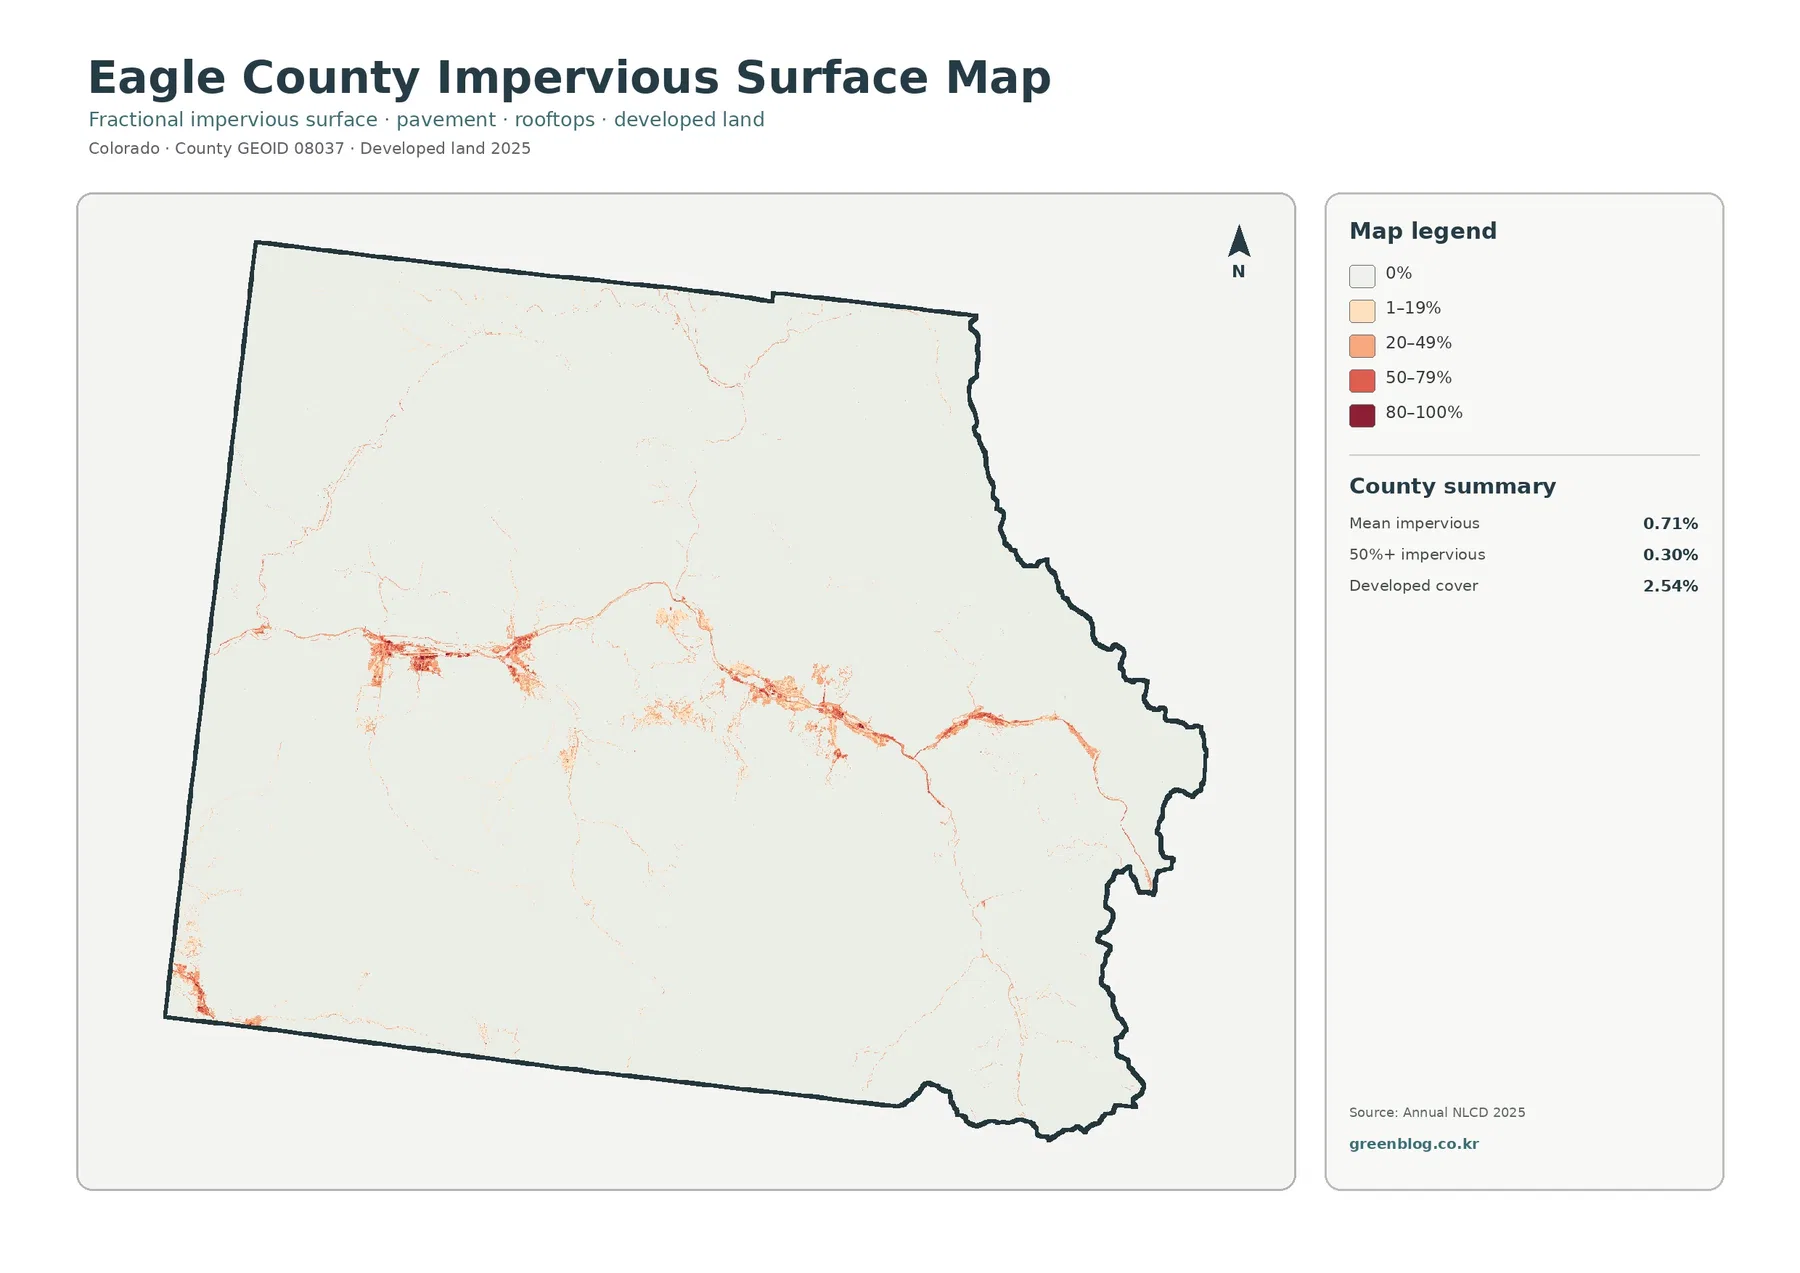
The impervious map removes most land-cover categories and focuses on hard surfaces such as pavement and rooftops. Eagle County’s mean imperviousness is 0.71%, and only 0.30% of the county is mapped in cells that are at least 50% impervious. Most of the county is therefore almost white on this map, which makes the higher values in the central belt stand out immediately.
Orange and red pixels form lines and compact patches through the middle of the county. Several of the darker concentrations correspond geographically with the same general zone where the land-cover map shows developed classes. The two layers are related but should not be treated as duplicates: land cover assigns a categorical surface class, while fractional imperviousness estimates how much of a cell is covered by hard material.
This distinction explains why developed cover is 2.54% while mean imperviousness is much lower. A developed land-cover cell can still include vegetation, exposed soil, or other permeable surfaces. Conversely, a road can create a thin linear impervious feature without turning a large surrounding area into a high-impervious block. Reading both maps together gives a more realistic sense of the county’s built footprint.
The county average is useful, but it can hide local concentration. Someone looking only at 0.71% might imagine that hard surfaces are nearly absent everywhere. The map shows instead that they are scarce across most mountain areas and concentrated in a small number of settled and transportation locations. A county-scale statistic and a location map answer different parts of the same question.
Forest and farmland become easier to compare after the legend is simplified
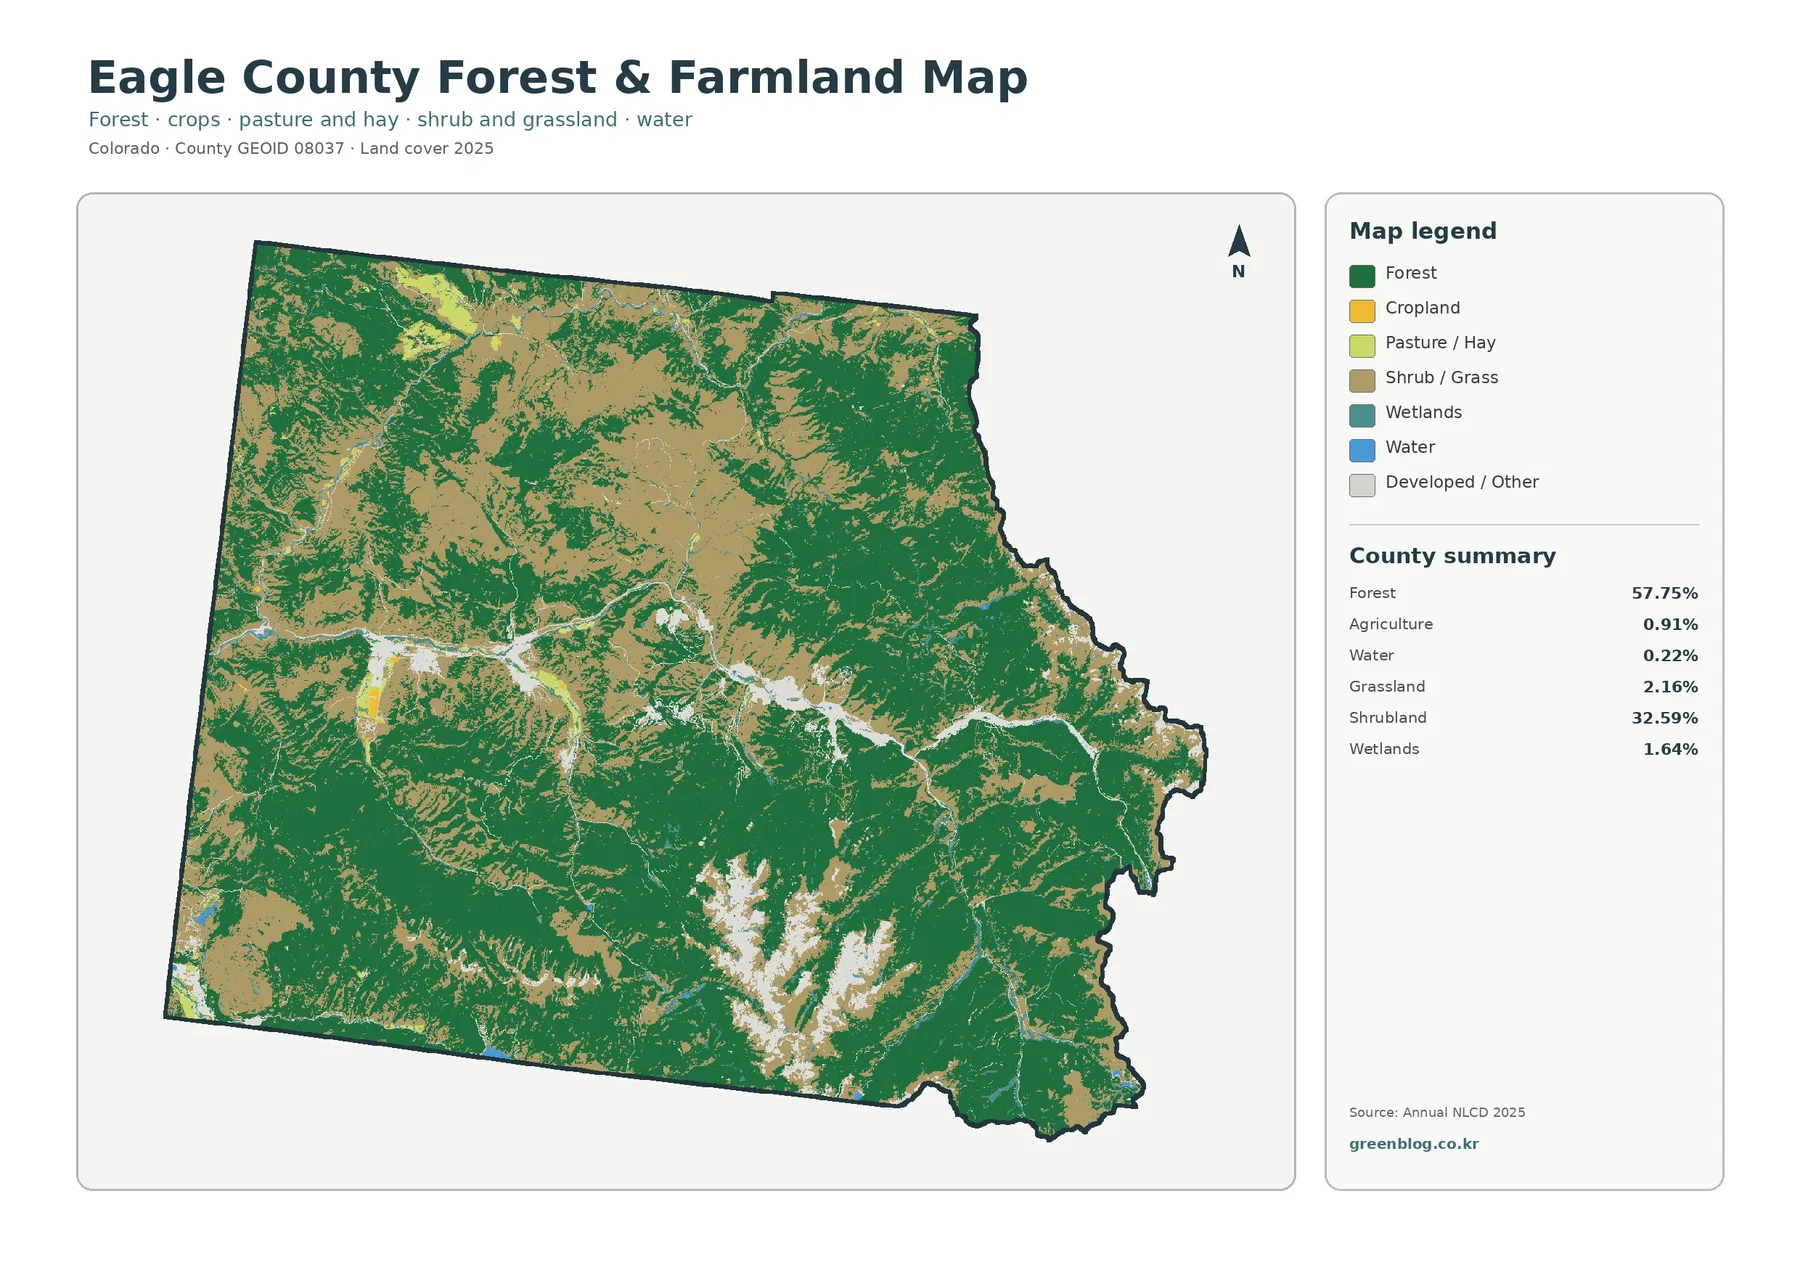
The forest-and-farmland version is helpful when the full land-cover legend feels too busy. Forest remains dark green and still covers 57.75% of Eagle County. Shrub and grass are shown as a broad open-cover group, allowing the extensive northern and north-central nonforest areas to stand apart more clearly from the forested mountain sections.
Agricultural cover totals just 0.91%. Yellow cropland and light pasture or hay colors appear in relatively small, localized patches rather than forming a continuous agricultural plain. The western side contains some of the easiest agricultural patches to see, with additional small areas closer to the central county. Their visibility in a few places should not be mistaken for a large countywide share.
This map is also useful for avoiding a common category mistake. An agricultural-looking pixel does not identify a farm parcel, crop ownership, irrigation right, or zoning designation. Likewise, shrub and grass cover may occur on land that has many different legal uses. The layer describes surface cover, not the complete human use of the land.
Eagle County’s official Open Space Plan provides a separate local context for conservation lands and projects, including locations along the Eagle River and elsewhere in the county. That plan should not be read as an NLCD legend, and the NLCD map should not be read as a conservation-ownership map. Used together, they help distinguish what the surface looked like in the 2025 classification from how local open-space resources are managed or protected.
The 1985–2025 comparison shows several kinds of change, not one single trend
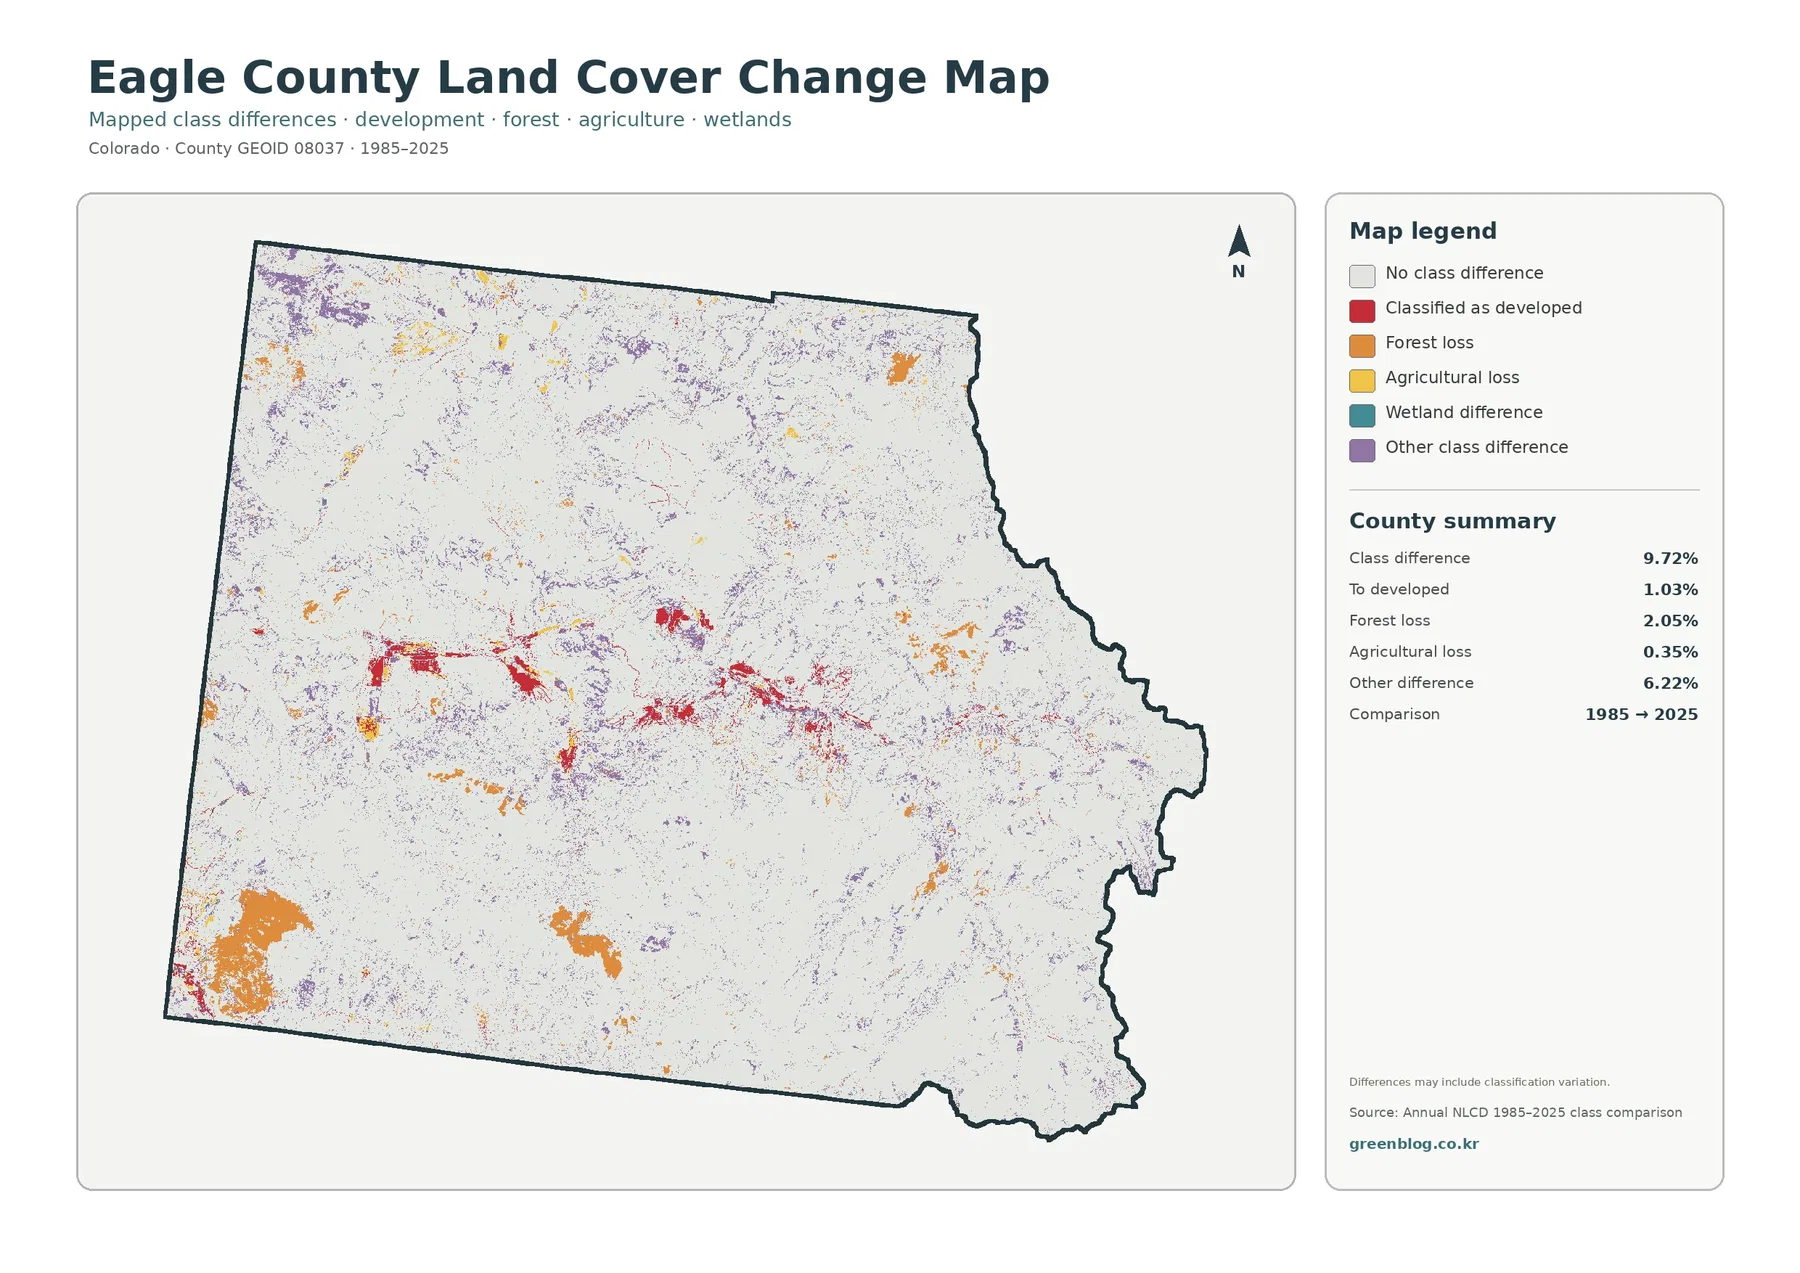
The change summary reports a class difference across 9.72% of Eagle County between 1985 and 2025. Of that total, 1.03% is mapped as conversion to developed, 2.05% as forest loss, 0.35% as agricultural loss, and 6.22% as other class difference. Most of the map remains in the no-class-difference background, while colored areas range from compact patches to fine scattered pixels.
Red conversion-to-developed pixels are most conspicuous in the same central part of the county where current developed cover and higher impervious values cluster. Some red areas are compact, while others form narrow connected traces. Comparing the change map with the 2025 land-cover map helps separate two questions: where development is mapped now and where the class changed to developed over the long comparison period.
Forest-loss pixels have a different distribution. Orange patches occur in several parts of the county, including a large area in the southwest and smaller patches in northern, central, and eastern locations. The 2.05% figure tells how much area falls into that mapped change category, but the map does not identify a cause. Fire, harvest, disturbance, development, and classification variability cannot be separated from this layer alone.
The largest reported change category is “other difference” at 6.22%. Purple pixels are scattered widely and often form small, irregular clusters. The map itself warns that differences can include classification variation, which is important when interpreting fine speckled patterns. Broad repeated patches deserve attention first; small isolated cells should be treated more cautiously unless another source confirms what happened on the ground.
A practical way to compare all four maps without mixing their meanings
Start with one reference location rather than scanning the maps randomly. The central Eagle River–I-70 area is useful because it contains the strongest developed pattern. On the current land-cover map, find the red developed band. Then move to the impervious map to see which parts of that band contain the highest share of hard surface. Finally, check the change map for red areas classified as conversion to developed between 1985 and 2025.
A forested mountain area creates a different comparison. The general map shows whether the current cover is primarily forest, shrubland, grassland, or barren. The simplified forest-and-farmland map makes the forest-versus-open-cover boundary easier to follow. On the impervious map, the same mountain area is usually very light. The change layer can then reveal whether the 1985 and 2025 classes differ even though the current surface is not developed.
The northern portion is especially useful for separating shrubland from forest. Large tan areas on the full land-cover map become part of the broader shrub-and-grass group on the simplified map. The southern high country is better for studying pale barren or grassland openings within a mostly forested region. Choosing a different reference area for each question prevents the central development belt from dominating every interpretation of Eagle County.
These comparisons also show why one layer cannot replace the others. Current land cover describes the dominant 2025 surface class. The forest-and-farmland map groups those classes for easier thematic comparison. Imperviousness measures hard surface fraction. The change layer compares classifications across two years. Combining them is useful only when their definitions remain separate.
Why 30-meter raster cells and small percentages need careful reading
Annual NLCD Collection 1.2 is produced as 30-meter raster data. Each cell summarizes a small square of the landscape rather than tracing a surveyed parcel boundary. A cell can contain a mixture of trees, soil, pavement, buildings, grass, or water, yet the land-cover product still assigns a predominant class. Fractional imperviousness handles one part of that mixture differently by estimating the hard-surface share.
That generalization matters for Eagle County because several reported classes are small. Water is 0.22%, agriculture 0.91%, and the area with at least 50% imperviousness is 0.30%. A handful of narrow or clustered features can look larger when zoomed in and disappear when the map is reduced. Percentages and mapped positions should therefore be read together.
The date matters as well. The current land-cover and impervious maps represent 2025, while the change map compares 1985 with 2025. New construction, vegetation recovery, fire effects, or other changes after 2025 are outside these maps. For present-day site decisions, use the maps as background and confirm conditions with newer local information.
Finally, none of the four maps is a zoning map, cadastral survey, wetland determination, or ownership layer. The Eagle County Land Use Regulations and other local planning documents address legal land use separately. Keeping those purposes apart prevents a common mistake: treating a surface classification as permission, restriction, or parcel status.
Which Eagle County map is the best starting point?
Use the general land-cover map first when you need a countywide overview. It places the 57.75% forest share, 32.59% shrubland share, narrow developed belt, southern open high-country patches, and small water or agricultural features in one frame. It is the easiest page to use when a reader has not yet learned the county’s basic pattern.
Choose the forest-and-farmland map when the main question concerns natural cover and the limited agricultural areas. Its simplified colors reduce distraction and make the northern shrub-and-grass areas easier to compare with the more forested south and east. For built surfaces, the impervious map is more informative than the general developed class because it shows intensity instead of only category.
The change map is most useful when time is part of the question. It should usually be paired with the 2025 map so viewers do not mistake “forest loss” for present forest cover or “to developed” for every current developed pixel. A side-by-side layout is often clearer than placing all four maps on one crowded page.
For teaching, presentations, watershed discussions, or broad planning context, select the pair that matches the question and keep the legend visible. The maps share the same county boundary, which makes it easy to compare the central corridor, northern shrubland, southern mountain cover, and isolated change patches without changing geographic frames.
Download the four Eagle County JPG maps
The downloadable ZIP contains four JPG files: the general land-cover map, forest and farmland map, impervious/developed-land map, and 1985–2025 land-cover change map. The WebP images in the article are intended for quick web viewing, while the downloadable files provide the original JPG versions packaged together.
Keep the map title, year, and legend with each image when reusing it. The general developed class and fractional imperviousness do not measure the same thing, and the change map does not represent current cover by itself. Preserving those labels makes comparisons easier to understand in reports, lessons, or presentation slides.
These maps work well for county-scale reference, environmental education, broad landscape comparison, and illustrating where mapped change is concentrated. They are not substitutes for a parcel survey, property record, zoning determination, site-specific wetland review, or current engineering map. More detailed decisions should use the appropriate official source.
Frequently Asked Questions
What is the largest land-cover class in Eagle County?
Forest is the largest 2025 class at 57.75%, followed by shrubland at 32.59%. Forest is especially extensive across southern and eastern mountain areas, while shrubland is more prominent across much of the north and north-central part of the county.
Why does development look prominent if it covers only 2.54% of the county?
Developed pixels are concentrated in a narrow east–west zone through the middle of Eagle County rather than spread evenly across the landscape. Concentration makes the red class visually prominent even though the countywide share is small. The impervious map shows a similar local concentration of harder surfaces.
Does the 9.72% class-difference figure mean that all of that land physically changed?
No. The figure represents cells whose mapped classes differ between 1985 and 2025. Real surface change can be part of that result, but classification variation can also contribute. The change map is useful for locating differences, while the cause of a specific patch requires additional evidence.
Map File Information
The download ZIP contains four original Eagle County land-cover JPG maps.
- Included Files: Use only the versions confirmed in the article and supplied images
- File Type: Use the confirmed download contents
- Intended Use: Printing, education, presentations, and map-based projects
Related Maps
- Adams County Colorado Land Cover Map
- Alamosa County Colorado Land Cover Map
- Arapahoe County Colorado Land Cover Map
Sources and References
- MRLC Annual NLCD Data – official access point for Annual NLCD products and data.
- USGS Annual NLCD Collection 1.2 Land Cover – documentation for the Annual NLCD land-cover product, including 2025 coverage and 30-meter raster resolution.
- Eagle County Open Space Plan – official county context for the Eagle River, major transportation routes, communities, and conservation projects.
- U.S. Census Bureau TIGER/Line Shapefiles – official geographic boundary reference.
Green Map creates custom-edited map images using open geographic data sources such as geoBoundaries, Natural Earth, OpenStreetMap, and government open data.
These maps are edited visual materials, not raw data files, and are provided for education, documents, presentations, and graphic reference.