Floyd County in eastern Kentucky is a long, rugged county where towns, roads, and streams occupy narrow valleys between closely spaced ridges. Prestonsburg is the clearest northern reference point, while Allen, Martin, Wayland, and Wheelwright extend the settlement pattern southward through the mountains. This page explains the county boundary, road network, city distribution, waterways, and the mapped elevation range of about 182 to 702 meters. The four high-resolution JPG map files shown here are also available together as a downloadable ZIP.
A useful first orientation is to pair Prestonsburg with the Levisa Fork. From that northern center, the main valley system continues past Allen and Martin, while smaller creeks lead toward communities tucked into side valleys. Dewey Lake gives the northern part of the county another strong landmark, and the Beaver Creek branches help organize the south. Reading those features together is more informative than treating Floyd County as a simple rectangle with towns scattered evenly across it.
Table of Contents
Prestonsburg anchors the northern road network along the Levisa Fork
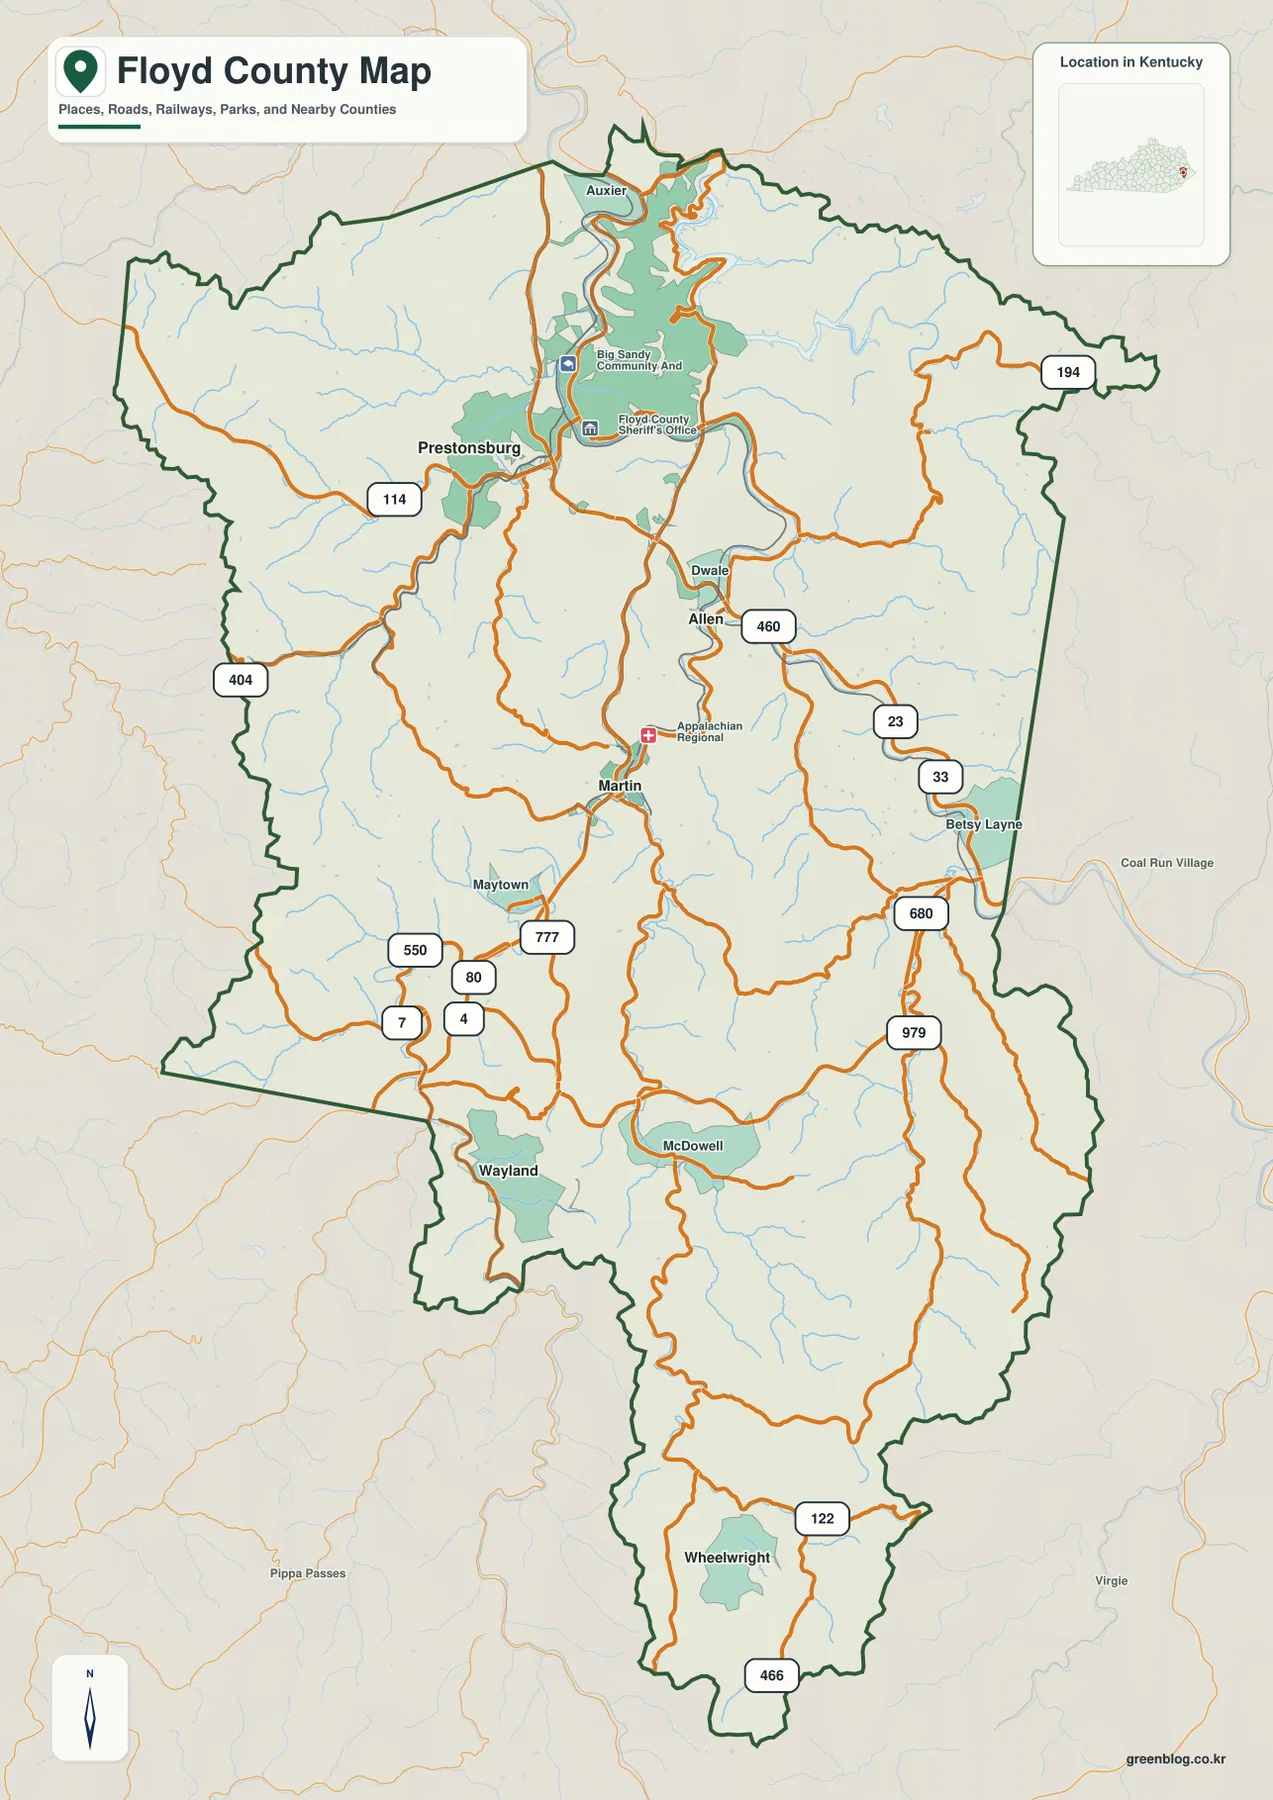
The general county map places Prestonsburg near the upper-central part of Floyd County, where several roads and developed areas gather in a relatively narrow valley. KY 114 approaches from the west, while U.S. 23 and U.S. 460 appear among the major routes in the Allen and Betsy Layne corridor to the east and southeast. Farther south, KY 80, 7, 122, 466, and other numbered routes weave through mountain gaps rather than following a simple grid.
Moving south from Prestonsburg, the map shows Dwale and Allen before reaching Martin near the county’s middle. Maytown and Wayland sit farther southwest, while Wheelwright occupies the narrow southern extension. McDowell appears in the south-central area and Betsy Layne is marked on the eastern side. These places are not spread across broad open land; most sit where a valley provides enough room for roads, homes, and services.
The northern edge also includes Auxier, and KY 194 reaches toward the northeastern boundary. On the east, KY 680 and 979 help identify the side valleys, while KY 404 and 114 provide western reference routes. When a place name is unfamiliar, combining the town label with a road number is often the quickest way to locate it because the county boundary is irregular and many routes curve repeatedly around ridge systems.
Five city labels form a long north-to-south chain from Prestonsburg to Wheelwright
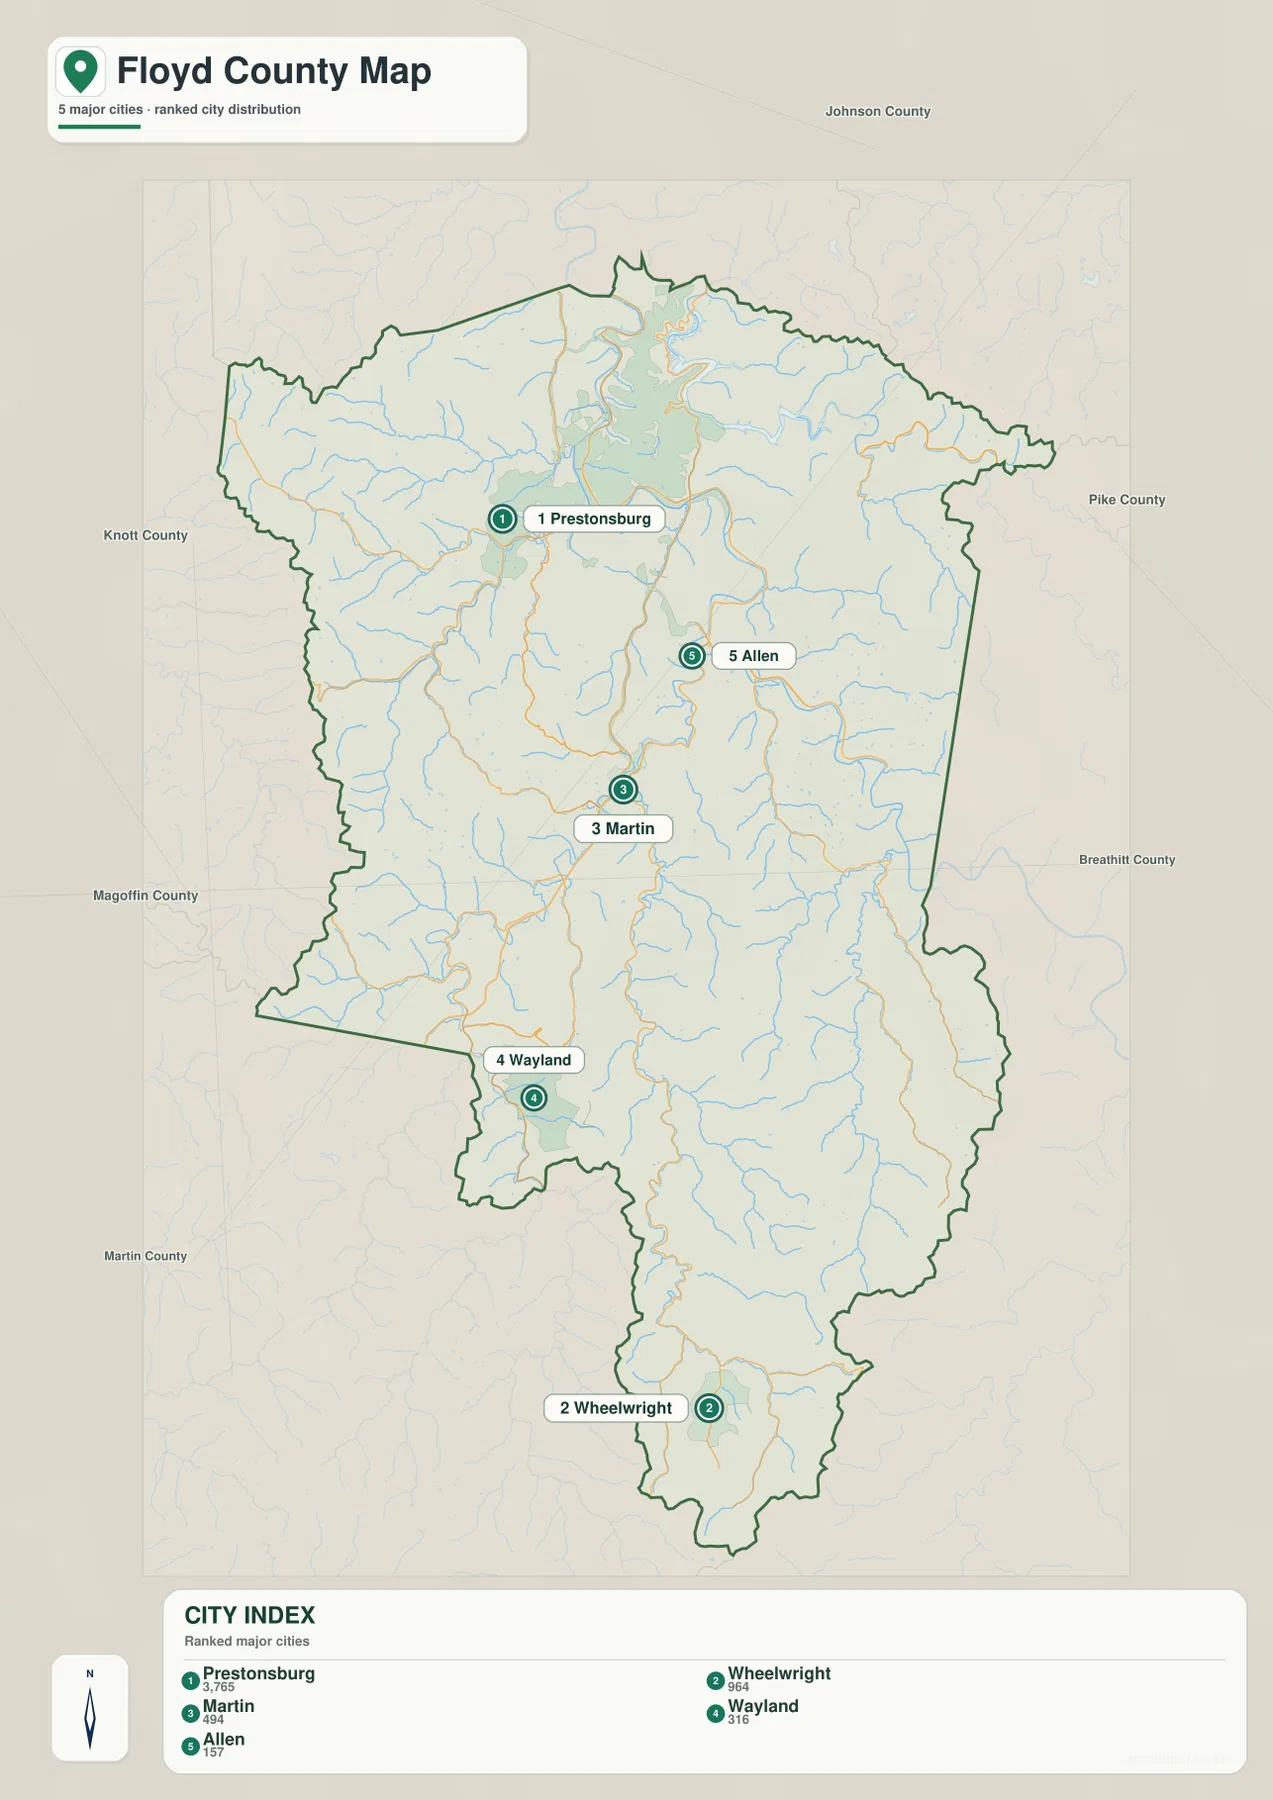
The city-index map strips away many secondary labels and focuses on Prestonsburg, Wheelwright, Martin, Wayland, and Allen. Its index shows reference values of 3,765 for Prestonsburg, 964 for Wheelwright, 494 for Martin, 316 for Wayland, and 157 for Allen. Those figures are best treated as values attached to this map package rather than as a substitute for the latest official population estimate; current demographic work should use Census data directly.
Their placement is more important than the ranking. Prestonsburg sits in the northern half, Allen is southeast of it, and Martin occupies a central valley position. Wayland shifts southwest, then Wheelwright appears near the bottom of the county. The sequence makes the unusual shape of Floyd County easy to understand: the populated places follow workable valley corridors through a mountainous landscape rather than forming a compact cluster around one central plain.
This simplified map is useful when a presentation or lesson needs only the main city names without dozens of road and creek labels. The general map should be used alongside it when smaller communities such as Auxier, McDowell, Betsy Layne, or Maytown matter. Together, the two maps separate two different questions: where the principal city labels are located and how roads actually connect those places through the terrain.
Dewey Lake and the Levisa Fork organize the northern water network
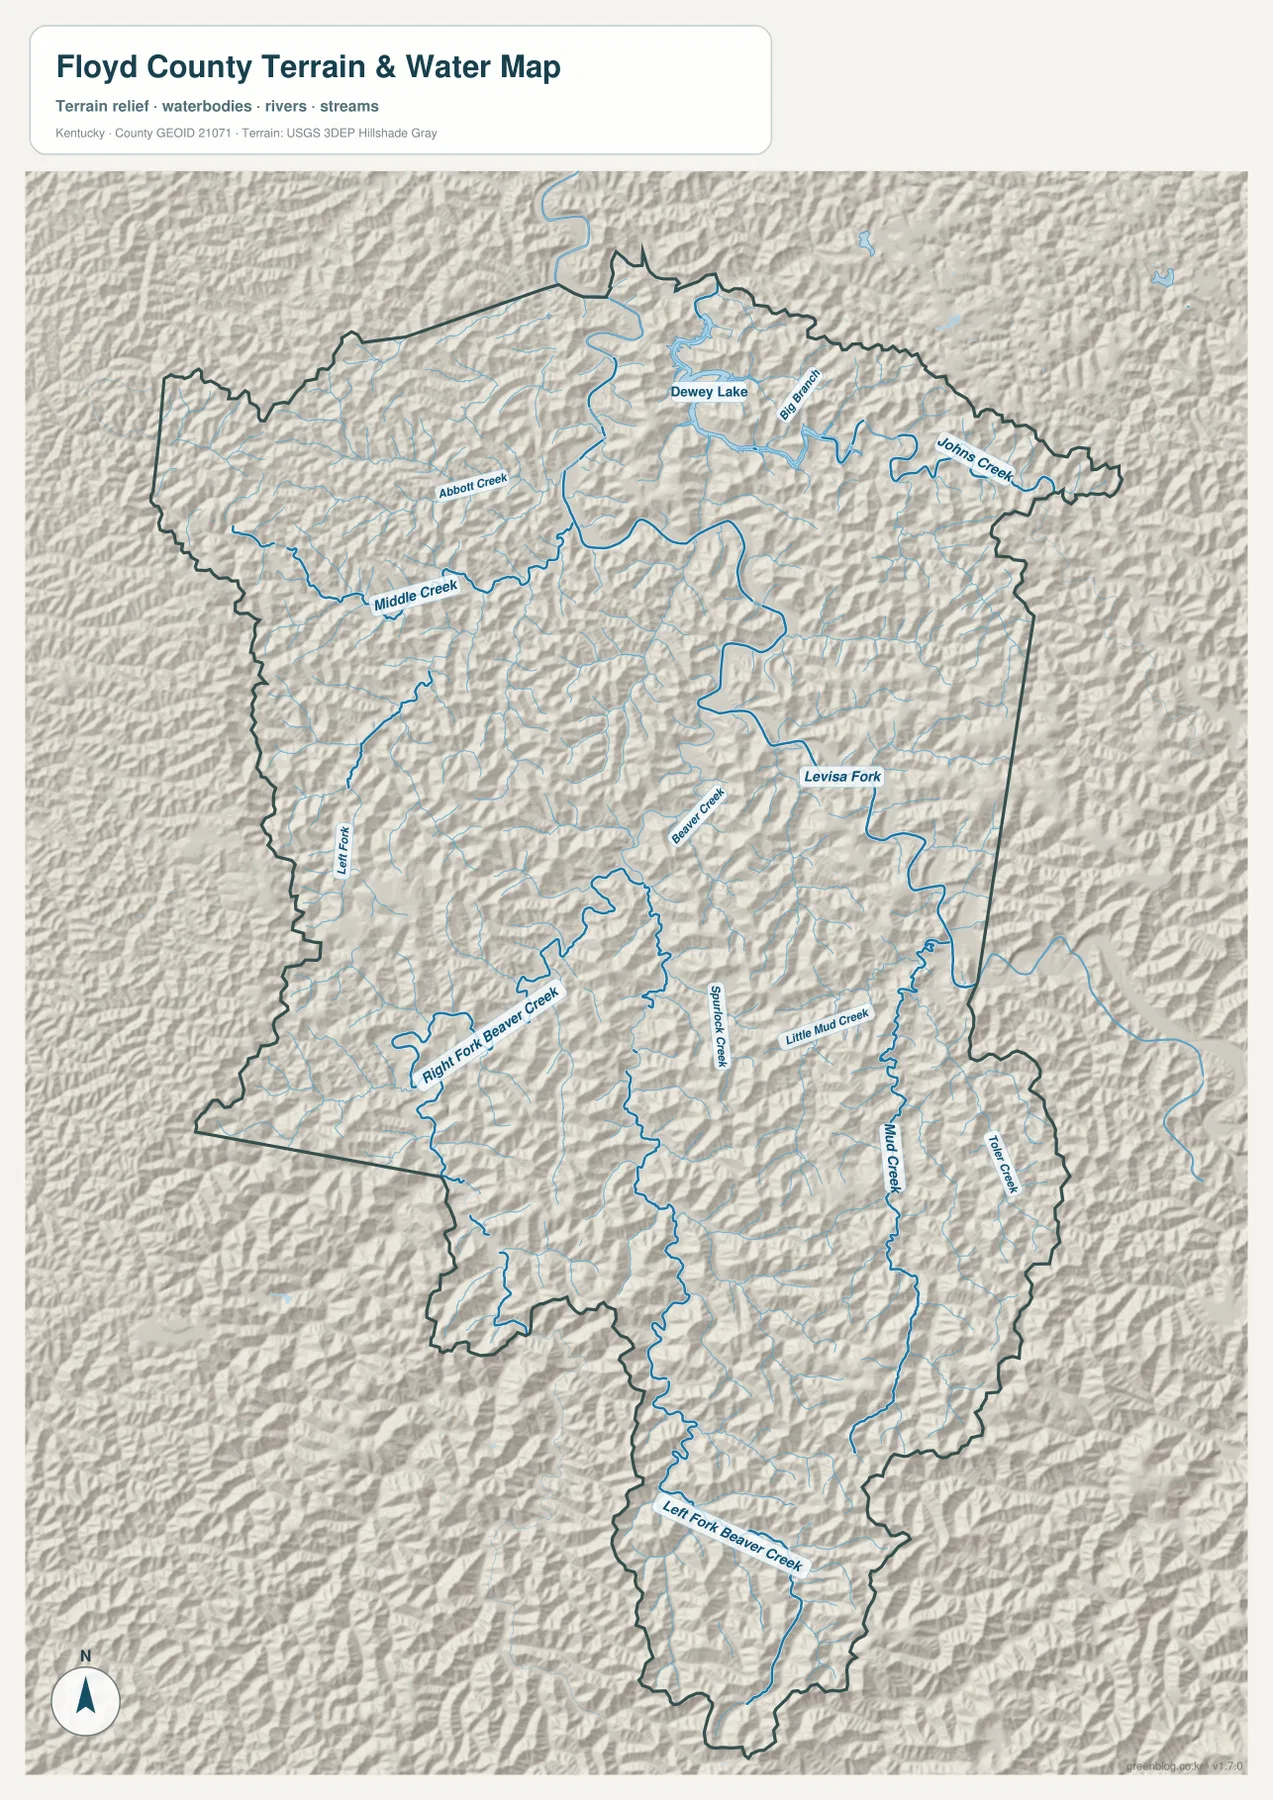
Dewey Lake is the most prominent named water body in the northern portion of the terrain-and-water map. South and west of the lake, the Levisa Fork bends through the county’s main valley system. Middle Creek approaches from the west, Abbott Creek is labeled farther north, and Johns Creek enters from the northeast. These names are especially useful around Prestonsburg because watercourses often provide clearer rural orientation than street-like grid directions.
The stream pattern becomes even more intricate in the middle and southern portions of the county. Right Fork Beaver Creek and Left Fork Beaver Creek define major valleys on the southwest and south, while Spurlock Creek, Little Mud Creek, Mud Creek, and Toler Creek occupy additional narrow corridors. Instead of one broad river plain, the map shows a branching network of creeks separated by steep ridges. Many local roads follow the same low corridors, which explains the close relationship between the water map and the road map.
Dewey Lake also has a strong landscape context. Kentucky wildlife officials describe the surrounding public land as extremely steep, rugged, and mostly forested, which matches the tightly folded shaded relief visible on this map. The map is intended for geographic reference, not for flood-risk decisions, live water levels, water quality, or navigation. For those purposes, current agency data should be used, but for identifying which valley a named stream occupies, this version provides useful countywide context.
Elevation rises from 182 m valley floors to 702 m southern ridges
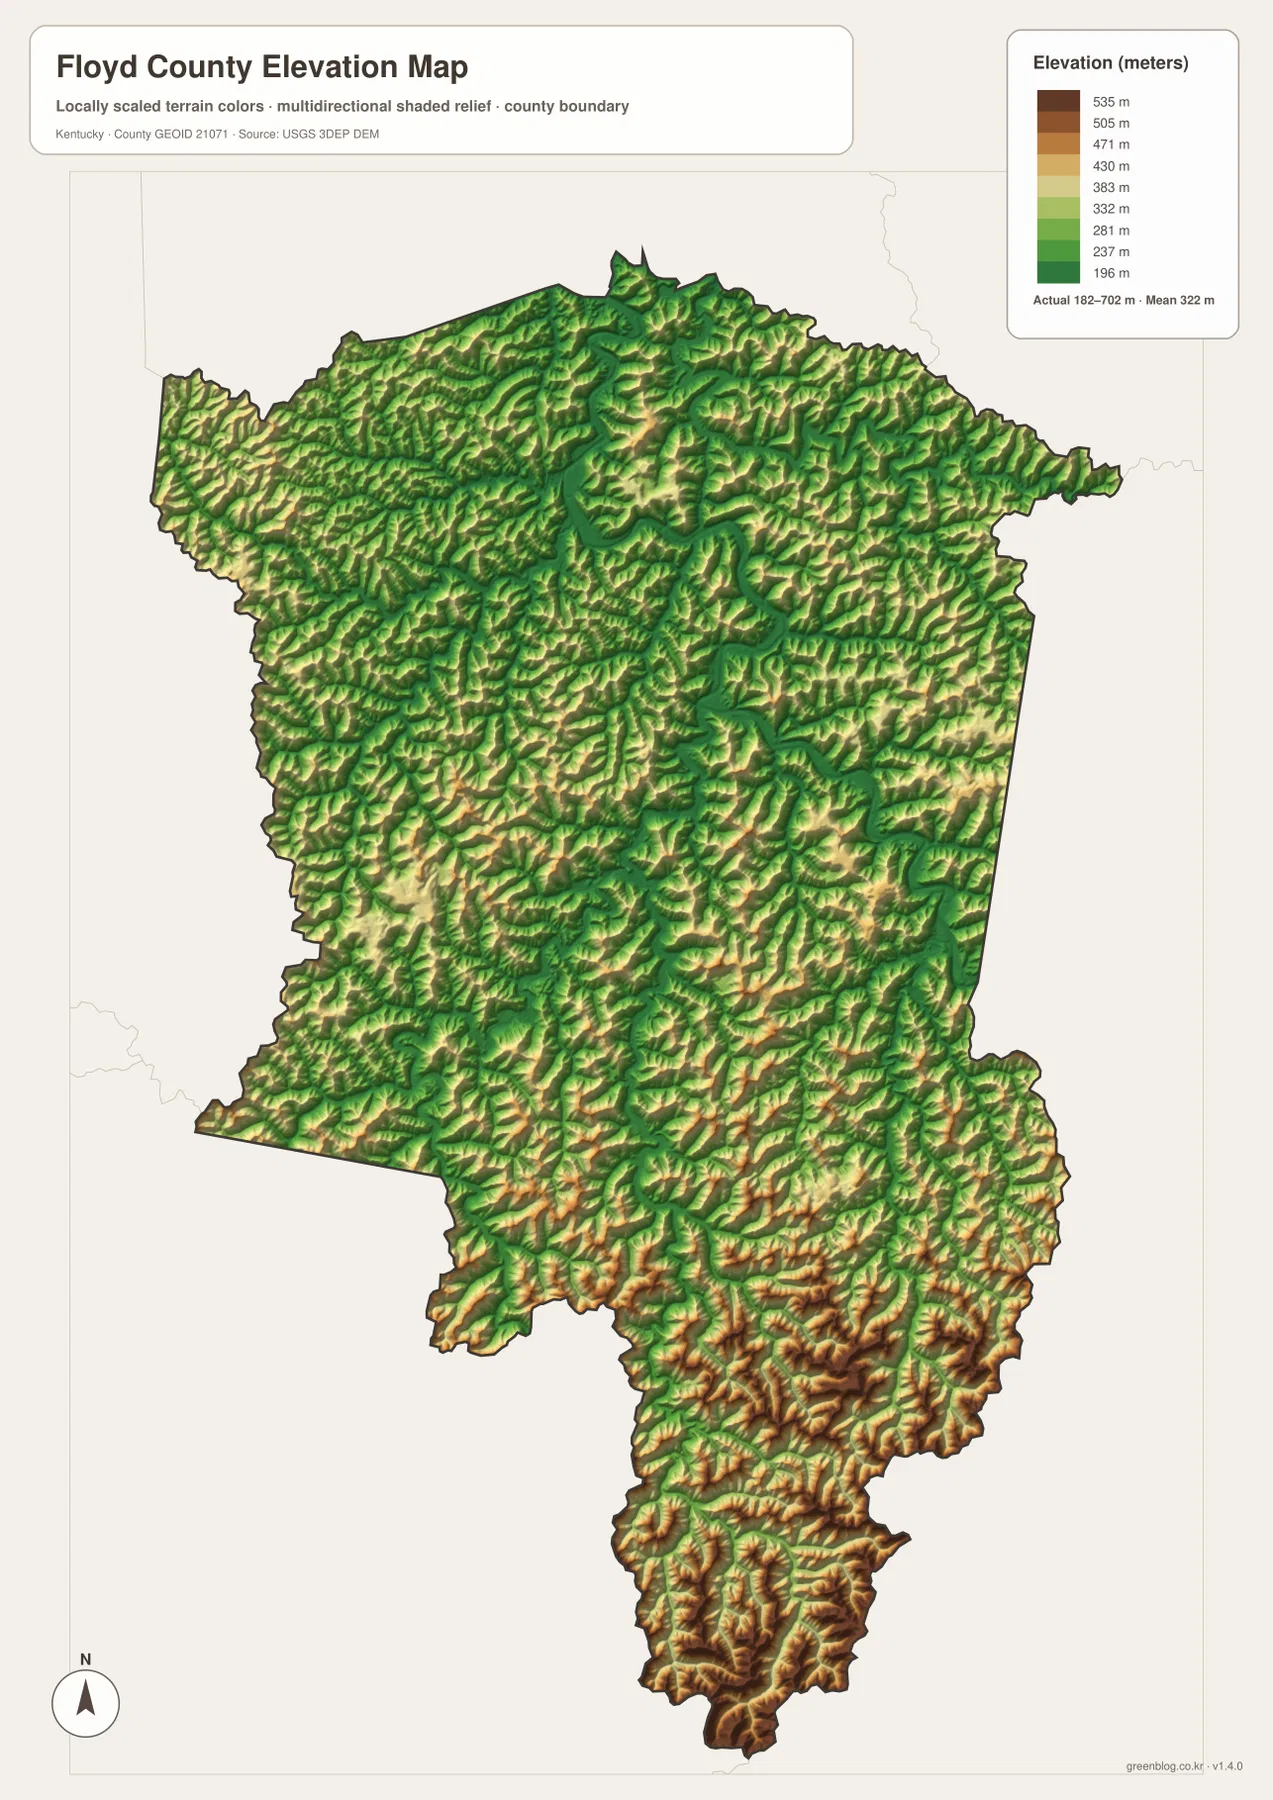
The elevation map reports an actual range of approximately 182 to 702 meters and a countywide mean of 322 meters. Green tones follow the main river and creek valleys through the center and north, including the corridor that links Prestonsburg toward Martin. As the map moves south, yellow and brown ridge tops become much more frequent, showing a rapid increase in local relief.
The strongest high-elevation pattern appears around the southern and southeastern parts of Floyd County, including the terrain near Wayland and Wheelwright. Narrow low valleys cut between ridge systems that rise sharply on both sides. The north is also rugged, but the Levisa Fork and Dewey Lake area contains longer connected low corridors. Along the western side, alternating ridges and small tributary hollows create a repeated high-low pattern rather than one continuous slope.
The 322-meter mean should not be read as though most of the county sits close to one height. The important fact is the local contrast between valley bottoms near the low end of the scale and ridge crests that approach 700 meters. This is a generalized elevation surface designed for county-scale comparison, not a survey or engineering product. It is well suited to explaining why settlement is concentrated in valleys and why road routes often bend around high ground.
The road curves make more sense when the valleys and ridges are viewed together
Floyd County’s road network can look complicated until the water and elevation maps are placed beside the general map. U.S. 23 and many state routes repeatedly change direction because the usable low ground follows river bends and tributary valleys. A straight line between two nearby labels may cross several ridges, while the practical road route stays in a valley and travels a longer distance. That is why road numbers, creek names, and terrain are best read as one connected system here.
Around Prestonsburg, Allen, and Martin, the main valley provides enough continuity that the road pattern is relatively easy to follow. Farther south near McDowell and Wheelwright, the landscape divides into smaller hollows, so a water name such as Right Fork Beaver Creek, Mud Creek, or Spurlock Creek can be a better orientation clue than a compass direction alone. The map also shows why communities often appear as narrow strings of development instead of broad circles around a center.
This relationship is useful in classroom or local-reference material because it turns a generic statement such as “Floyd County is mountainous” into something visible. The lower green corridors contain many of the named communities and routes, while ridges rise closely on either side. Comparing the road and elevation layers shows how physical terrain has constrained the shape of transportation and settlement across the county.
Use a different map when the question shifts from towns to water or relief
Start with the general map when the goal is to identify the county boundary, road numbers, Prestonsburg, and surrounding communities in one view. Use the city map when only the five principal city labels are needed. For Dewey Lake, the Levisa Fork, Beaver Creek, or the smaller tributary valleys, the terrain-and-water map provides much more detail than the road-focused version.
The elevation map becomes the most useful choice when the question is why the southern half looks more rugged or why a route bends around a valley. Its 182–702 meter range highlights the sharp contrast between low stream corridors and high ridge crests. Pairing the general map with the elevation map works well for explaining roads, while pairing the water map with the elevation map makes stream valleys and surrounding ridges easier to compare.
These files are designed as static county reference maps. They can support printing, lessons, local orientation, or a general geographic overview, but they should not replace legal parcel data, official flood products, current road closure information, field surveys, or site-specific engineering sources. When a task depends on current conditions or legal precision, consult the responsible agency.
A north-to-south reading ties Dewey Lake, Prestonsburg, Martin, and Wheelwright together
One practical way to remember Floyd County is to picture Dewey Lake and Prestonsburg in the north, Martin near the middle, and Wayland and Wheelwright farther south. The Levisa Fork and Beaver Creek systems divide that long shape into recognizable valleys, while the roads follow the same low corridors. Once those anchors are familiar, smaller place names become easier to position because they can be related to a specific river branch, highway, or ridge section.
The terrain changes along the same north-to-south reading. Northern and central river valleys create longer low corridors, while the southern end contains more closely packed high ridges. A single mean elevation of 322 meters cannot show that contrast by itself; the full 182–702 meter range explains much more about the county’s character. The strongest relief appears where low creek bottoms sit immediately beside high ridge crests.
At full resolution, the four maps reveal different parts of the same landscape rather than repeating one picture. The general map is best for roads and named places, the city map removes clutter, the water map identifies the valley network, and the elevation map explains the relief behind those valleys. Using the files together provides a clearer geographic picture of Floyd County than any one layer alone.
Frequently Asked Questions
Where are Prestonsburg and Wheelwright located within Floyd County?
Prestonsburg is in the northern half of the county and functions as the clearest road and settlement reference point. Wheelwright lies much farther south, near the narrow lower end of the county. The city map makes that north-south separation easy to see, while the general map is better for understanding the winding road routes between the two areas.
Which water features are the best landmarks on the Floyd County maps?
Dewey Lake is the strongest northern landmark, and the Levisa Fork provides the main river corridor through the northern and central county. Middle Creek and Johns Creek help orient the north, while Right Fork Beaver Creek, Left Fork Beaver Creek, Mud Creek, Spurlock Creek, and Toler Creek identify important southern valleys. These names are especially useful where major town labels are sparse.
Where does the elevation map show the largest terrain contrast?
The lower Levisa Fork and tributary valleys appear in green, while the southern and southeastern ridges around the Wayland and Wheelwright portions of the county rise into yellow and brown elevation classes. The mapped range is about 182 to 702 meters, so the visual contrast reflects substantial relief rather than a small change in rolling terrain.
Map File Information
Download the high-resolution JPG originals for Floyd County’s general, city, terrain-and-water, and elevation maps in one ZIP file.
- Included Files: county map, city map, terrain-and-water map, elevation map
Related Maps
Sources and references
Administrative boundaries can be checked through the U.S. Census Bureau TIGER/Line program. Hydrography reference data are available from USGS National Hydrography, and county-scale elevation context can be compared with the USGS 3D Elevation Program. County-specific background is available from the Kentucky.gov Floyd County profile, the Kentucky Department of Fish and Wildlife Resources Dewey Lake WMA page, and Floyd County Tourism recreation information.
These maps are static geographic reference products. For parcel boundaries, legal determinations, flood risk, emergencies, current road conditions, engineering design, or survey-grade elevation, use the latest specialized information from the responsible agency.
Green Map creates custom-edited map images using open geographic data sources such as geoBoundaries, Natural Earth, OpenStreetMap, and government open data. These maps are edited visual materials, not raw data files, and are provided for education, documents, presentations, and graphic reference.