California recorded the largest 2024 state value in the U.S. Energy Information Administration series for renewable fuels consumed for electricity generation in the Electric Power sector, reported in physical units. California was 32,226.900 thousand physical units, Michigan 18,201.036, and New York 14,676.438. The 51 published observations for the 50 states and District of Columbia sum to 193,225.352 thousand physical units, with California representing 16.7% of that descriptive sum. The unit is the critical limitation: this is not a Btu-normalized energy measure and it is not electricity generation in MWh. The figures should be used to describe the scale and distribution of this specific physical-unit series, not as a common-energy total across renewable sources.
The exact EIA identity is fueltypeid=REN, sectorid=98 (Electric Power), field=consumption-for-eg, annual frequency, and 2024. The field represents fuels consumed for electricity generation, while the published unit is thousand physical units. EIA also publishes energy-normalized fuel-consumption measures in Btu. Those series are better suited to comparing energy input on a common basis. A physical-unit series preserves the published quantity scale, but renewable fuels can differ in how they are physically measured and in their energy content. For that reason, the ranking below answers a narrower question: which states have the largest values in this EIA physical-unit series?
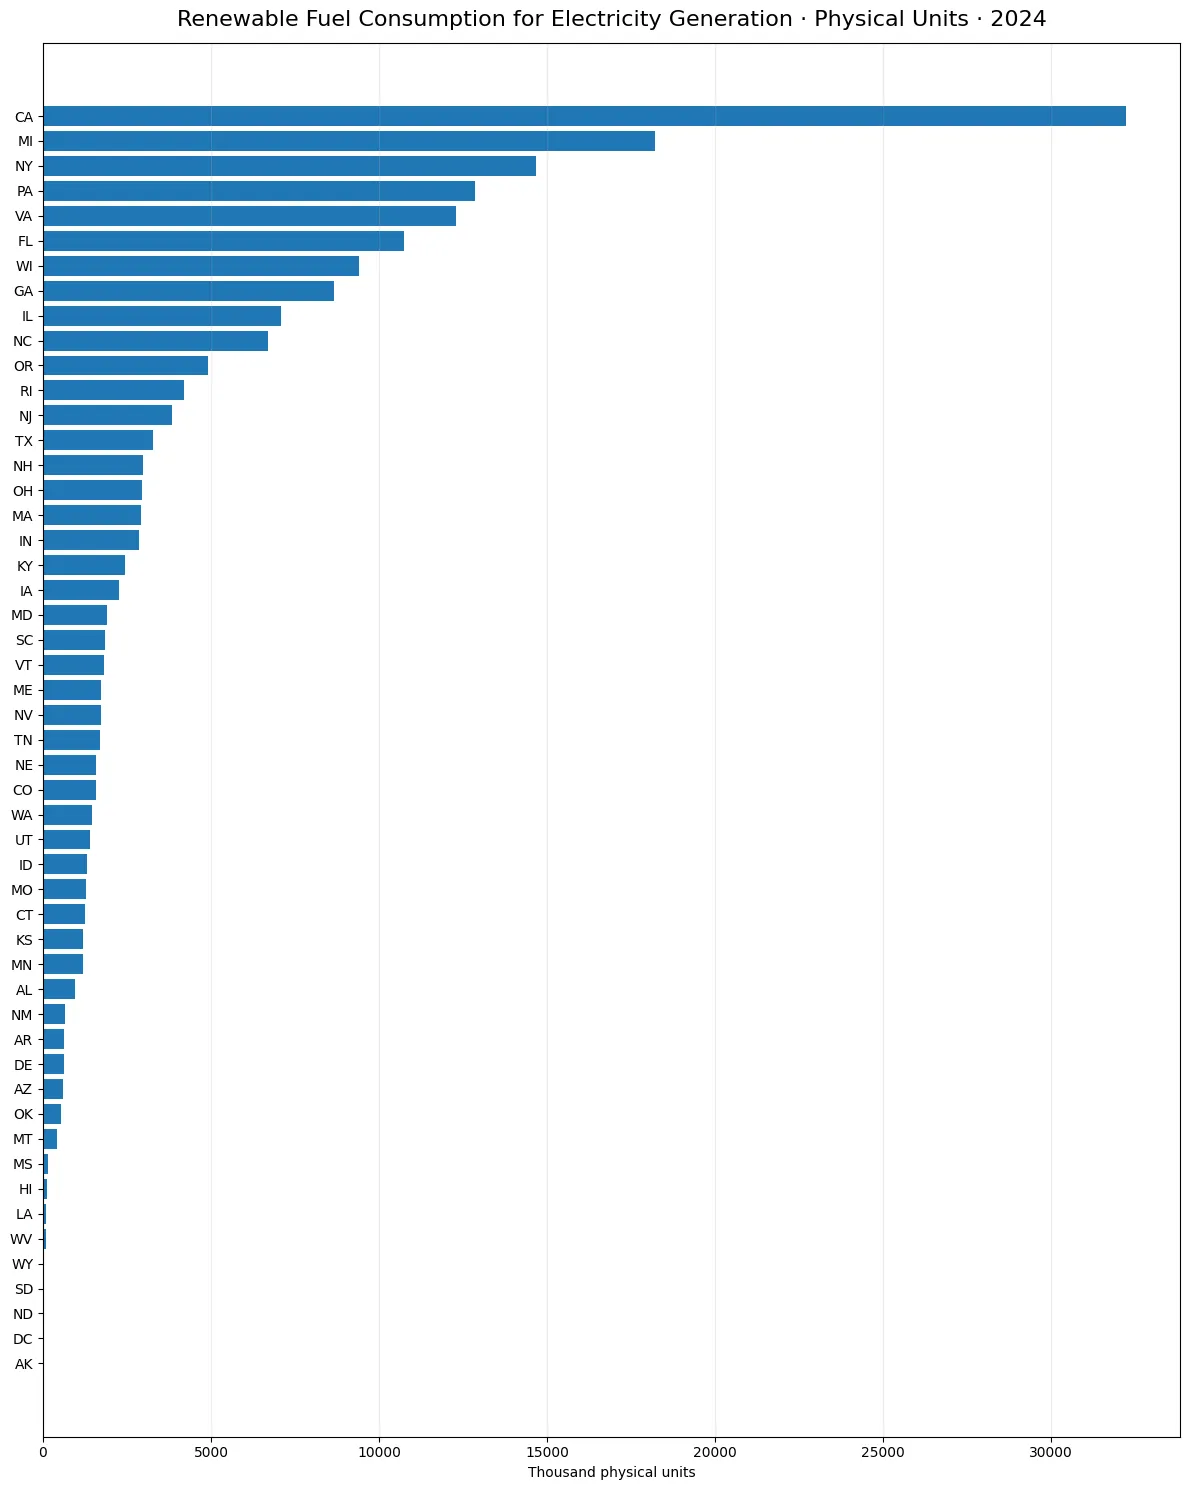
Table of Contents
California, Michigan, and New York lead the published physical-unit series
California accounts for 16.7% of the simple sum of the 51 observations. California, Michigan, and New York together account for 33.7%, while the five largest observations reach 46.7% and the top ten reach 68.8%. The series is therefore concentrated in a relatively small group of states. These shares are useful for describing the shape of the published data, but they are not shares of a common energy total. Because the unit is physical rather than Btu-normalized, differences in renewable-fuel composition can affect how directly one state can be compared with another in energy terms.
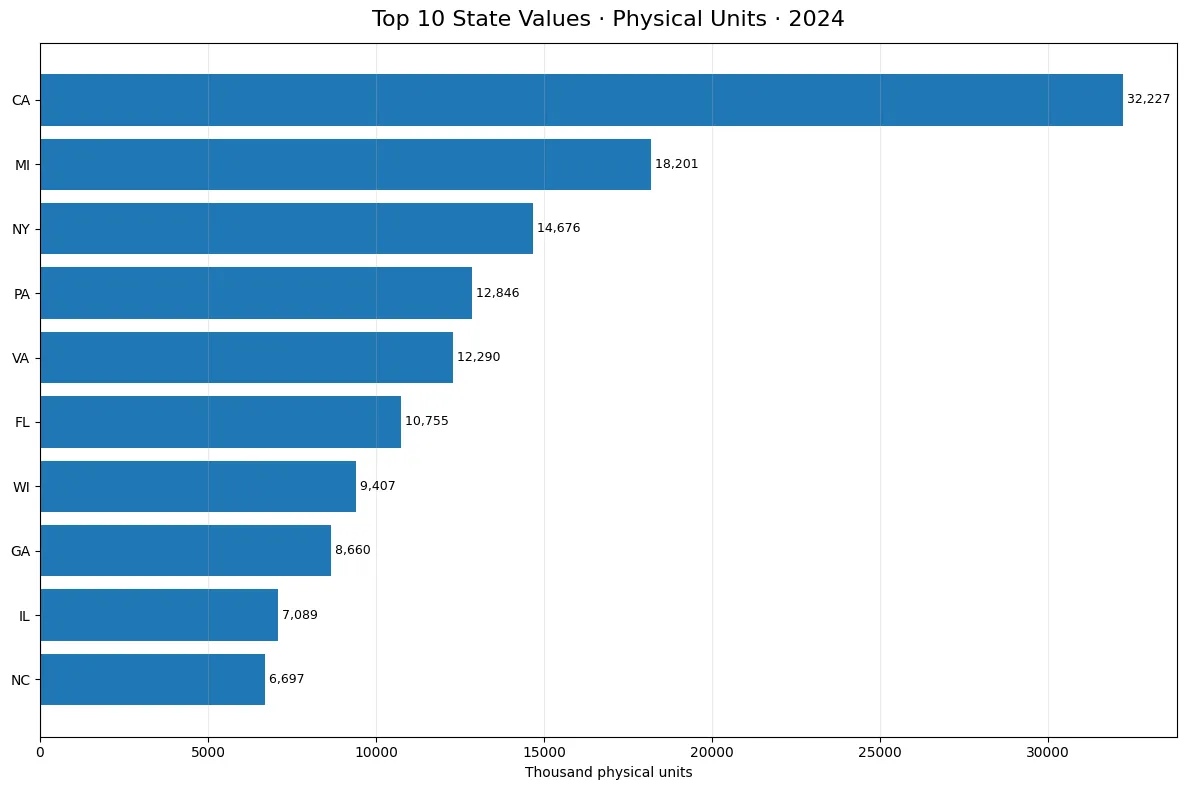
| Rank | State | Value (thousand physical units) | Share of simple 51-observation sum |
|---|---|---|---|
| 1 | California | 32,226.900 | 16.7% |
| 2 | Michigan | 18,201.036 | 9.4% |
| 3 | New York | 14,676.438 | 7.6% |
| 4 | Pennsylvania | 12,845.513 | 6.6% |
| 5 | Virginia | 12,289.719 | 6.4% |
| 6 | Florida | 10,754.850 | 5.6% |
| 7 | Wisconsin | 9,406.595 | 4.9% |
| 8 | Georgia | 8,660.126 | 4.5% |
| 9 | Illinois | 7,088.649 | 3.7% |
| 10 | North Carolina | 6,697.474 | 3.5% |
The median is much lower than the mean
The mean of the 51 observations is 3,788.732 thousand physical units, while the median is 1,685.788. The first quartile is 620.944 and the third quartile is 3,557.615. That gap between mean and median shows that the upper tail has a strong influence on the average. A statement that the typical state used roughly 3,789 thousand physical units would therefore be misleading. The middle of the distribution is much lower. Quartiles and the median provide a better picture of where most state observations sit, while the mean reflects the effect of the largest values.
Five jurisdictions report exact zeros, not missing values
Alaska, the District of Columbia, North Dakota, South Dakota, and Wyoming each have an exact 2024 value of 0.000 in this series. There are no missing observations. West Virginia is the smallest positive value at 88.507 thousand physical units, followed by Louisiana at 104.983, Hawaii at 133.183, and Mississippi at 143.726. These distinctions matter in both tables and charts. A reported zero is an observed value for the selected series, whereas missing data would mean that no value was available. No missing observation is converted to zero here.
| Lowest-value state or jurisdiction | Value (thousand physical units) |
|---|---|
| North Dakota | 0.000 |
| South Dakota | 0.000 |
| Alaska | 0.000 |
| Wyoming | 0.000 |
| District of Columbia | 0.000 |
| West Virginia | 88.507 |
| Louisiana | 104.983 |
| Hawaii | 133.183 |
| Mississippi | 143.726 |
| Montana | 410.912 |
Physical units and Btu answer different questions
EIA fuel-consumption data can be viewed in physical units or in Btu-based energy units. The Btu series converts fuel quantities into a common energy measure, making it more appropriate for comparing the amount of energy input across fuels and states. The physical-unit series does not perform that normalization. A state that ranks first in physical units does not necessarily rank first in Btu, because renewable fuel mixtures and energy content can differ. The physical-unit ranking is therefore best treated as a complementary view of the published fuel quantities rather than a substitute for an energy-normalized comparison.
Fuel consumption is also different from electricity generation
The selected field measures fuel consumed for electricity generation. It does not measure the amount of electricity produced. Net generation is reported in megawatthours and answers a production question, while fuel consumption describes an input. The two can move differently because technologies, fuel types, plant characteristics, and conversion efficiencies vary. A state with a high renewable-fuel physical-unit value can have a different position in a renewable net-generation ranking. Efficiency analysis requires carefully matched input and output measures, preferably using a common energy input unit rather than a mixed physical-unit series.
The leading states span several U.S. regions
The top ten include California, Michigan, New York, Pennsylvania, Virginia, Florida, Wisconsin, Georgia, Illinois, and North Carolina. The list spans the West, Midwest, Northeast, and South. That broad geographic spread makes it difficult to attribute the ranking to a single regional factor. State renewable portfolios can differ substantially, and the present state-level series does not identify how much each renewable fuel subtype contributes to the physical-unit total. Explaining the pattern would require more detailed fuel or plant-level data. The current observations establish the distribution, but not the causal reasons behind it.
The simple sum is descriptive, not a national common-unit energy total
The 51 values add to 193,225.352 thousand physical units, but that sum should be handled carefully. Physical units for different renewable fuels are not necessarily interchangeable in the way Btu values are. In this article, shares such as California’s 16.7% or the top ten’s 68.8% describe concentration within the published series. They should not be read as precise shares of national renewable energy input. For energy-share questions, the corresponding Btu series is the more appropriate basis because it normalizes fuel energy content.
What the 2024 cross-section can establish
The 2024 state observations support several direct conclusions: California has the largest value, Michigan and New York follow, the upper end of the distribution is concentrated, five jurisdictions report zero, and no jurisdiction is missing. They do not by themselves establish growth trends, policy effects, generating efficiency, renewable market share, or economic performance. Those questions require additional years or other measures such as Btu fuel input, net generation, installed capacity, costs, and technology-specific data. A valid year-over-year comparison should keep the same REN fuel facet, sector 98, consumption-for-eg field, annual frequency, and unit.
Source and calculation method
The source is the U.S. Energy Information Administration electricity/electric-power-operational-data annual series. The comparison fixes 2024, fueltypeid=REN, sectorid=98 (Electric Power), field=consumption-for-eg, and the published unit thousand physical units. All 51 state-level observations are used as published; there is no imputation and no missing-to-zero replacement. The mean (3,788.732), median (1,685.788), quartiles, rankings, simple sum, and concentration shares are calculated from those 51 observations. The sum and shares are descriptive statistics for this series and are not presented as a common-unit energy total.
Frequently Asked Questions
Which state had the largest 2024 renewable-fuel physical-unit value for electricity generation?
California ranked first at 32,226.900 thousand physical units, followed by Michigan and New York.
Are thousand physical units the same as Btu?
No. The physical-unit series is not normalized to a common energy unit. Btu-based data are more appropriate for comparing energy input.
Are the five zero values missing observations?
No. Alaska, the District of Columbia, North Dakota, South Dakota, and Wyoming have reported zeros, and none of the 51 observations is missing.
Can this series be read as renewable electricity generation?
No. It measures fuel consumed for electricity generation. Electricity generation itself is measured separately in MWh.
Related Articles
Green Map creates custom-edited map images using open geographic data sources such as geoBoundaries, Natural Earth, OpenStreetMap, and government open data. These maps are edited visual materials, not raw data files, and are provided for education, documents, presentations, and graphic reference.