The 2025 land-cover pattern in Martin County is defined by a strong east-west contrast. Agriculture occupies 31.23% of the county and is concentrated across much of the west and interior, while wetlands account for 28.64% and water adds another 20.51%. Developed land is smaller at 16.22% but is visually prominent because it clusters along the eastern side near the Atlantic-facing communities and estuarine waterways. Forest is only 1.99%, so the county is better described through the interaction of farms, wetlands, open water, and developed land than through a forest-dominated landscape.
This page includes four related views: the 2025 general land-cover map, a forest-and-farmland map, an impervious-surface and developed-land map, and a 1985–2025 class-difference map. The WebP versions are displayed in the article for quick comparison, while the four original JPG maps are bundled in one ZIP download below. Together they let you move from the broad county pattern to questions about working land, hard surfaces, and where classifications differ between two dates.
Table of Contents
Agriculture leads the county summary, but wetlands and water are nearly as important
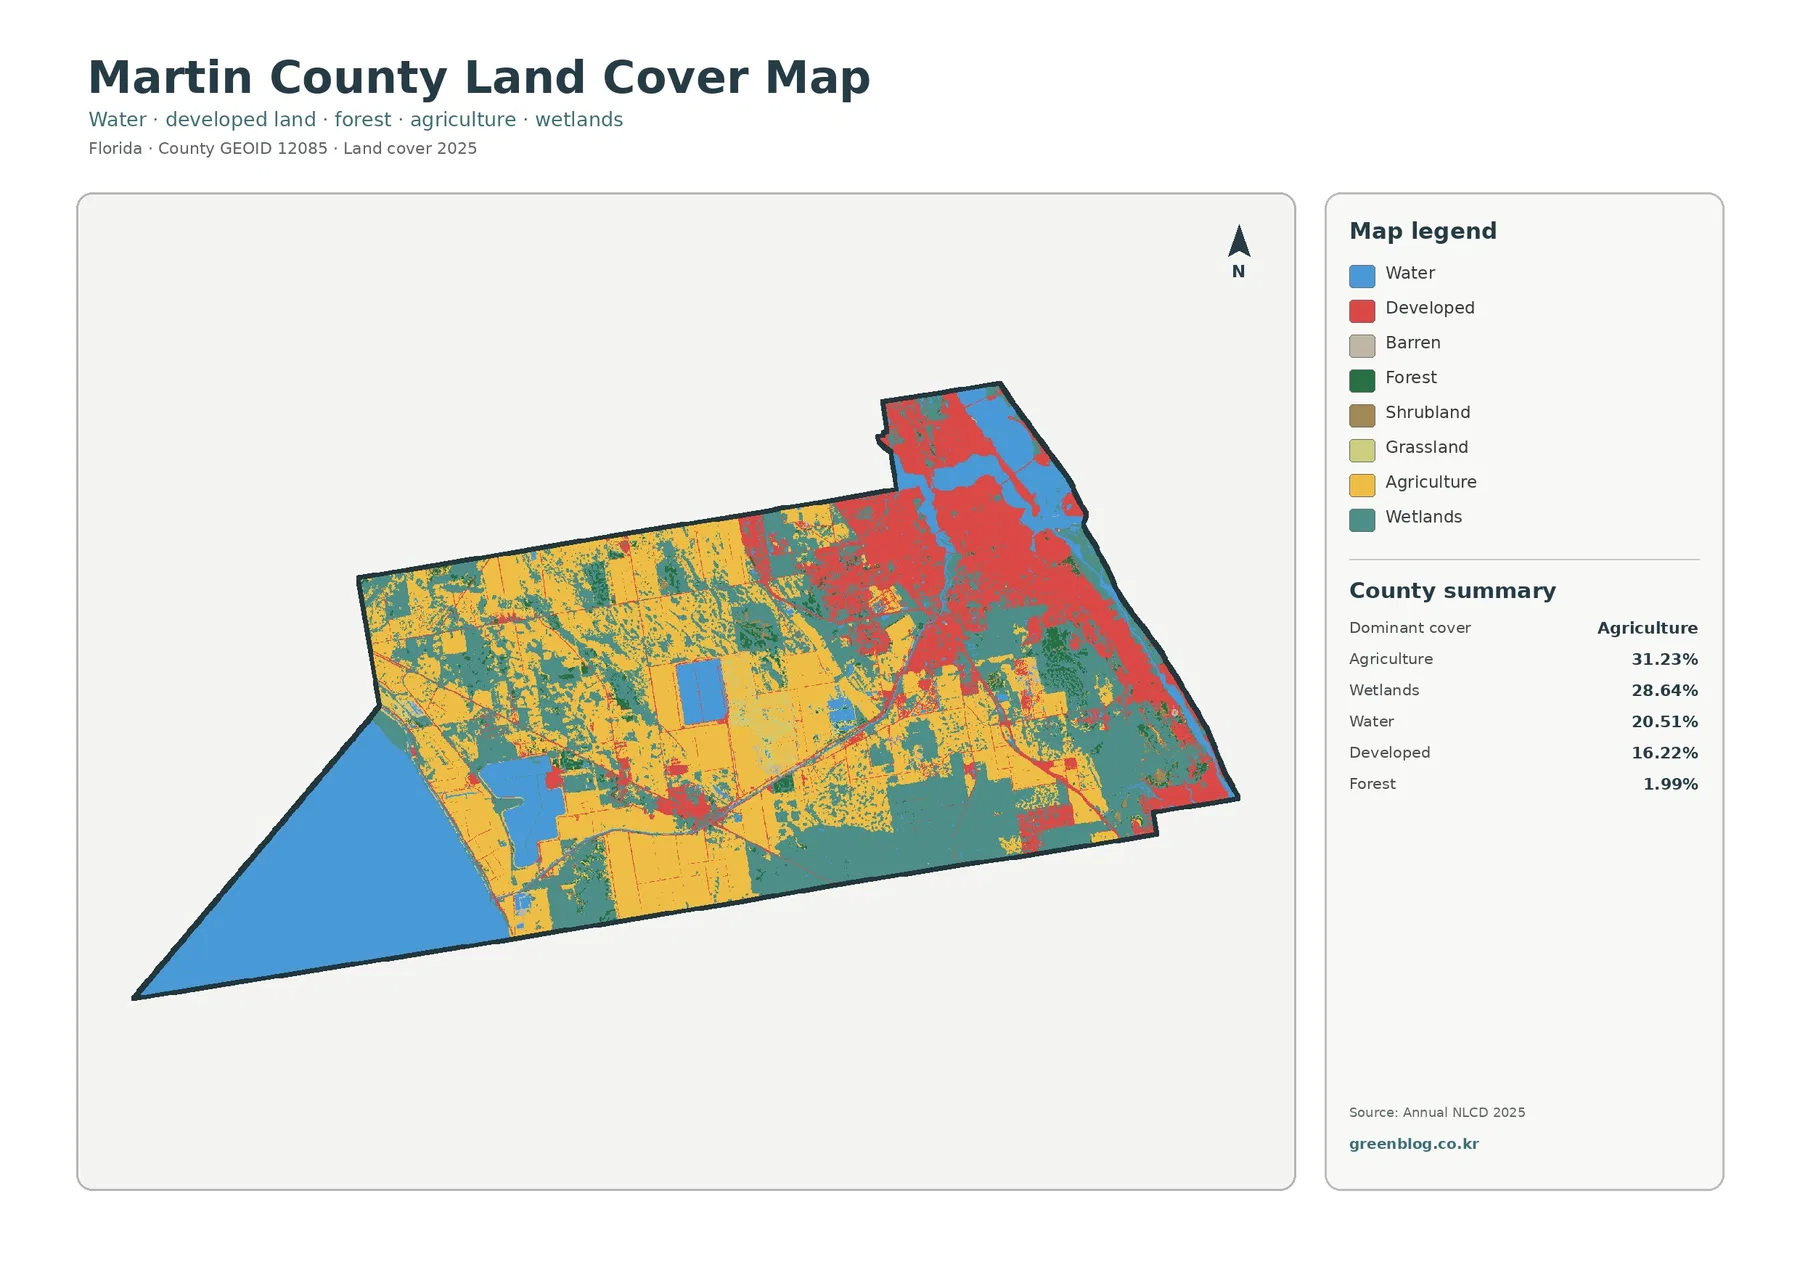
Agricultural cover is the largest single category at 31.23%. On the western half of the map it appears in broad blocks and a finer patchwork, with additional agricultural areas reaching toward the center. The shapes are useful for seeing where agricultural surface classes are concentrated, but they should not be read as farm parcels. Annual land-cover data classify raster cells from remotely sensed information; they do not draw ownership lines or establish legal agricultural use.
Wetlands are almost as extensive at 28.64%. They form large areas through the central and southern parts of the county and appear between agricultural blocks farther west. Wetland colors also remain visible closer to the eastern developed area. Martin County maintains specific wetland and upland protection policies, which gives useful local context for why wet areas matter here, but the land-cover class is not a regulatory wetland delineation. A permit or parcel decision requires site-specific information and official jurisdictional data.
Water accounts for 20.51%, an unusually large share to ignore in any description of the county. A large open-water area forms the far western end of the mapped county, while the east contains branching water associated with the St. Lucie River, Indian River Lagoon, and the coast. Martin County’s official St. Lucie Inlet information describes the inlet as a connection between the Atlantic Ocean, Indian River Lagoon, St. Lucie River, Hobe Sound, and the Intracoastal Waterway. That geography helps explain why open water is not confined to one edge of the county.
Developed cover is 16.22%, yet its red pattern is among the easiest features to find. It is heavily concentrated in the east and northeast, where clusters merge into a broad developed belt and extend along narrower connecting routes. Martin County’s community information identifies places such as Jensen Beach, Palm City, Port Salerno, Hobe Sound, Rio, and the Stuart area within this eastern part of the county. The map does not label those communities directly, so the safest interpretation is to use them as verified geographic context rather than assigning every red patch to a named place.
Forest covers only 1.99%, with grassland at 0.62% and shrubland at 0.37%. Those small shares matter because they prevent the remaining surface from being treated as a simple three-class landscape, but they are not the dominant story. The countywide image is much more clearly organized around western agriculture, extensive wetlands, major water bodies, and an eastern developed concentration.
The focused vegetation view separates western working land from wet natural cover
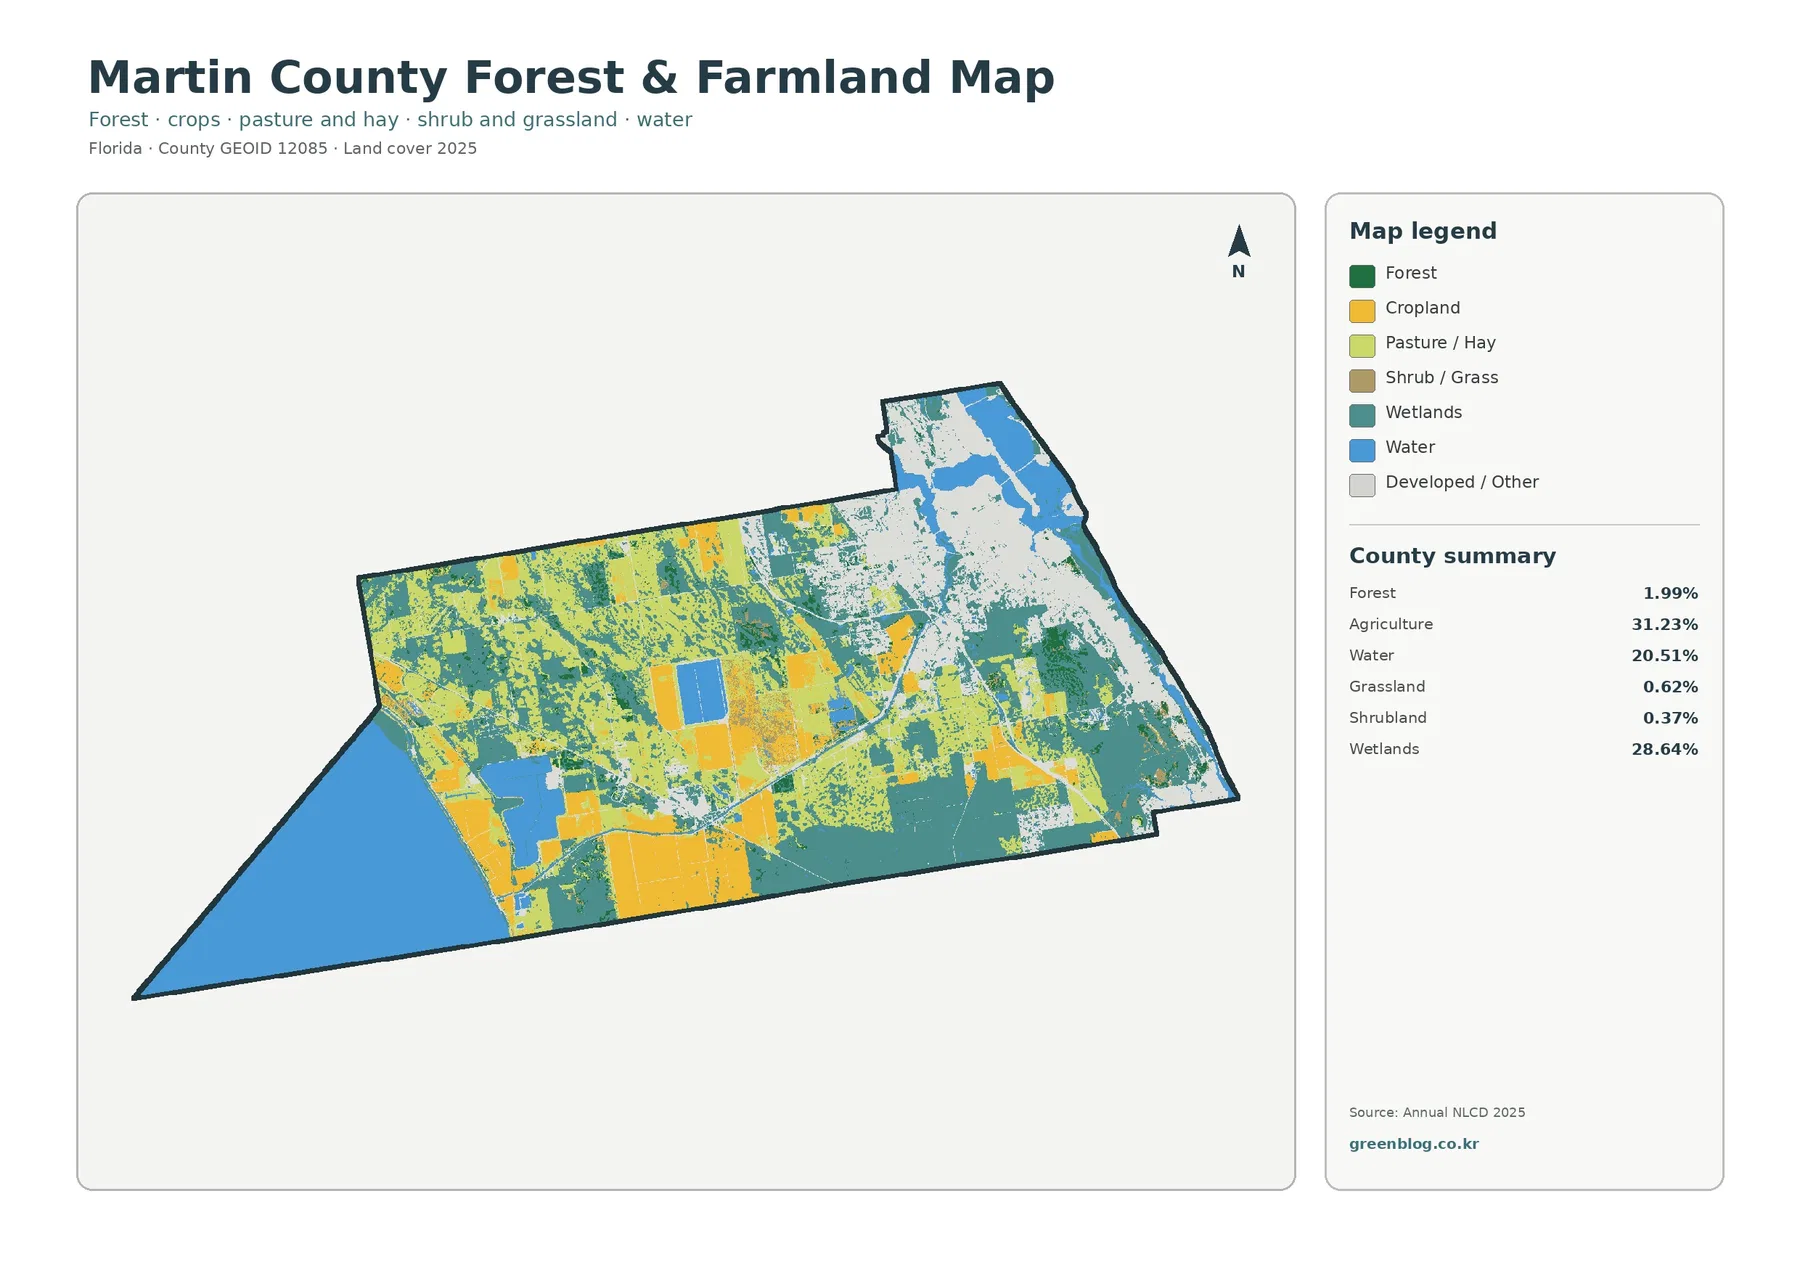
The forest-and-farmland map makes the western agricultural pattern easier to follow because most urban detail is pushed into a neutral category. Cropland colors form large fields and smaller mosaics across the west and west-central county. Pasture or hay appears separately in the legend, but the supplied county summary combines agricultural land into one 31.23% figure. That means the map supports a spatial comparison between agricultural types, not a precise percentage split that has not been supplied.
Wetland cover remains one of the strongest colors, especially across the south-central portion of the county and in bands that separate or border agricultural areas. This mixture is important when using the map for watershed or environmental education. A field may be close to a wetland without the map proving anything about drainage direction, water rights, buffer requirements, or agricultural practices. Those questions need separate hydrologic, regulatory, or parcel data.
The eastern side has far less agricultural color. Instead, developed or other surfaces occupy much of the area around the county’s population centers, while wetlands and open water continue through the estuarine and coastal setting. Martin County says it manages about 35,000 acres of environmentally sensitive conservation lands and lists preserves in Stuart, Palm City, Hobe Sound, and other communities. That provides helpful local context for the natural-cover patches, but a land-cover cell should never be assumed to be public conservation land without a separate preserve boundary.
Forest is a minor countywide class at 1.99%, and the dark-green areas appear as small pieces rather than one continuous forest block. A reader should not infer that tree cover is absent wherever the forest color is missing. Wetland classes can include woody vegetation, landscaped developed land can contain trees, and a mixed raster cell can be assigned to another dominant category. The map is a classification of surface cover, not a tree inventory.
Hard surfaces are concentrated in the east even though the countywide mean is modest
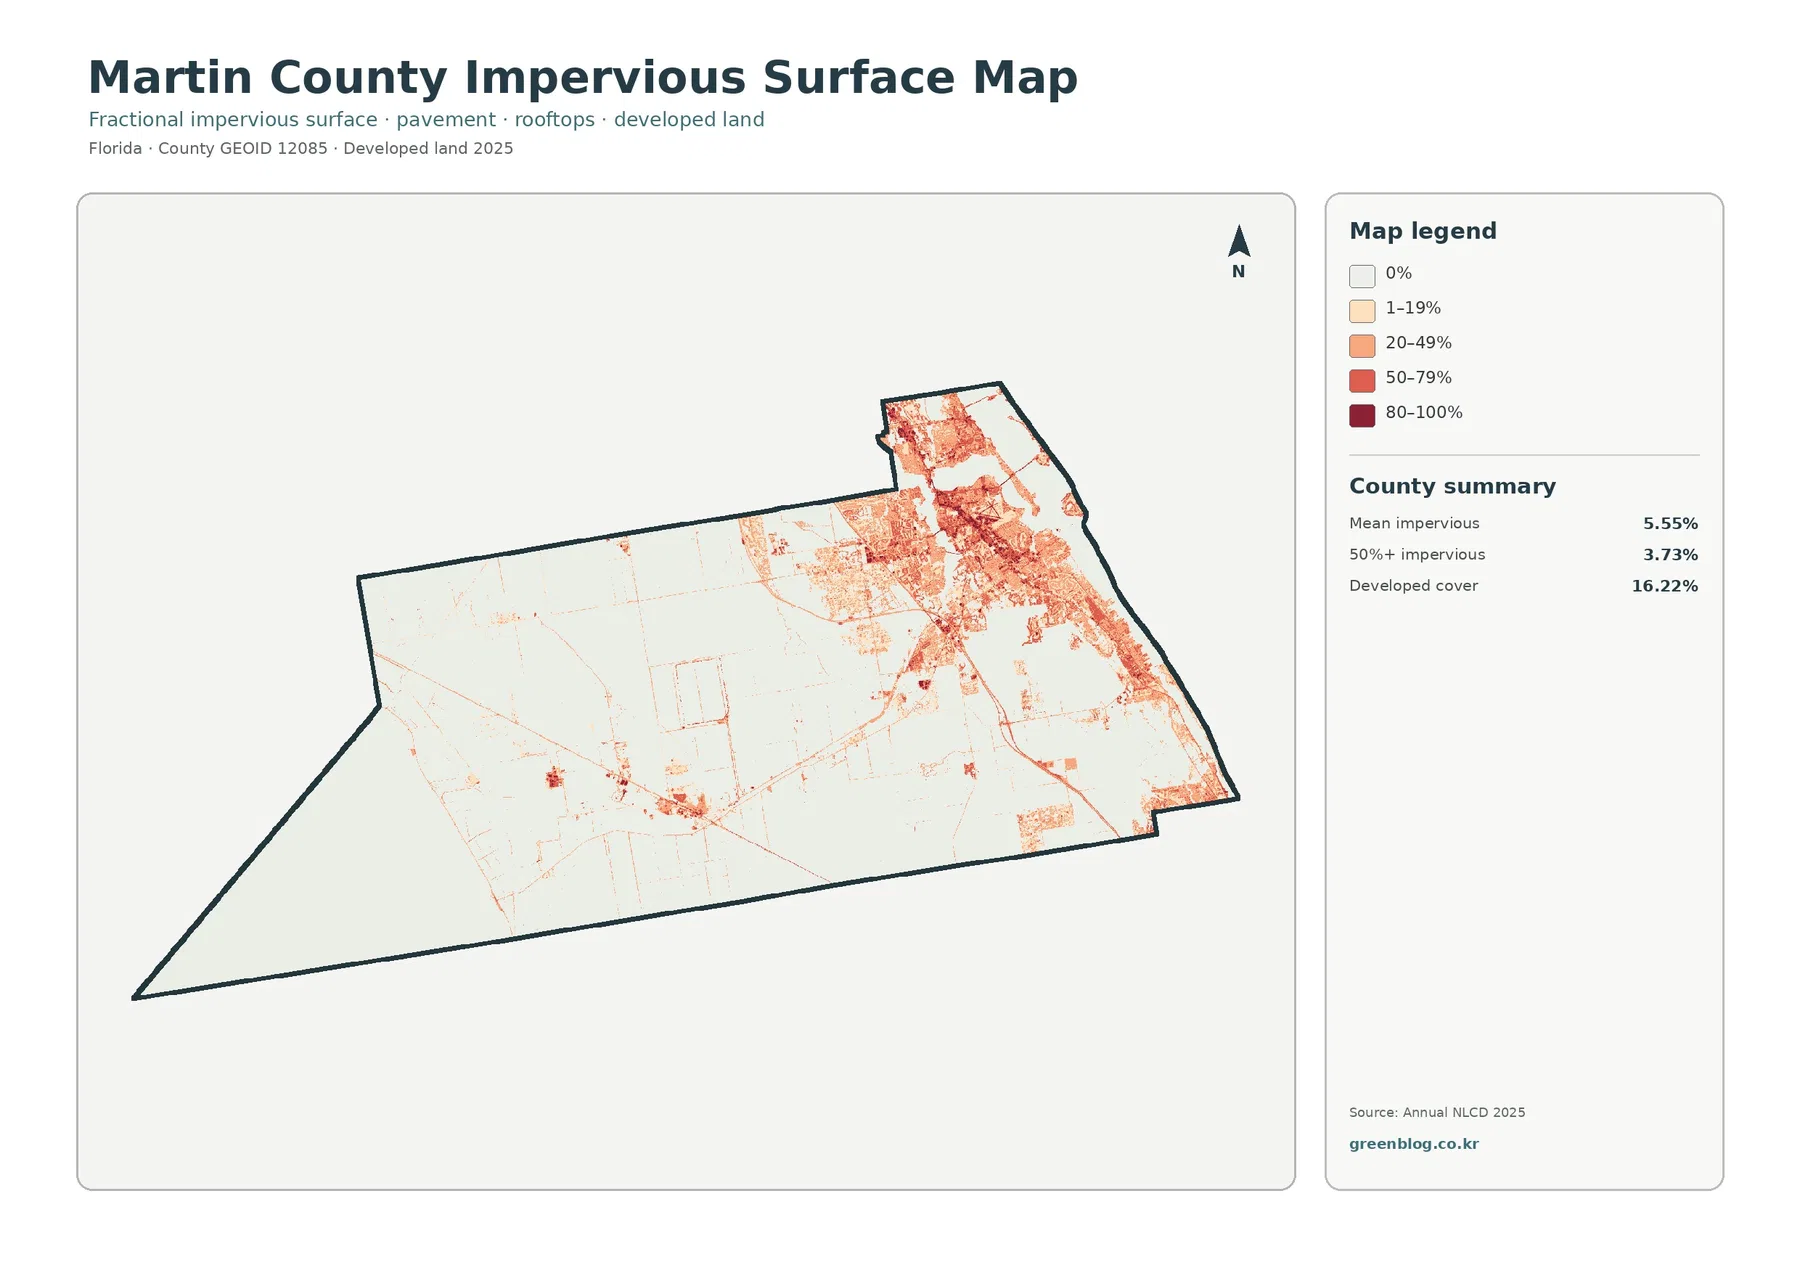
Impervious surface means material such as pavement, rooftops, and parking areas that does not readily absorb water. Martin County’s mean impervious cover is 5.55%, while 3.73% of the county is mapped at 50% or greater impervious surface. Those values are much lower than the 16.22% developed-cover share because a developed land-cover cell can also contain lawns, trees, gardens, open soil, and other permeable surfaces.
The darkest and most continuous impervious pattern occurs on the eastern side. Several high-intensity clusters connect into a broad urbanized area, while thinner traces extend westward and smaller isolated concentrations appear farther inland. Some of those narrow traces resemble roads, but this is not a transportation map. It measures the fraction of hard surface and does not provide road names, lane counts, traffic volumes, or access information.
Comparing the impervious map with the general land-cover map is especially useful around the St. Lucie River and Indian River Lagoon. Developed land, wetlands, and water sit close together in the east, yet the impervious map shows that built intensity varies within the broader developed class. This is a better way to explain the difference between “developed” and “mostly paved” than relying on the red land-cover color alone.
Low impervious values across most western agricultural land should not be translated into low flood risk or low environmental sensitivity. Flooding depends on rainfall, drainage, elevation, water levels, soils, canals, and other factors that are outside this map. The impervious view is strongest when the question is surface hardness and development concentration, not when it is used as a substitute for a flood, stormwater, or engineering map.
The 1985–2025 comparison concentrates developed-class differences around the present eastern belt
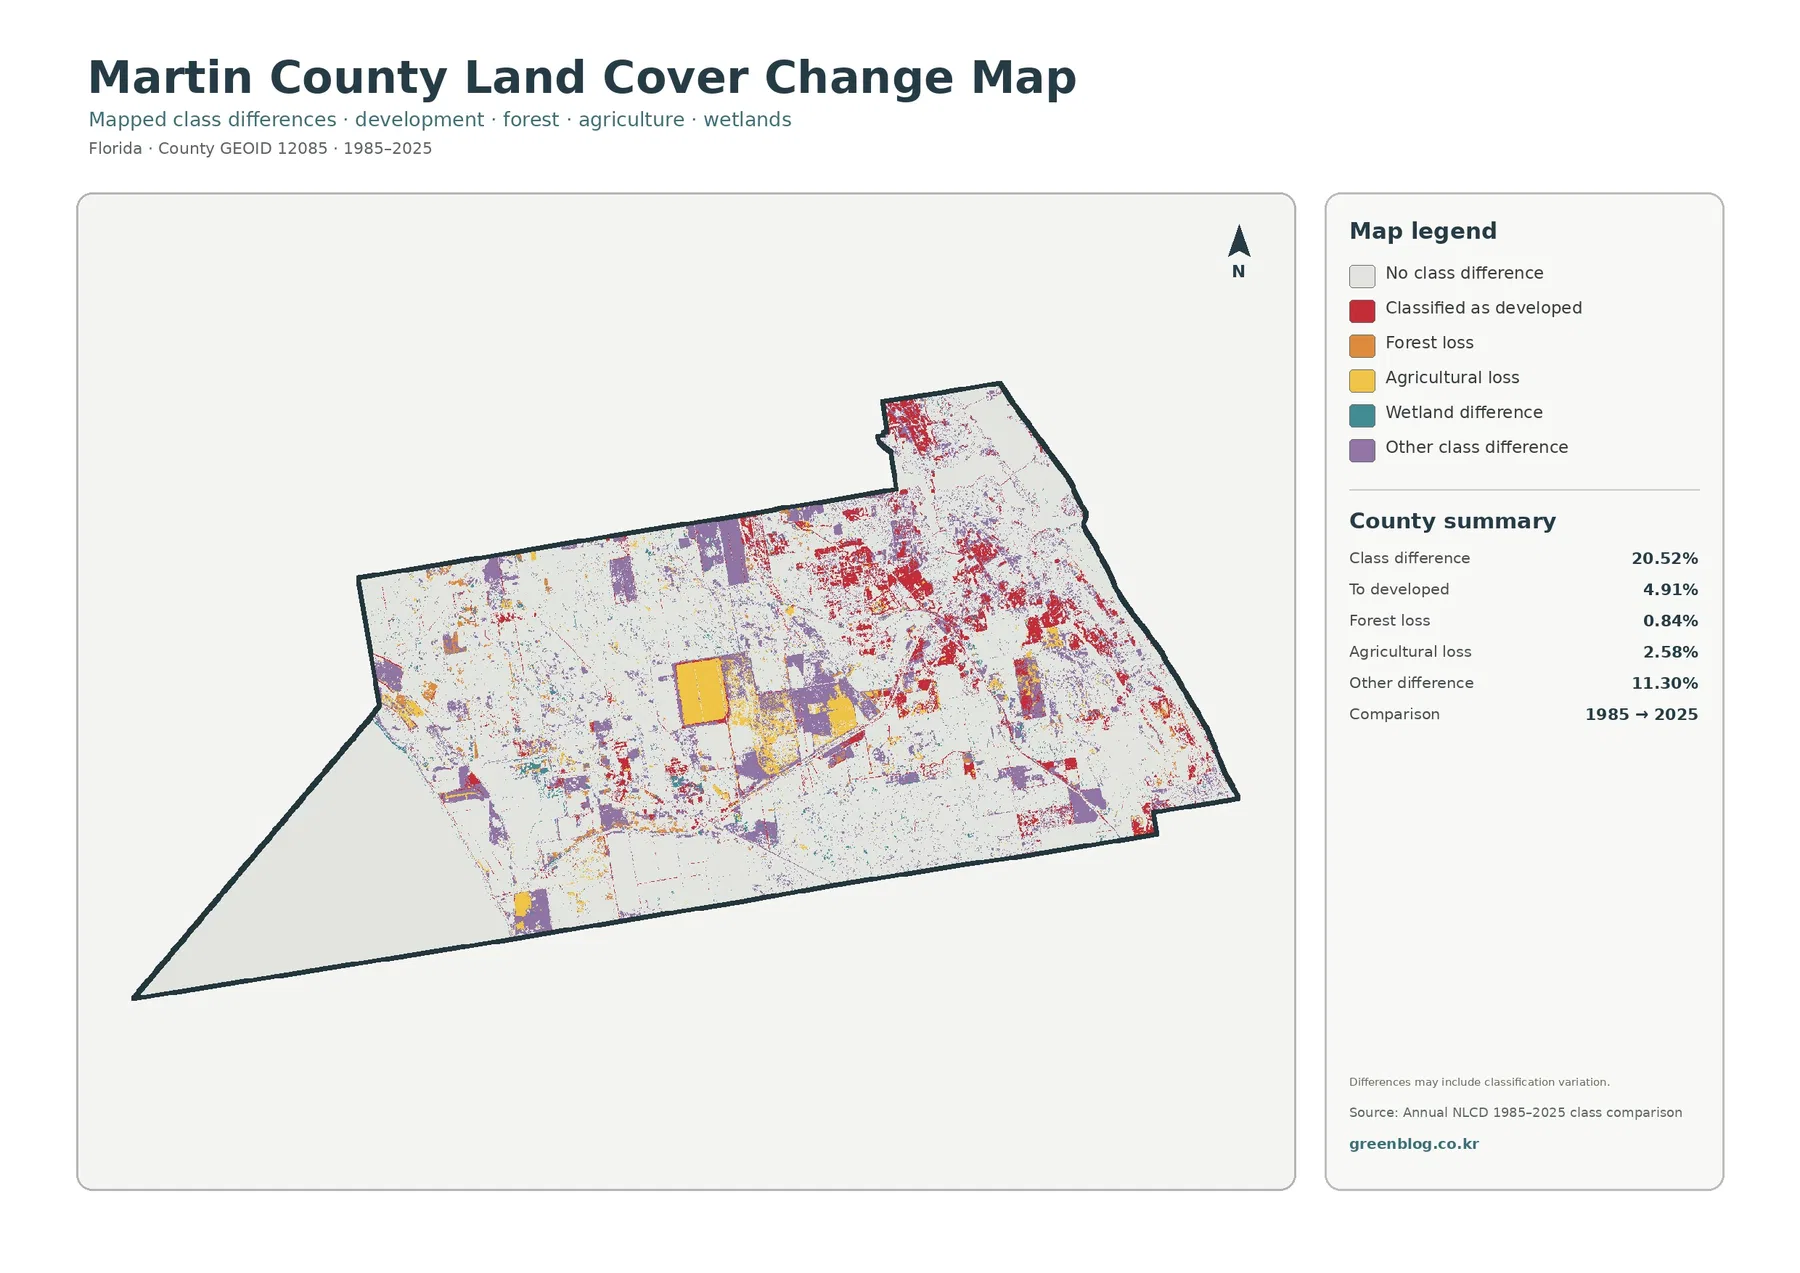
The change map reports a total class difference of 20.52%. That number does not mean that exactly 20.52% of Martin County was physically transformed or damaged. It is the share of mapped cells whose classifications differ between the 1985 and 2025 comparison. The map itself notes that classification variation may be included, so imagery, seasonal conditions, mixed pixels, or changes in classification can contribute alongside real landscape change.
Cells highlighted as developed account for 4.91% of the county comparison. Red marks are most concentrated in the east and northeast, overlapping the general area that now carries the strongest developed and impervious patterns. Smaller red traces also extend inland. This makes the change map a useful companion to the 2025 maps, but the 4.91% figure is not the same as the current 16.22% developed share. One describes a change category between dates; the other describes the 2025 surface.
Agricultural loss is summarized at 2.58%, and its yellow patches are visible within western and central agricultural areas. Forest loss is 0.84%, a smaller category consistent with the county’s low current forest share. Other class difference is much larger at 11.30% and appears as purple blocks and patches across the interior. Wetland difference is also included in the legend, but the supplied summary does not give a separate exact percentage, so it would be inappropriate to estimate one from the image.
The most responsible use of this map is screening. A cluster of red, yellow, teal, or purple cells can identify an area worth checking against intermediate aerial imagery, local planning records, restoration projects, or agricultural information. The map cannot establish why a particular cell changed, who owned it, whether a permit was issued, or whether a classification difference represents a permanent land conversion.
Lake Okeechobee, the C-44 corridor, and the Atlantic side provide geographic context
Martin County stretches across a landscape that links the Lake Okeechobee side of South Florida with the Atlantic coast. The far western open-water area on the supplied map aligns with the county’s connection to Lake Okeechobee, while the St. Lucie system carries water toward the east. Martin County’s official information on the Lake Okeechobee operating system and the C-44 project describes how western Martin County, the lake, and the St. Lucie estuary are connected through regional water-management infrastructure.
That setting helps explain why the county’s land-cover pattern should be read as a sequence of interacting surfaces rather than separate zones. Large agricultural areas occupy much of the west, wetlands spread through the interior and south, and developed land becomes much stronger toward the east. Open water is present at both ends of the county’s broader geographic story. A map of land cover cannot explain all of the hydrology, but it makes the proximity of farms, wetlands, waterways, and developed communities immediately visible.
It is also important not to confuse this physical pattern with legal land use. “Agriculture” on the map means a remotely classified ground-cover category, not an agricultural zoning district. “Developed” does not mean that further construction is allowed, and “wetland” is not a surveyed jurisdictional boundary. For property, permitting, zoning, or conservation requirements, Martin County’s official planning maps and site-specific environmental review are the appropriate next sources.
Choosing the right map depends on the question, not on which image has the most color
Use the general 2025 map when the goal is to introduce the county. It places the 31.23% agricultural share, 28.64% wetland share, 20.51% water share, and 16.22% developed share in one view and makes the east-west contrast clear. It works well as the first graphic in a county profile, classroom handout, presentation, or article because the audience can see both the percentages and their broad locations.
Choose the forest-and-farmland view when working land and natural cover are the main topic. The impervious map is better for discussing development intensity because it separates hard surfaces from the broader developed class. Use the 1985–2025 comparison when the question is where classifications differ between two dates. Treating those four maps as interchangeable would hide the reason each one exists.
For a lesson or presentation, two large maps often work better than four small ones. Pair the general map with the impervious view to explain why developed land and hard surface are different measures. Pair the vegetation map with the change map to locate agricultural areas that also contain classification differences. Keeping the legend and year visible is more valuable than cropping tightly around the county outline.
Raster cells, mixed surfaces, and observation dates set the limits of the map
Annual NLCD represents a landscape as raster cells, which are grid squares assigned a dominant class. A real cell may contain trees, water, grass, pavement, and a building at the same time, yet a generalized land-cover map may label it with one category. Mixed pixels are therefore common near wetland edges, farm boundaries, canals, shorelines, and low-density developed areas where several surface types occur close together.
Making the JPG larger does not create parcel-level detail. Narrow drainage channels, individual buildings, small patches of vegetation, and property boundaries can be generalized or omitted. These maps are appropriate for county-scale comparison, environmental education, presentation graphics, and identifying areas for further study. They are not substitutes for a survey, wetland delineation, engineering plan, or current parcel map.
The general maps use the supplied 2025 observation year. Development, restoration, crop changes, flooding, or vegetation shifts after that date may not appear. The 1985–2025 view is also a two-date comparison rather than a continuous record of every year in between. A location could have changed more than once and still finish with a class similar to the one it had at the beginning.
Practical uses for printing, teaching, and county-to-county comparison
For printing, select the map whose legend answers the main question and keep the county summary visible. The general map is the clearest one-page overview. The vegetation view works well for agriculture and wetland discussions, the impervious map for built-surface concentration, and the change map for a two-date comparison. Large labels and the compact legend make the images suitable for reports and slides as long as the original classification limits are explained.
Martin County also offers a strong environmental-education example because open water, wetlands, agriculture, and developed land all occupy substantial shares. A class can compare wetlands with open water, then examine how developed cover becomes concentrated on the east side near the river-and-lagoon system. That exercise encourages students to distinguish a land-cover category from a legal land use, a regulatory wetland, or a named water feature.
When comparing Martin County with another Florida county, keep the observation year and classification system consistent. Martin County’s supplied reference values are 31.23% agriculture, 28.64% wetlands, 20.51% water, 16.22% developed land, 1.99% forest, and 5.55% mean impervious cover. Compare spatial arrangement as well as percentages, because a smaller developed class can look visually dominant when it is concentrated in one part of the county.
What the four-JPG download contains
The ZIP contains the four original JPG maps used in this article: the 2025 land-cover map, forest-and-farmland map, impervious-surface and developed-land map, and 1985–2025 land-cover change map. Each JPG is 2480 × 1754 pixels. The package manifest does not mark these files as meeting the A3 high-resolution reference, so check print size and sharpness before using them for a large-format final output.
Keeping the original filenames is useful when moving the maps into presentations or folders because the four views can otherwise be easy to confuse. Preserve the map year, legend, and county summary when cropping. That is especially important for the change map, where “1985 → 2025” and the note about possible classification variation are part of the correct interpretation.
Frequently Asked Questions
What is the largest land-cover class in Martin County?
Agriculture is the largest class in the supplied 2025 summary at 31.23%, followed closely by wetlands at 28.64%. Water is 20.51% and developed land is 16.22%. The map shows agriculture concentrated mainly in the west and interior, while development is much stronger toward the eastern side.
Why is developed cover 16.22% while mean impervious cover is only 5.55%?
Developed land is a broad land-cover class that can include lawns, trees, gardens, and other permeable surfaces around buildings and roads. Impervious cover isolates the fraction occupied by hard surfaces such as rooftops, pavement, and parking areas. The two numbers measure different aspects of the same developed landscape.
Does the 20.52% class difference mean one-fifth of Martin County was physically changed?
No. It is the share of cells classified differently in the 1985 and 2025 comparison, and the map warns that classification variation may be included. Conversion to developed is 4.91%, agricultural loss is 2.58%, and forest loss is 0.84%, but those categories identify where to investigate rather than proving a specific cause.
Sources and Reference Data
- MRLC Annual NLCD Data – source data for the supplied 2025 land-cover and 1985–2025 comparison views
- USGS Annual NLCD Land Cover Classification – definitions for developed, agricultural, wetland, forest, water, and other mapped classes
- U.S. Census Bureau TIGER/Line Shapefiles – official geographic boundary reference for Martin County
- Martin County – St. Lucie Inlet – official context for the Atlantic Ocean, Indian River Lagoon, St. Lucie River, Hobe Sound, and Intracoastal Waterway
- Martin County – Conservation Lands & Preserves – county information on protected natural areas and conservation lands
Map File Information
The ZIP contains the four original JPG land-cover maps used for this Martin County article.
- Included Files: Use only the versions confirmed in the article and supplied images
- File Type: Use the confirmed download contents
- Intended Use: Printing, education, presentations, and map-based projects
Related Maps
- Alachua County Florida Land Cover Map
- Baker County Florida Land Cover Map
- Bay County Florida Land Cover Map
Green Map creates custom-edited map images using open geographic data sources such as geoBoundaries, Natural Earth, OpenStreetMap, and government open data.
These maps are edited visual materials, not raw data files, and are provided for education, documents, presentations, and graphic reference.