Bradford County’s 2025 land-cover pattern is a patchwork rather than a landscape dominated by one surface. Forest is the largest class at 31.82%, wetlands account for 25.00%, agriculture 16.28%, and developed land 11.49%. The Starke area forms the strongest developed concentration in the eastern half of the county, while broader agricultural cover appears to the west and southwest. Several central water bodies are bordered by wetlands and forest, giving the county a clear mix of settlement, farms, woodland, and wet ground within a relatively small area.
This page provides four views of Bradford County: 2025 land cover, forest and farmland, impervious/developed land, and a 1985–2025 land-cover change comparison. The four original JPG maps are available together in one ZIP download, while the WebP versions make the patterns easy to compare on the page. Land cover describes what physically covers the ground. It should not be used as a substitute for zoning, parcel ownership, development rights, a flood map, or a surveyed wetland boundary.
Table of Contents
The Starke area creates a distinct development axis inside a largely rural county
Bradford County’s government describes the county as a rural community in Northeast Florida and identifies Starke, Lawtey, Hampton, and Brooker as its municipalities, with Starke serving as the county seat. That rural description fits the impervious and general land-cover maps, where most of the county remains lightly developed. The major exception is the eastern-central portion around Starke, where red developed classes and darker impervious cells form the most continuous concentration on the map.
The county’s GIS portal specifically provides Bradford County road layers, FDOT data, and Starke 301 Bypass layers. The impervious map shows a north-south development pattern near the largest Starke cluster, but the raster image does not label roads, so every line should not be named from appearance alone. A practical workflow is to find the concentration on the land-cover or impervious image and then use the county GIS to identify the actual road, municipal, or parcel context.
The county’s own historical material also notes the importance of U.S. 301 to Bradford County’s twentieth-century development. This does not mean that a road alone explains the land-cover pattern, but it provides useful context for why development is organized more strongly along an eastern transportation and settlement corridor than across the broad western interior. The current maps should still be treated as 2025 surface classifications rather than a history of individual development decisions.
Impervious cover is low countywide but sharply concentrated around the main settlement corridor
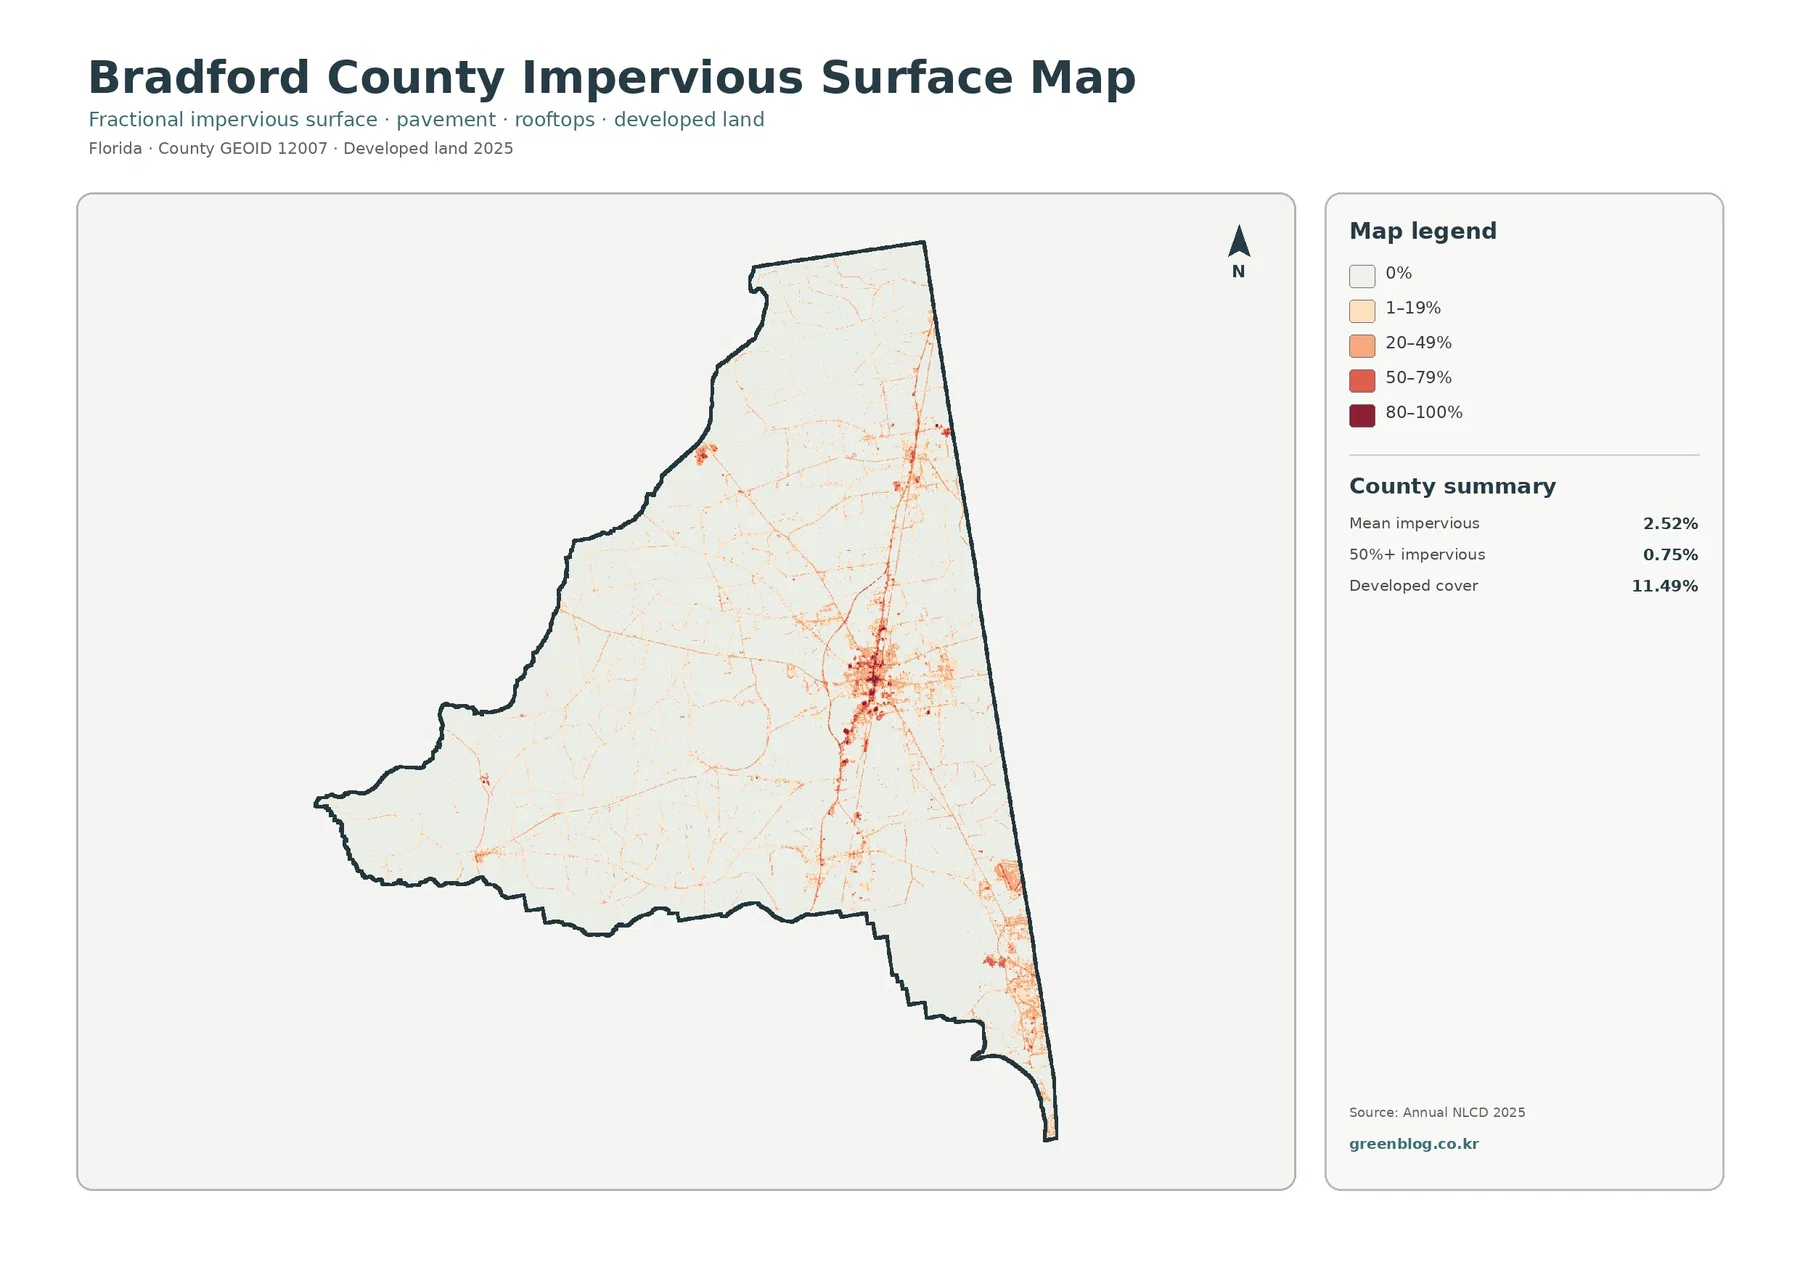
Mean impervious cover is only 2.52%, and 0.75% of the county lies in cells that are at least 50% impervious. Impervious surface means hard cover such as pavement, parking areas, and rooftops where rainfall does not easily soak into the ground. These figures are much lower than the 11.49% developed-land share because developed classes can include yards, trees, soil, and other permeable surfaces. The difference between the two statistics is especially important in a rural county with one pronounced settlement center.
The darkest cells occur around Starke, with smaller clusters and thin corridors extending north, south, and east. Much of western Bradford County remains nearly white on this map. That contrast is more informative than the county average alone: 2.52% does not describe every community equally. It is a countywide mean produced by combining a relatively concentrated urban area with a much larger landscape of farms, forest, wetlands, grass, and scattered rural development.
Bradford County’s comprehensive plan includes policies intended to keep post-development runoff rates and pollutant loads from exceeding pre-development conditions, while also protecting the functions of wetlands and floodplains. The impervious map can help identify places where hard-surface cover is concentrated, but it cannot calculate runoff or flood risk by itself. Rainfall, drainage infrastructure, soil, topography, wetlands, and watershed boundaries all need to be considered separately.
Forest and wetlands together cover more than half of the county
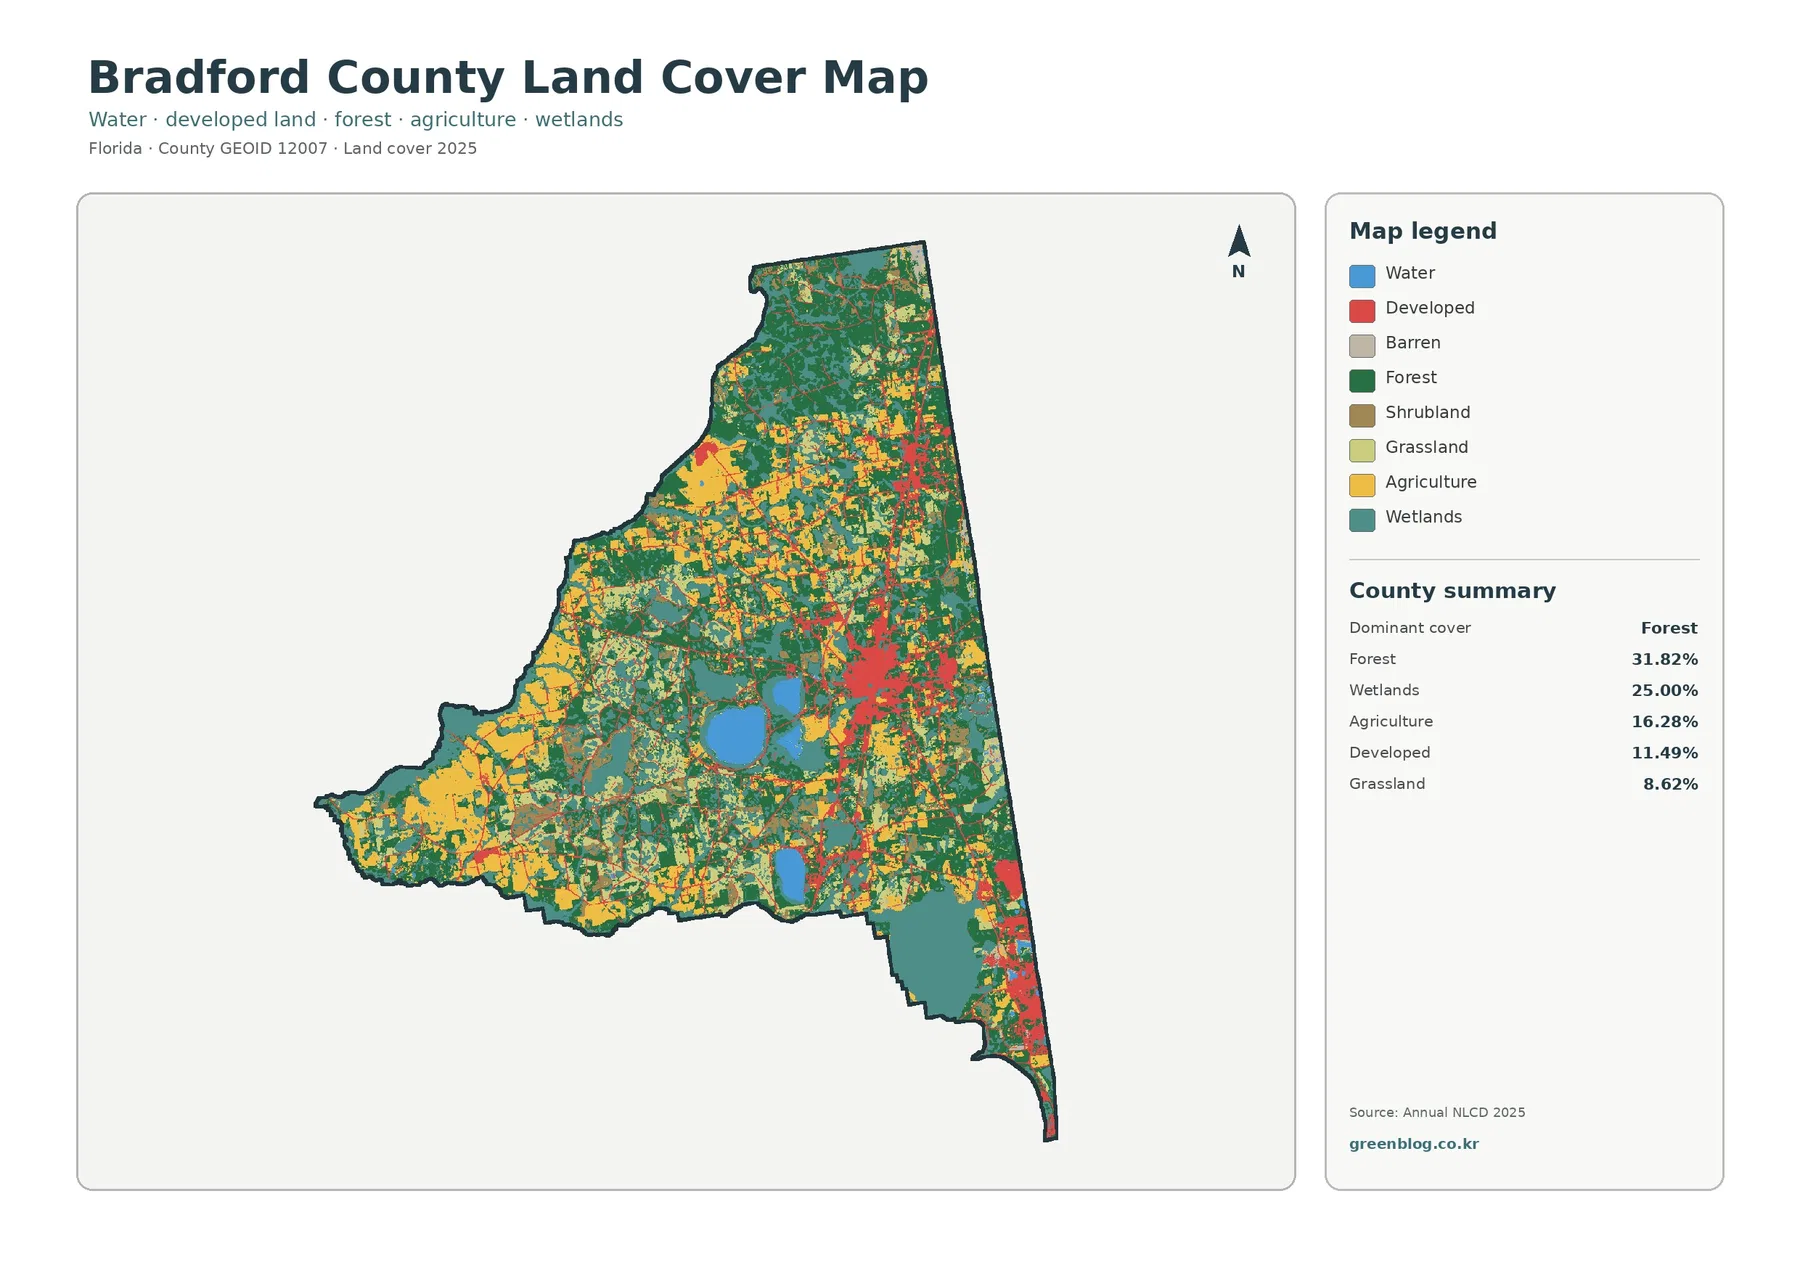
Forest is the largest class at 31.82%. It appears across the north, east, and southern margins and repeatedly fills gaps between agricultural, wetland, and developed areas. Wetlands add another 25.00%, so the two classes together reach 56.82%. The map does not show a simple forested half and wetland half; instead, dark green and teal frequently touch and intermix. This mosaic is one of the county’s defining visual characteristics.
Agriculture accounts for 16.28% and is especially prominent in the west and southwest. Bradford County’s official history describes Starke and Lawtey as historically important agricultural producers, which provides local context for why agriculture remains a visible part of the landscape. The current percentage is not a historical production statistic, however. It is a 2025 surface classification and should not be interpreted as a count of farms, harvested acreage, or agricultural value.
Developed land is 11.49%, grassland 8.62%, shrubland 4.32%, and water 2.05%. The water percentage is modest, yet several central lakes stand out clearly because they are visually large compared with the surrounding patchwork. Wetland cover around water and low-lying areas makes the hydrologic pattern more important than the 2.05% open-water number might suggest. The supplied raster is appropriate for county-scale comparison, not for tracing exact shorelines or narrow channels.
The 1985–2025 layer shows widespread change, led by the forest-loss category
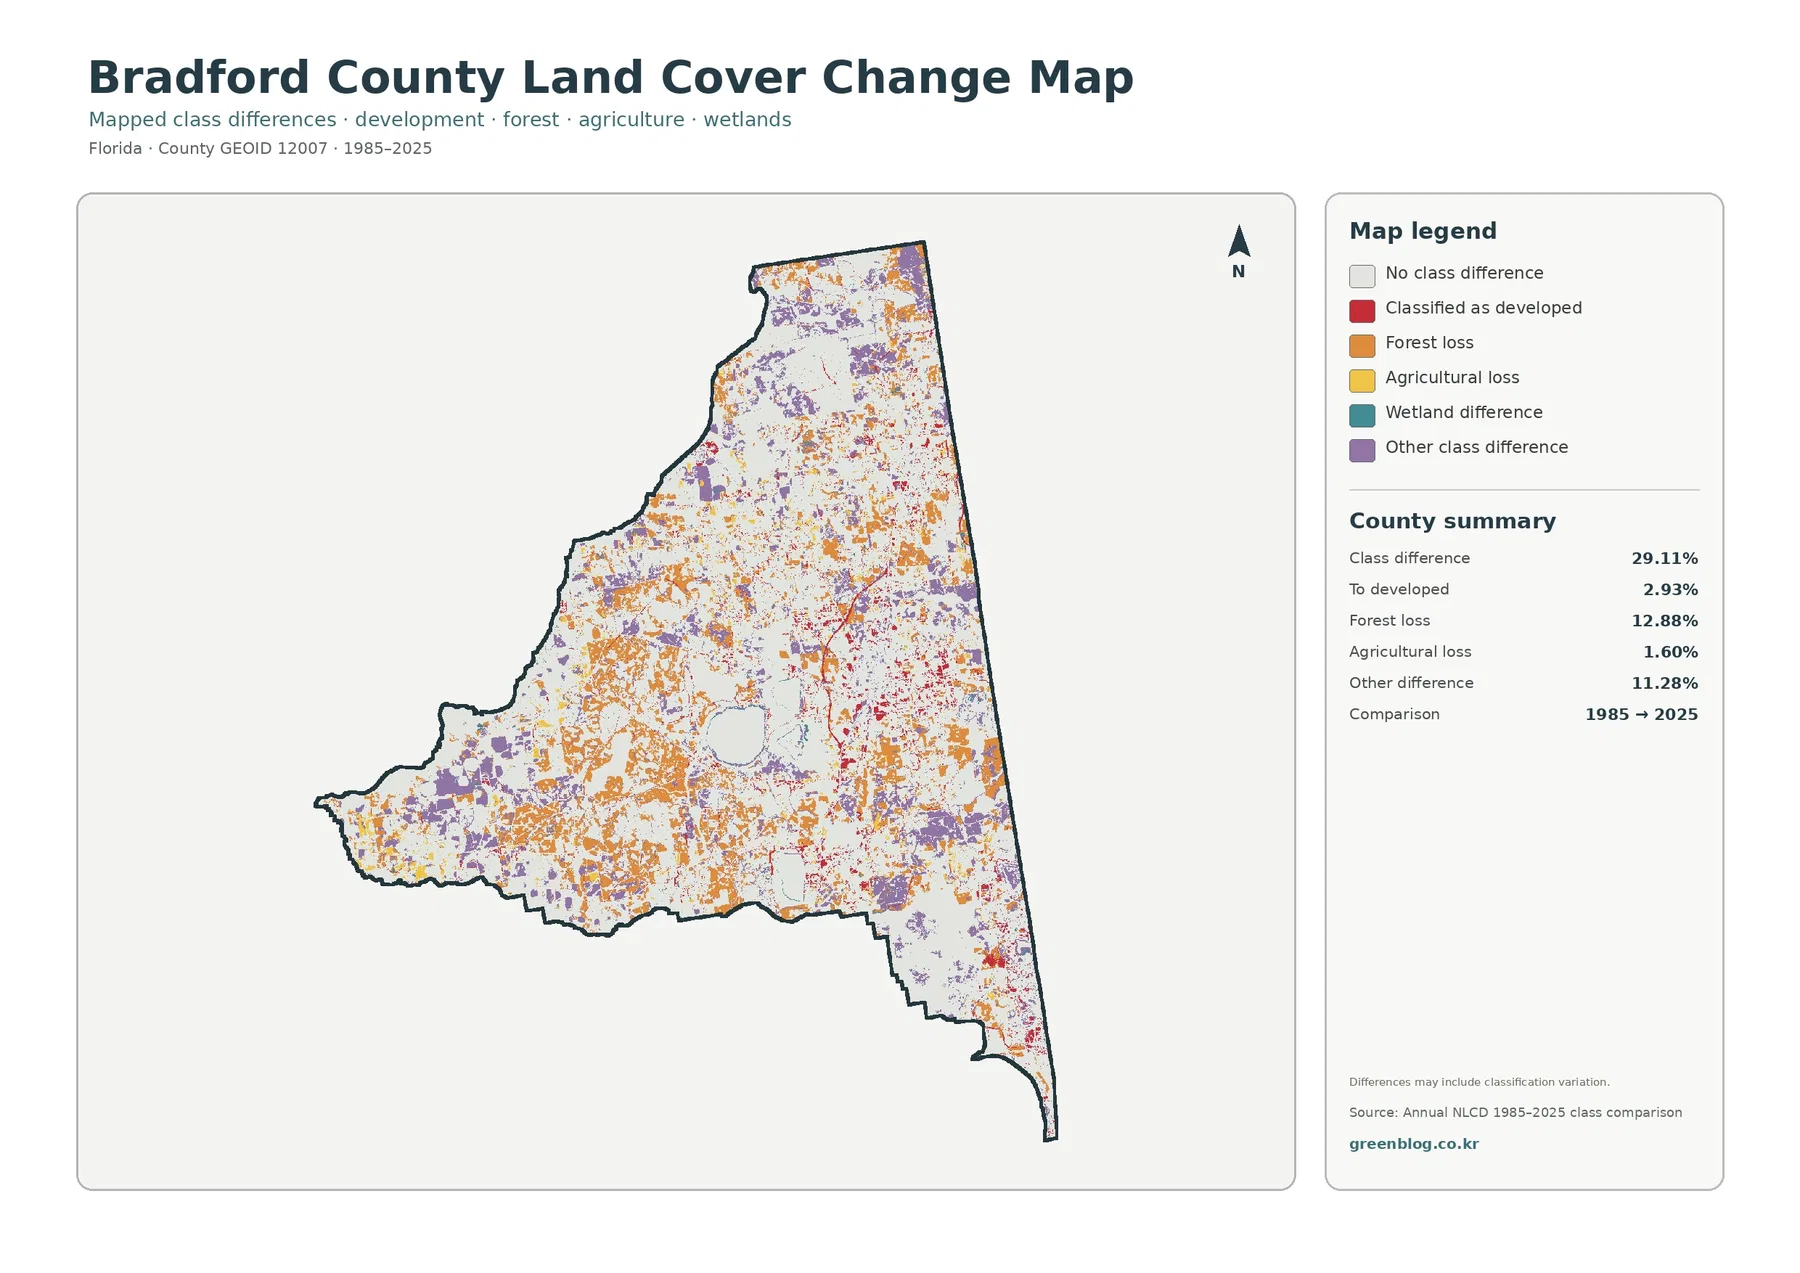
The change map reports a 29.11% class difference between 1985 and 2025. Forest loss is the largest named category at 12.88%, followed by 2.93% changed to a class mapped as developed in 2025 and 1.60% agricultural loss. Other class differences account for 11.28%. Orange forest-loss cells are scattered over a broad portion of the county, while red developed-change cells are more concentrated around the eastern settlement corridor.
The total 29.11% is not a development rate. It combines all cells whose mapped class differs between the two dates. Some differences can reflect real landscape change, while classification methods, imagery, mixed pixels, changing water conditions, and small edge shifts can also influence the comparison. Even the 2.93% “to developed” category is a land-cover result rather than a permit record, so detailed development history requires aerial photography and local planning or parcel information.
The 12.88% forest-loss category should be interpreted with the same care. Forestry, clearing, development, agricultural or grassland conversion, wetland change, disturbance, and classification variation are all possible explanations for different pixels. The map is strongest as a screening tool: identify clusters where change is dense, then investigate those locations with more detailed imagery or records instead of assigning a single cause to every orange cell.
The forest-and-farmland view separates the western agricultural belt from wetter interiors
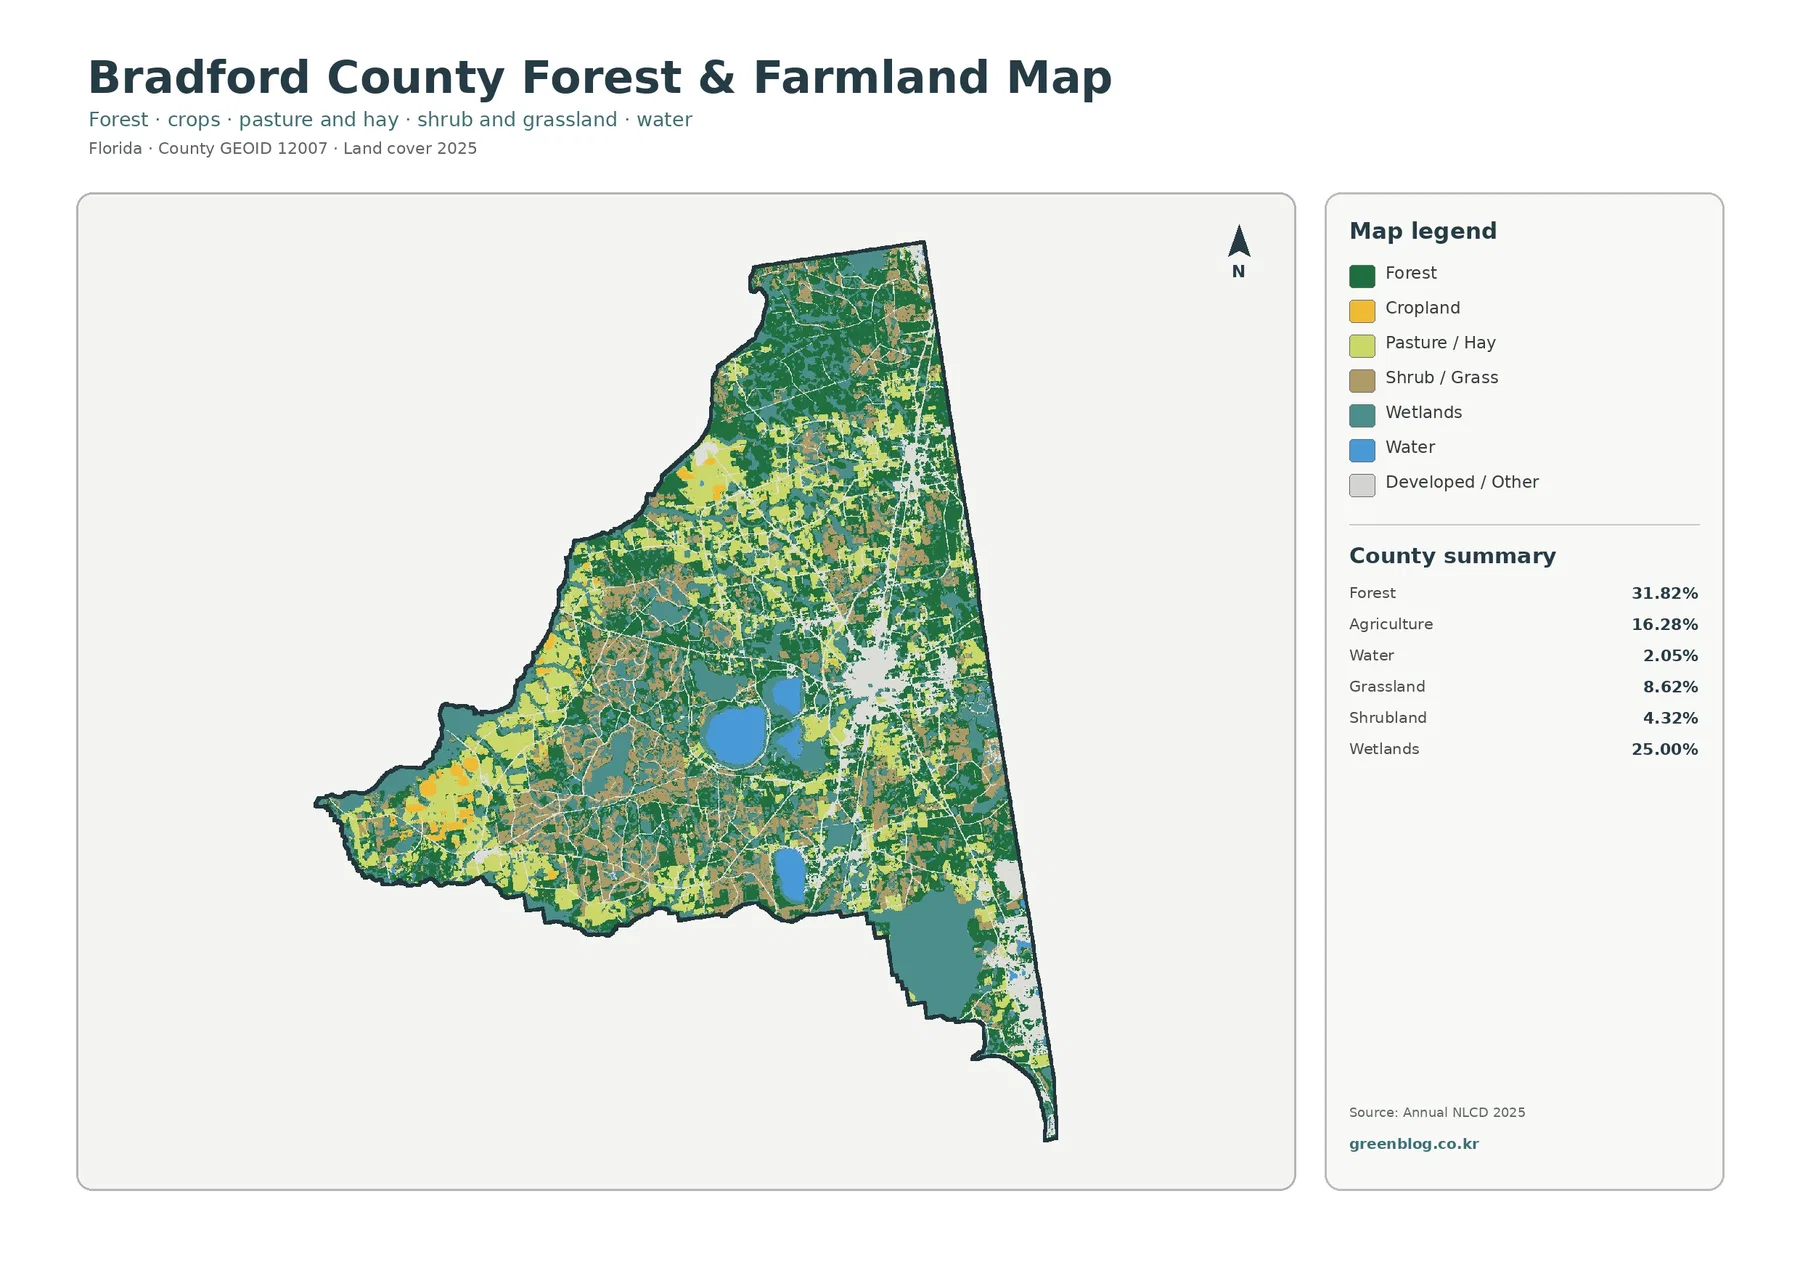
When developed and miscellaneous classes are pushed into a pale background, the western agricultural pattern becomes easier to see. Yellow agricultural cover forms broad areas in the west and southwest, while forest and wetlands dominate more of the north and east. Water bodies near the middle of the county are surrounded by a mixture of wetland, forest, agriculture, and open cover. This view is useful for showing that rural Bradford County is not one continuous agricultural landscape.
Grassland at 8.62% and shrubland at 4.32% are also significant enough to affect the map. Together they exceed twelve percent of the county. These classes occur between farms, forests, wetlands, and developed edges, creating transitions that would disappear if every open area were casually described as farmland. Keeping the classes separate is especially important when the map is used for habitat, land-change, or environmental education.
The 16.28% agriculture figure is countywide and should not be assigned to Brooker, Starke, Lawtey, Hampton, or any individual property. NLCD classifies the surface; it does not identify farm ownership, crop type at parcel scale, farm income, or whether a field is actively managed in a particular season. For a county overview, the percentage and spatial concentration are useful. For agricultural operations or land-use regulation, other datasets are required.
Central water bodies and extensive wetlands deserve separate attention from zoning maps
Several sizable water bodies in central Bradford County provide useful reference points when reading the general and forest/farmland maps. Open water is only 2.05% of the county, but wetlands cover 25.00%, so the broader wet landscape is much larger than the blue areas alone. The county’s comprehensive plan defines surface water broadly and addresses lakes, streams, channels, and wetlands as resources that require protection in development review.
The same plan requires a natural buffer around wetlands in its policy framework and calls for maintaining the natural functions of wetlands and 100-year floodplains. Those rules illustrate why a mapped wetland pattern can matter to planning, but the NLCD image cannot determine where a regulatory buffer begins. A 30-meter raster cell is generalized, and a legal or engineering decision needs the county’s official zoning, flood, wetland, or water-management data.
Bradford County’s GIS access page links road and FDOT data as well as land-use, flood-zone, and topographic information from partner agencies. That makes the county map set useful as a first step rather than a final answer. A reader can locate a broad forest, wetland, farm, or developed pattern here and then move to the official GIS when a project needs an exact road, parcel, municipal boundary, or flood designation.
Use the four maps as a sequence rather than four versions of the same picture
For a county profile, the full land-cover map works best first because it introduces the forest-wetland mosaic, western agriculture, central lakes, and eastern development in one view. The impervious map should be used when the question turns to development intensity around Starke and the main transportation corridor. The forest-and-farmland map is better for the rural and natural landscape, and the change layer belongs after the 2025 views so the reader has a current reference before interpreting four decades of class differences.
The asset manifest records each original JPG at 2480 by 1754 pixels. The package does not mark those dimensions as meeting its A3 high-resolution reference, so very large printing should be tested before final use. In reports, lessons, and presentations, keep the original aspect ratio and retain the legend and County summary. Those elements contain the definitions and percentages needed to understand what each color means.
Thirty-meter cells and countywide percentages define the map’s proper scale
Annual NLCD is designed for consistent land-cover comparison across large areas and commonly uses a Landsat-based 30-meter grid. One cell may contain trees, a road edge, grass, wet soil, and water at the same time. The land-cover product assigns a representative class, while the impervious product estimates hard-surface percentage. Zooming the exported map cannot create parcel-level detail that did not exist in the source raster.
The land-cover, forest-and-farmland, and impervious views describe 2025 conditions, while the change map compares 1985 with 2025. Development, road work, forestry, agricultural changes, or wetland conditions after the observation period may not appear. This is particularly relevant near transportation projects and growth areas, where recent aerial imagery and Bradford County GIS should be checked if the current condition matters.
Finally, every percentage shown here is countywide. Forest at 31.82%, wetlands at 25.00%, and mean impervious cover at 2.52% are not separate values for Starke, Lawtey, Hampton, or Brooker. Smaller-area statistics require the original raster clipped to a correct municipal, watershed, road-corridor, park, or parcel boundary.
Frequently Asked Questions
Which land-cover classes are largest in Bradford County in 2025?
Forest is the largest at 31.82%, followed by wetlands at 25.00%, agriculture at 16.28%, and developed land at 11.49%. Forest and wetlands together cover more than half of the county.
Which map best shows the Starke development concentration?
The impervious-surface map is the clearest view of development intensity. Bradford County averages 2.52% impervious cover, but the darkest concentration appears around the Starke area. Exact roads and boundaries should be checked in the county GIS.
Does the 29.11% 1985–2025 class difference mean that 29.11% of Bradford County was developed?
No. It is the share of cells with any different mapped class between the two dates. The map identifies 2.93% as changes classified as developed in 2025, and some differences may reflect classification variation.
Sources and reference material
- MRLC Annual NLCD Data – source land-cover and impervious data
- USGS Annual NLCD Land Cover Classification – class definitions and interpretation
- U.S. Census Bureau TIGER/Line Shapefiles – county-boundary reference
- Bradford County Government – official county and municipality context
- Bradford County GIS Access – road, Starke 301 Bypass, land-use, flood, and topographic resources
- Bradford County Comprehensive Plan – wetland, surface-water, buffer, and natural-resource policies
Map File Information
Download the four original JPG maps in one ZIP: 2025 land cover, forest and farmland, impervious/developed land, and the 1985–2025 land-cover change comparison.
- Included Files: 4 JPG maps
Related Maps
- Alachua County Florida Land Cover Map
- Baker County Florida Land Cover Map
- Bay County Florida Land Cover Map
Green Map creates custom-edited map images using open geographic data sources such as geoBoundaries, Natural Earth, OpenStreetMap, and government open data.
These maps are edited visual materials, not raw data files, and are provided for education, documents, presentations, and graphic reference.