The Pickens County Alabama Land Cover Map set shows how forest, wetlands, agriculture, developed land, water, and other surface-cover classes are distributed across this western Alabama county in 2025. Forest is the largest mapped class at 48.42%, while wetlands account for 20.85% and agriculture for 13.52%. The broad wooded interior contrasts with a wetter and more agricultural southwest, where the Tennessee-Tombigbee Waterway provides useful geographic context for the pattern.
Four views are included on this page: current land cover, forest and farmland, impervious surface/developed land, and mapped change from 1985 to 2025. The WebP images are convenient for reading online, and the four original 2480 × 1754 JPG maps are available together in one ZIP download. They are useful for county-scale reference, classroom work, presentations, and environmental comparison, but they are not parcel maps, zoning records, wetland determinations, or engineering surveys.
Table of Contents
A 2025 landscape led by forest and wet ground
Pickens County does not read as a single uniform block on the 2025 map. Large forest areas cover much of the north, east, and interior, but they are interrupted by agricultural openings, wetland corridors, shrub and grass cover, and several compact developed centers. The southwest stands apart because agriculture, wetlands, and open water appear more frequently there. That contrast is important: saying that the county is “mostly forest” is true at the broadest level, but it would hide the substantial wetland share and the locally important farmed areas.
The county summary helps put the colors in perspective. Forest accounts for 48.42%, wetlands 20.85%, agriculture 13.52%, developed land 5.75%, and shrubland 5.52%. In the forest-and-farmland view, grassland is listed at 4.53% and open water at 1.34%. These percentages describe mapped surface cover, not legal land use. A green cell does not tell you who owns the property, and a yellow agricultural cell does not establish a zoning designation or guarantee that a specific crop was present on a particular field.
The general map shows the county’s strongest contrasts at once
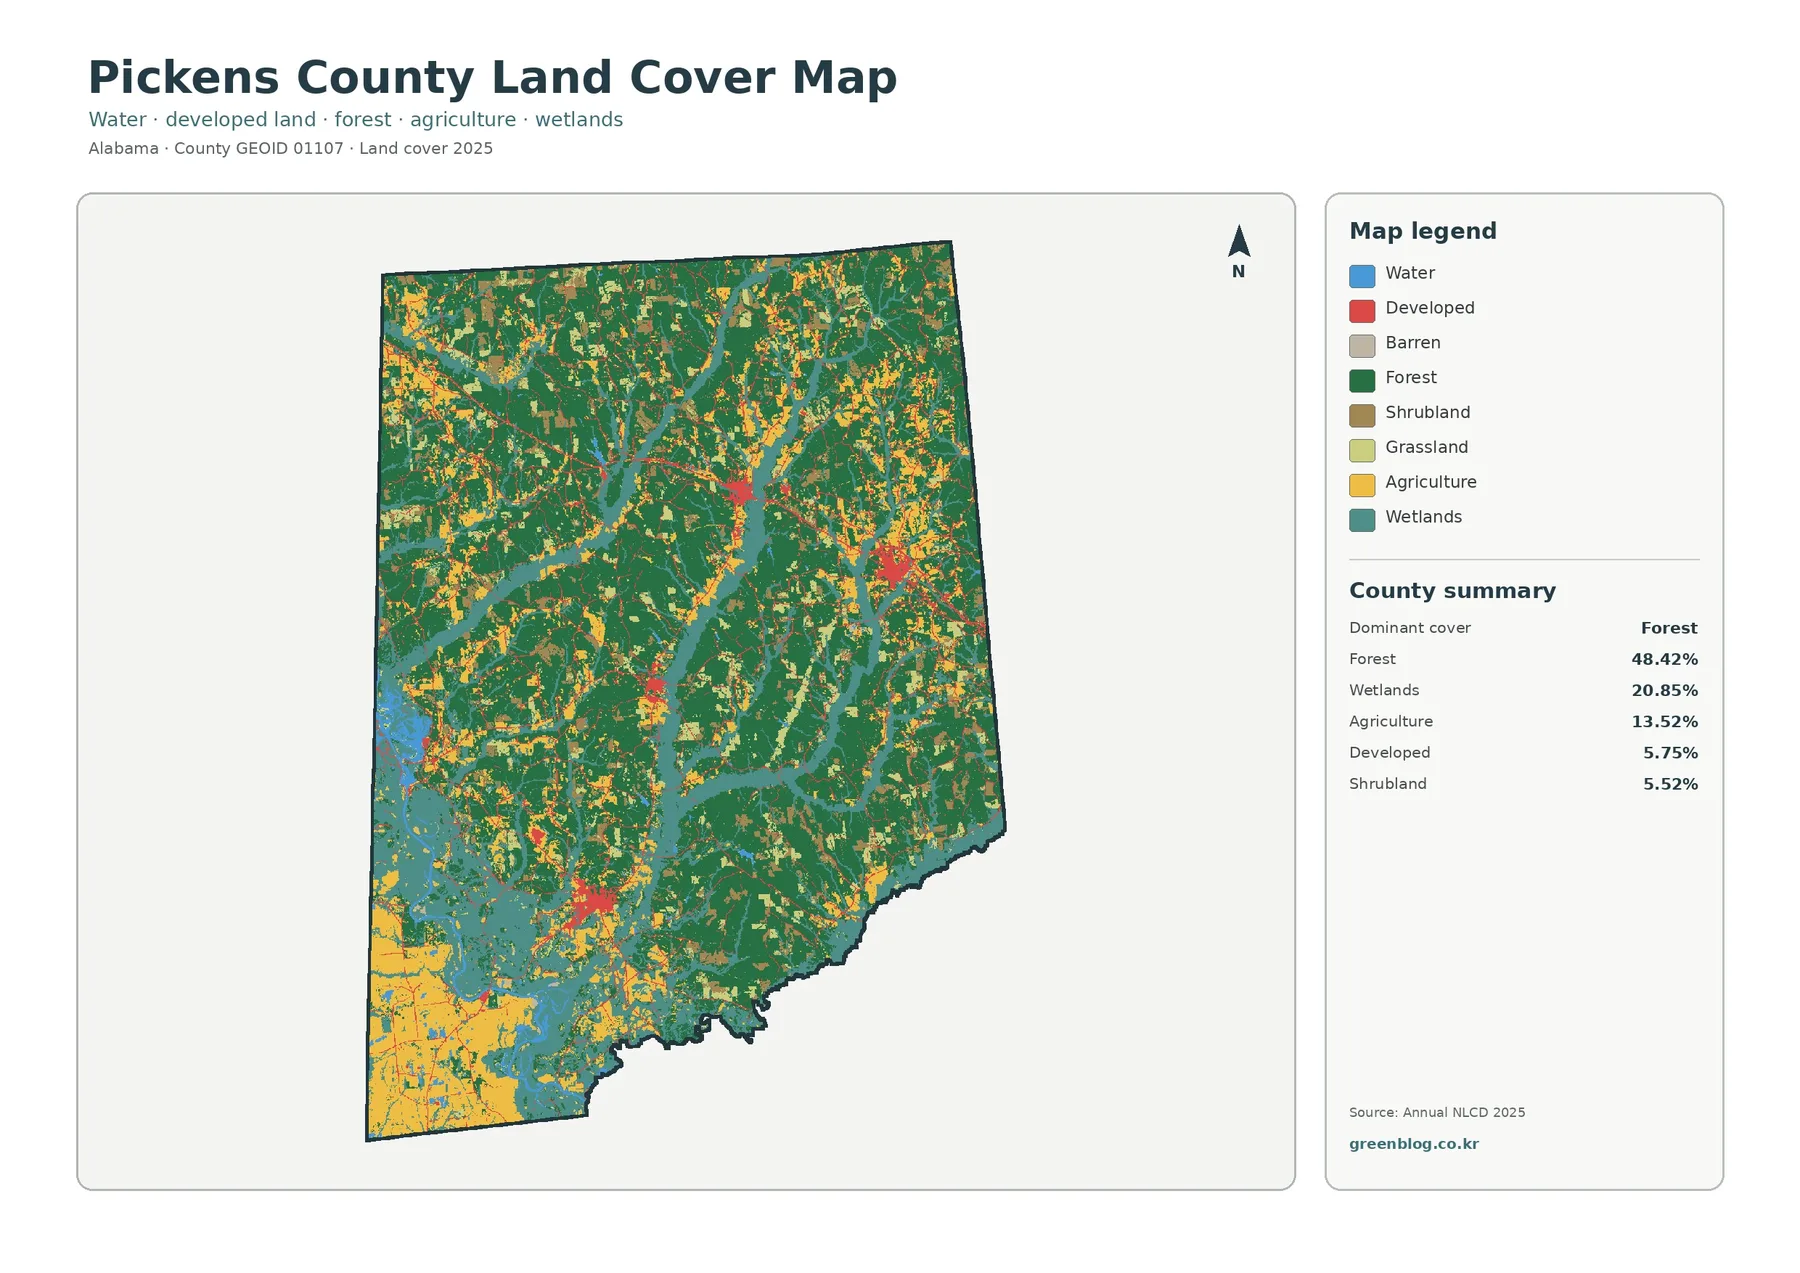
The general map is the best starting point because it keeps the major classes together. Dark green forest forms large connected areas across the county. Yellow agricultural cover is broken into many smaller patches, with a much broader concentration in the southwest. Teal wetlands form branching corridors and broad low-lying areas, especially toward the southwestern part of the county. Red developed land is easy to spot because it is concentrated in a handful of small centers and narrow connecting traces rather than spread evenly across the map.
The southwestern concentration of water and wetlands has a real geographic setting. U.S. Army Corps of Engineers material for the Tennessee-Tombigbee Waterway identifies Aliceville Lake and Pickens County locations such as Pickensville along the system. That does not mean every teal pixel on the land-cover map belongs to the waterway, but it helps explain why this part of the county deserves separate attention when reading the wetland and water classes. The map should not be used to infer flood depth, regulatory flood zones, or navigable boundaries.
Hard surfaces stay concentrated around small settlement centers
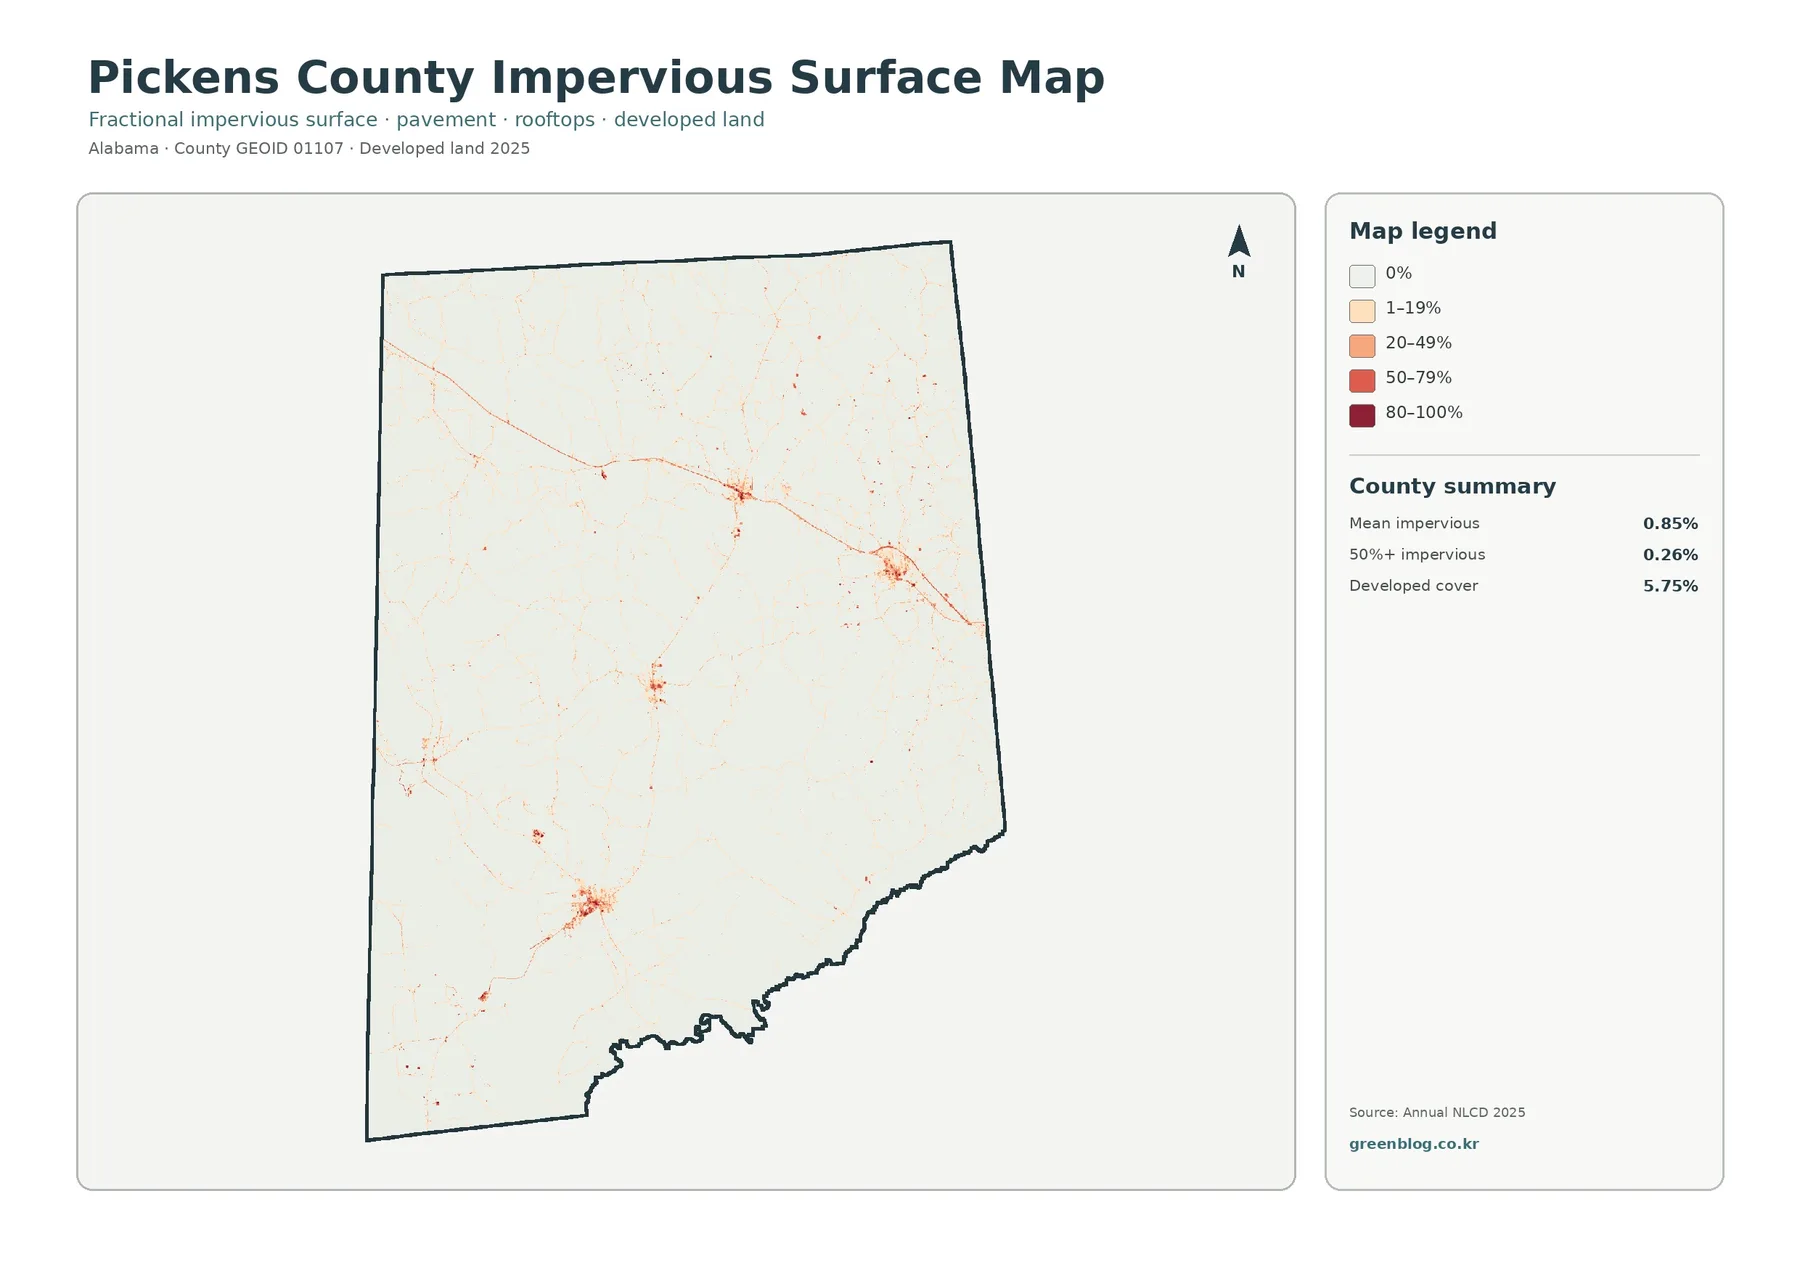
Impervious surface is a technical term for hard cover such as rooftops, paved roads, and parking areas where water does not readily soak into the ground. On the Pickens County map, most of the county is nearly white, while orange and red values appear in compact clusters and thin lines. The mean impervious value is only 0.85%, and the area mapped at 50% or greater imperviousness is 0.26%. Those numbers are consistent with a landscape where built surfaces are locally important but occupy a small share of the county as a whole.
Forest remains dominant, but the southwest carries more farm and wetland cover
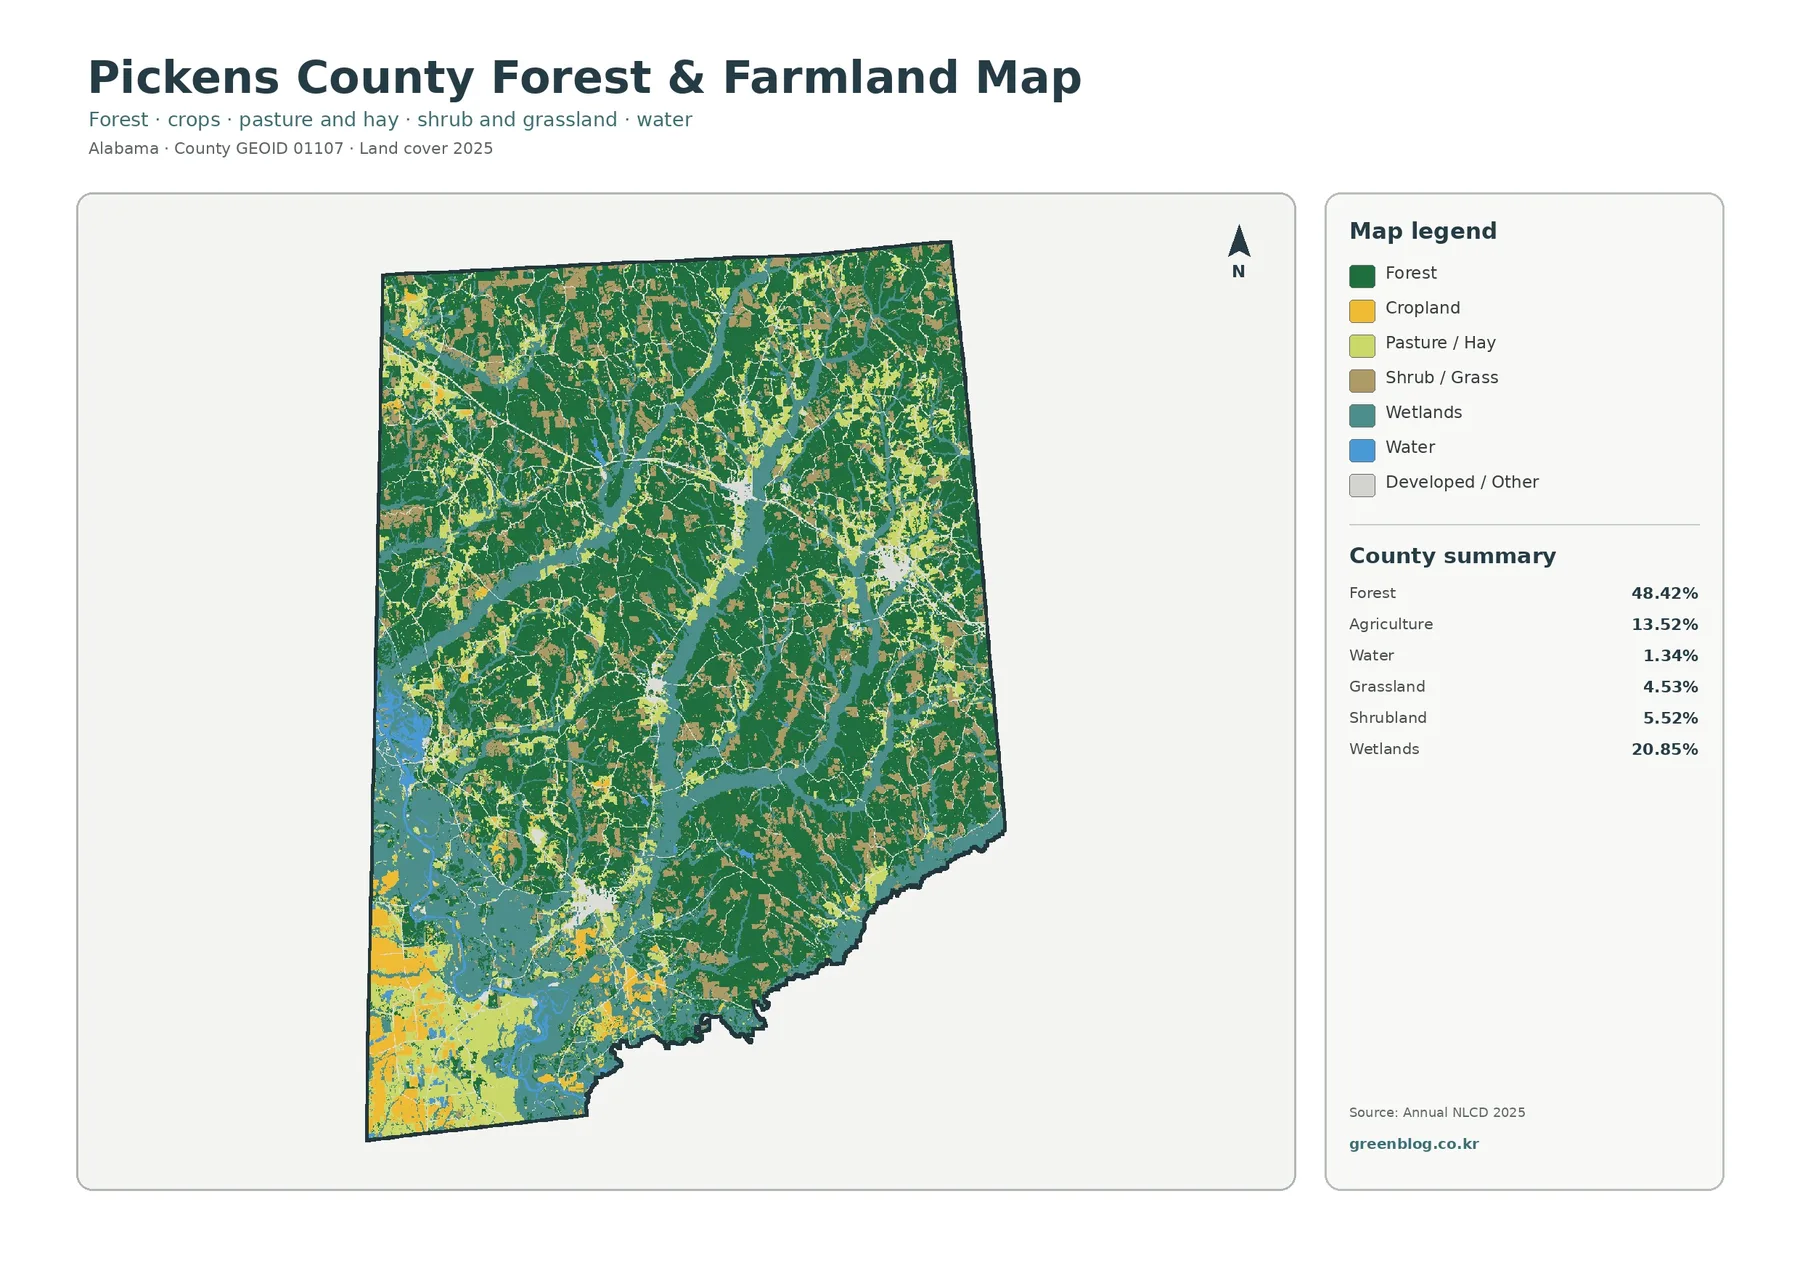
Removing some of the detail from the general map makes the forest-farm relationship much easier to see. Forest covers 48.42% and remains the dominant class, with broad green blocks across the north, east, and central portions of the county. Agricultural cover, at 13.52%, appears as smaller openings throughout the wooded landscape and expands more noticeably in the southwest. That southern and southwestern concentration is one of the clearest county-specific patterns in the supplied images.
Wetlands make up 20.85% while mapped open water is 1.34%. The large difference between those values is important. Most of the wet portion of the county is not shown as open blue water; much of it is classified as wetland, where vegetation and saturated or frequently wet ground are part of the surface cover. The Tennessee-Tombigbee Waterway and Aliceville Lake give a recognizable local reference for the southwest, but the Annual NLCD wetland class is not the same as a regulatory wetland boundary drawn for permitting or jurisdictional decisions.
The 1985–2025 map records many class differences, not one simple development trend
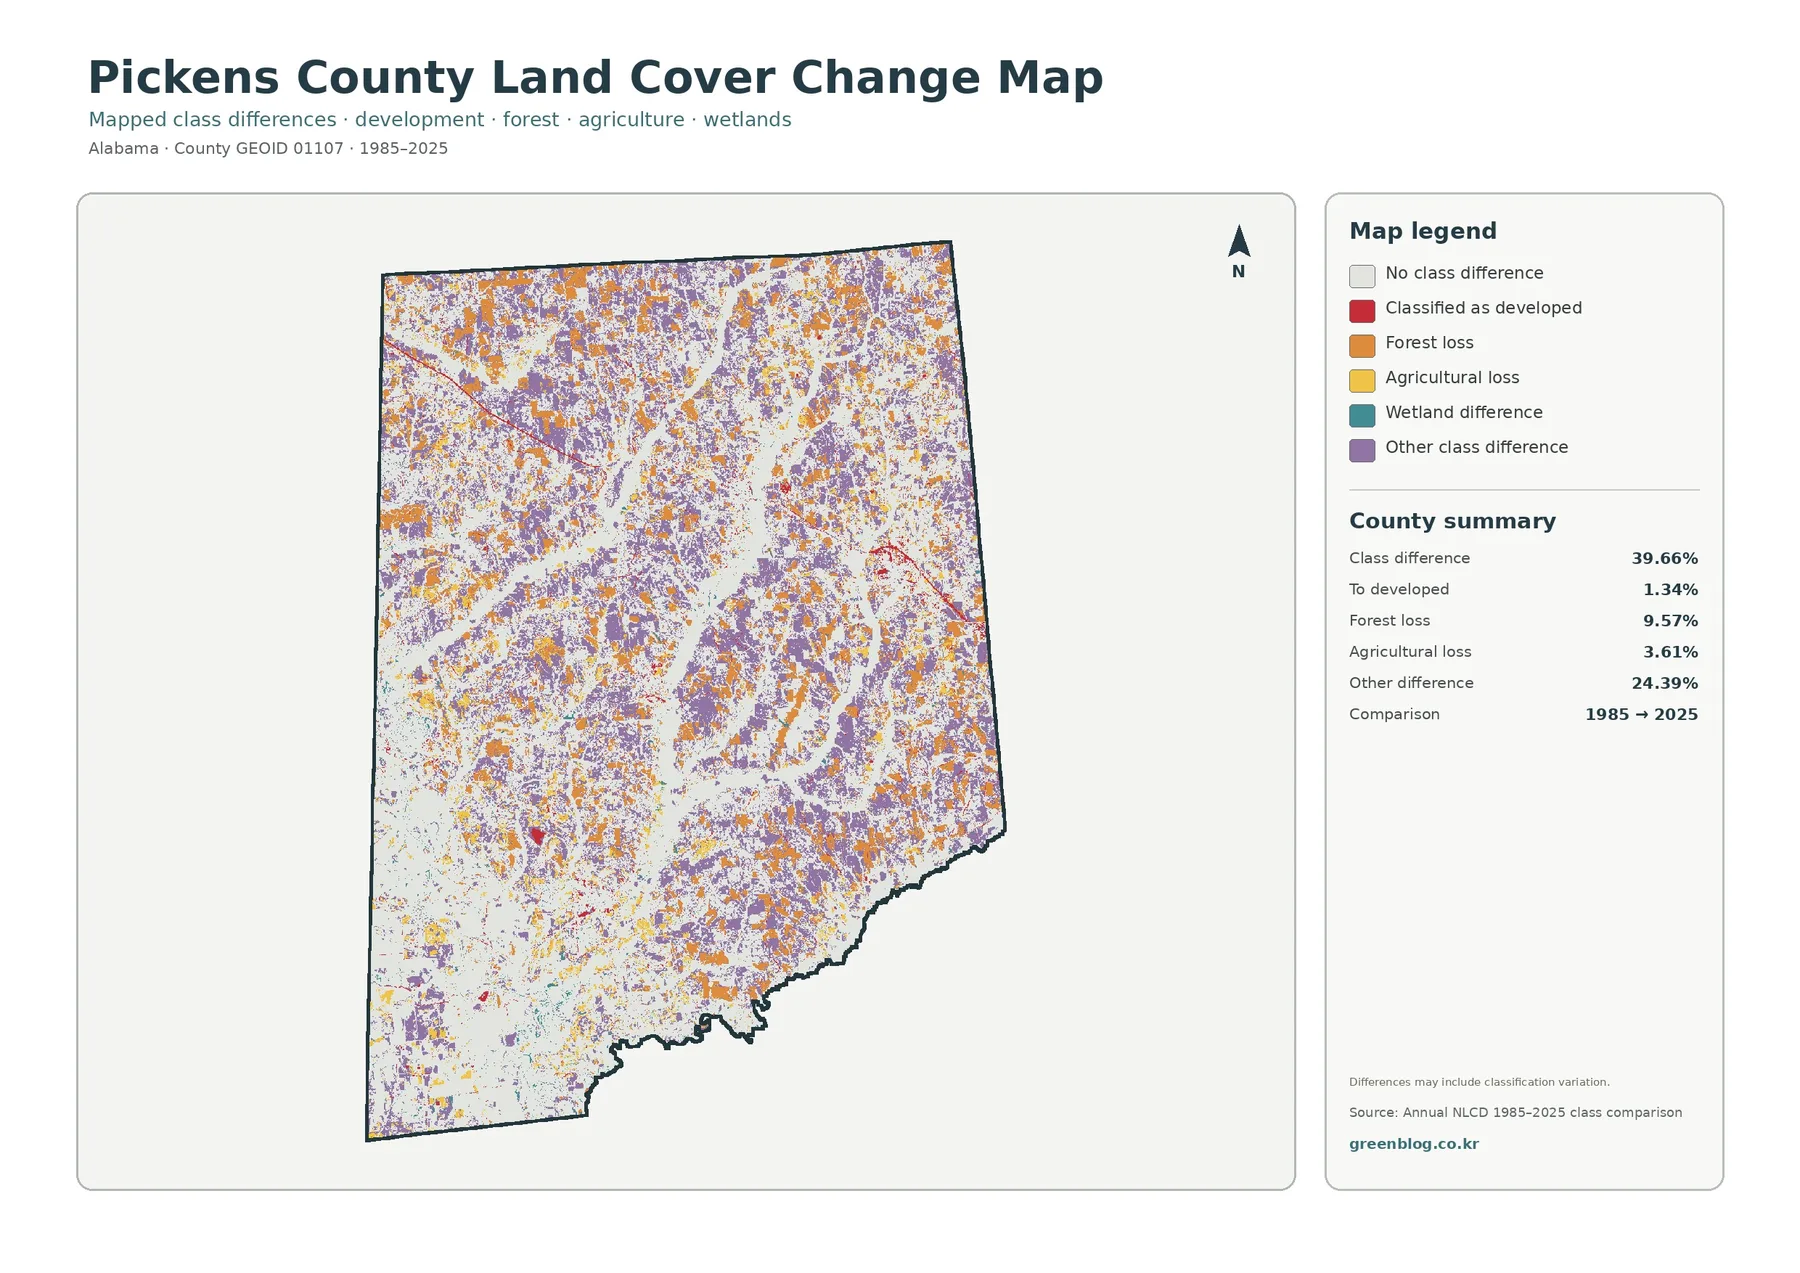
The change map is visually busier than the current-cover views because it asks a different question: did a location receive the same broad land-cover class in 1985 and 2025? The county summary reports a 39.66% class difference. Within that total, 1.34% is mapped as a change to developed, 9.57% as forest loss, 3.61% as agricultural loss, and 24.39% as other class difference. The large “other” category is one reason the overall 39.66% figure should never be described as the percentage of the county that was developed.
Orange forest-loss and purple other-difference patches are scattered through much of Pickens County, while red changes to developed land remain more localized. White areas show places with no mapped class difference between the two comparison years. The result is a patchwork rather than a single expanding front. That pattern suggests that the map is best used to locate areas for follow-up, not to tell a complete story about why every change occurred.
Where these maps are most useful
Download the four Pickens County land-cover JPG maps
Important limits before using the maps for a decision
Annual NLCD products for the conterminous United States are raster datasets produced at 30-meter spatial resolution. A 30-meter cell is large enough to contain more than one real-world surface, so a narrow road beside trees or a small building inside grass may not appear as a separate feature. The displayed boundary is appropriate for county-scale thematic comparison, but the colored edges should not be treated like surveyed property lines. Mixed pixels and classification choices are normal limitations of this kind of regional land-cover product.
Frequently Asked Questions
What is the largest land-cover class in Pickens County in 2025?
Forest is the largest mapped class at 48.42%. Wetlands are next at 20.85%, followed by agriculture at 13.52%. The general map shows forest across much of the county, while agriculture, wetlands, and water become more prominent in the southwest.
Can the 20.85% wetland value be used as a legal wetland boundary?
No. The value comes from a broad land-cover classification and is useful for county-scale comparison. Regulatory or jurisdictional wetland work requires the appropriate agency data, field methods, and current site information. The mapped wetland class should be treated as thematic surface-cover information rather than a permit boundary.
Does the 39.66% class difference mean that 39.66% of the county became developed?
No. The 39.66% figure is the total share of cells whose broad class differs between the 1985 and 2025 comparison. The map separately reports 1.34% as classified to developed, 9.57% forest loss, 3.61% agricultural loss, and 24.39% other difference. Classification variation can also contribute to mapped differences.
What is included in the downloadable ZIP?
The ZIP contains four 2480 × 1754 JPG images: the 2025 general land-cover map, the forest-and-farmland map, the impervious/developed-land map, and the 1985–2025 land-cover change map. The WebP files used in the article are web previews and are separate from the four JPG files in the download package.
Map File Information
Pickens County Land Cover Map Files
- Printable Size: 2480 × 1754 pixels each
Related Maps
- Autauga County Alabama Land Cover Map
- Baldwin County Alabama Land Cover Map
- Barbour County Alabama Land Cover Map
Sources
- MRLC Annual NLCD Data — access to Annual NLCD products, including the current 1985–2025 series
- USGS Annual NLCD Land Cover Classification — official description of the land-cover classes and legend
- U.S. Census Bureau TIGER/Line Shapefiles — official county boundary data used for geographic identity
- Pickens County Alabama — county-specific information on municipalities, transportation, and waterways
- U.S. Army Corps of Engineers Tennessee-Tombigbee Waterway Maps — official map references for Aliceville Lake and Pickens County waterway context
Green Map creates custom-edited map images using open geographic data sources such as geoBoundaries, Natural Earth, OpenStreetMap, and government open data.
These maps are edited visual materials, not raw data files, and are provided for education, documents, presentations, and graphic reference.