The Pike County Alabama Land Cover Map set gives a 2025 countywide view of forest, agriculture, wetlands, developed land, water, grassland, and shrub cover in southeastern Alabama. Forest is the largest mapped class at 43.85%, but agriculture is also substantial at 23.57%. The most obvious built-up concentration sits around Troy, while farm openings, wooded tracts, and wet corridors repeat across the rest of the county.
This page includes four map views so the same landscape can be checked from different angles: current land cover, forest and farmland, impervious surface, and class differences between 1985 and 2025. The web previews are provided in WebP, while all four original 2480 × 1754 JPG maps are available in one ZIP download. They work well for county reference, lessons, presentations, and broad environmental comparison, but not for parcel, zoning, permitting, or engineering decisions.
Table of Contents
Troy stands out sharply against a mostly rural county
Before looking at every land-cover class, the developed pattern provides an easy geographic anchor. Troy is the county seat and the largest urban center in Pike County. In the supplied images, one strong cluster of developed and impervious cover appears near the center-southwestern part of the county, consistent with Troy’s location. A smaller cluster lies farther southeast in the direction of Brundidge, which is located along U.S. Highway 231. Outside those centers, built surfaces become sparse very quickly.
Impervious cover is concentrated in a few centers and thin road traces
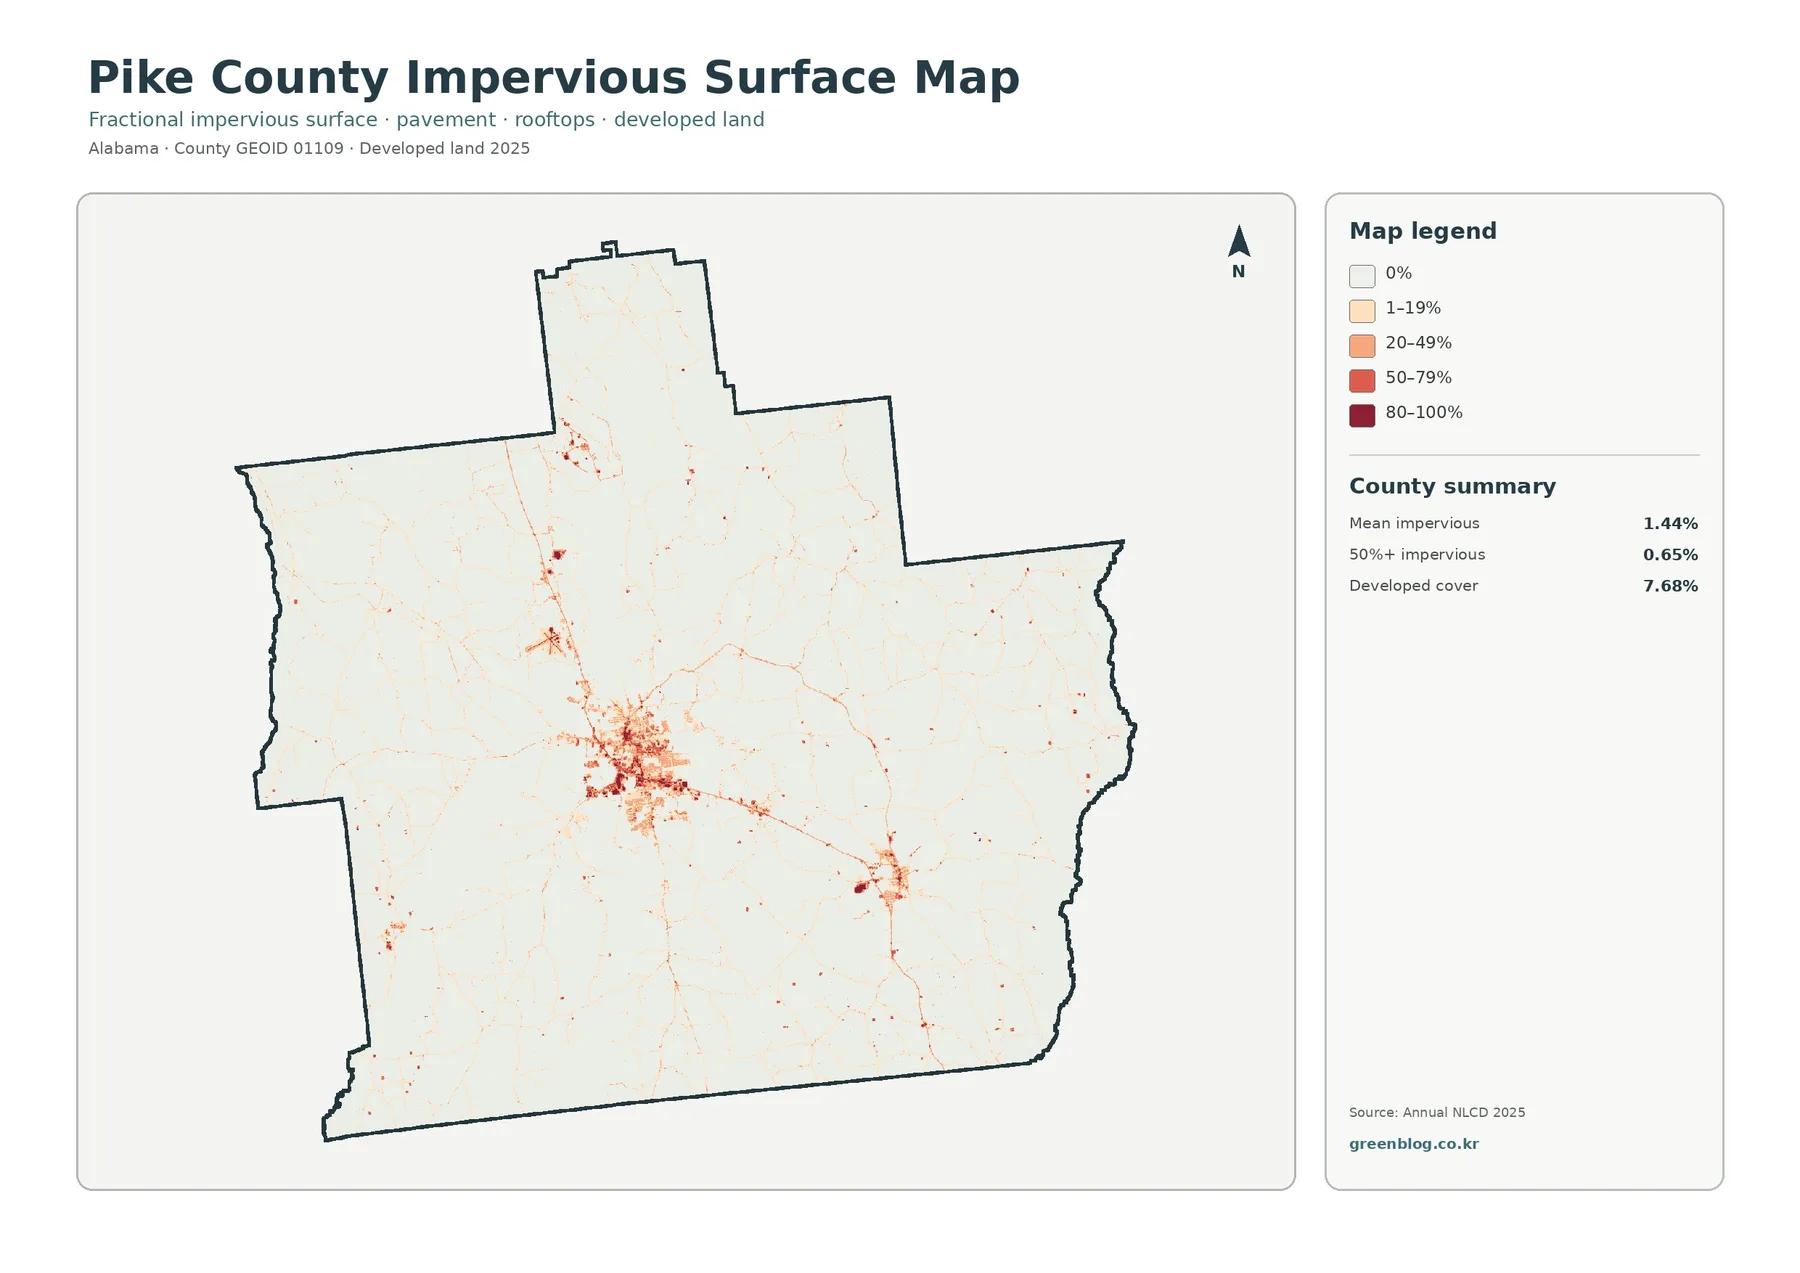
Impervious surface means pavement, rooftops, parking areas, and similar cover where rainfall cannot easily soak into the ground. Most of Pike County is nearly white on this map, indicating very low values. Orange and red pixels gather tightly around the main Troy cluster, with smaller concentrations near other settlements and narrow lines that follow transportation corridors. Only 0.65% of the county is shown at 50% or greater imperviousness, reinforcing the impression that high-intensity hard surfaces occupy a small portion of the county.
The current map shows forest and farms interwoven across Pike County
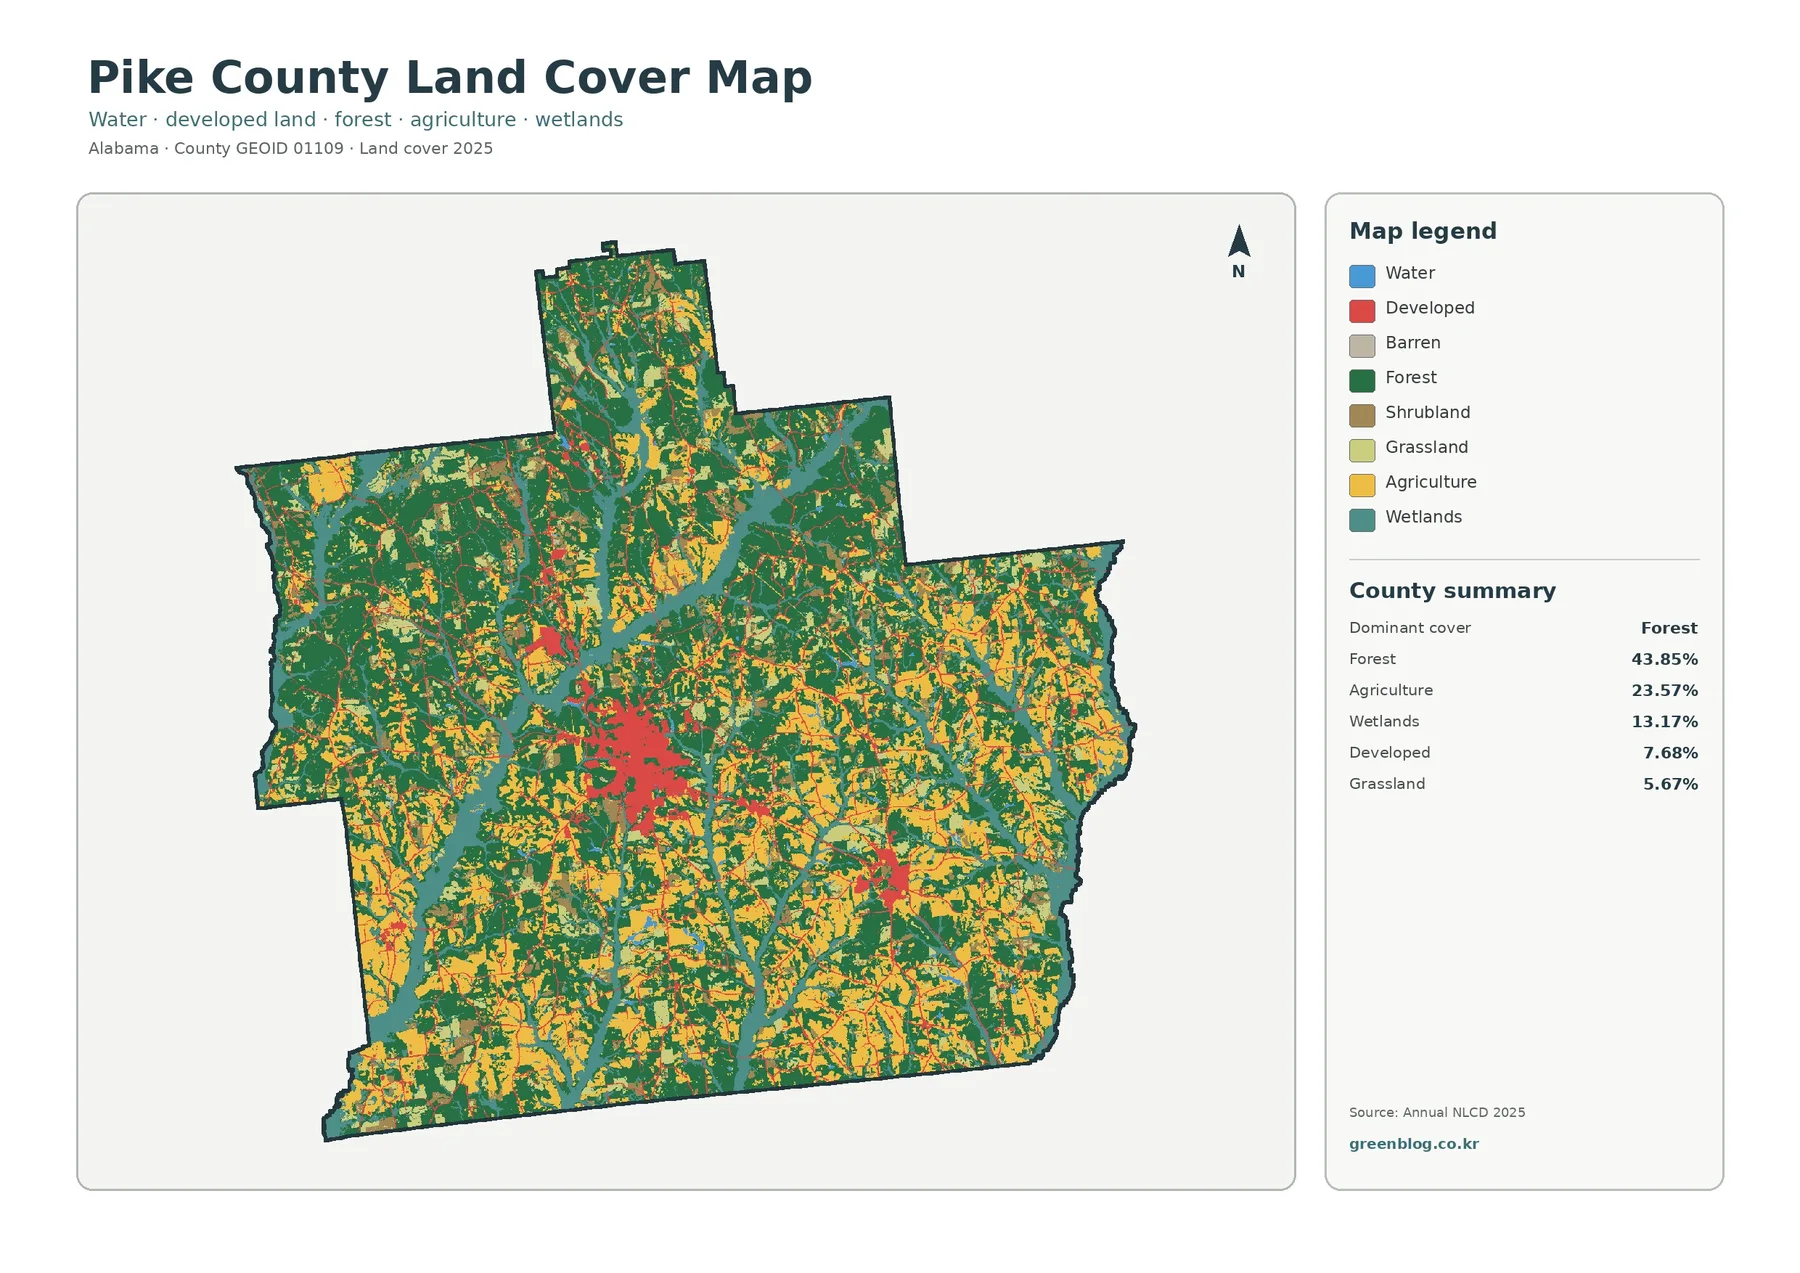
The general view is more balanced than a simple “forest county” label would suggest. Dark green forest is the largest class and forms broad patches in the north, northwest, center, and other parts of the county. Yellow agricultural cover is almost everywhere as well, appearing in many small and medium openings rather than one continuous farm belt. Teal wetlands branch through the landscape, while red developed cover is strongly concentrated around Troy and a smaller southeastern center. Together, those colors create a patchwork rather than a single dominant surface from edge to edge.
Wet areas deserve separate attention. USGS monitoring metadata places the Conecuh River near Troy in Pike County, while Alabama’s Outdoor Alabama resource notes that the Pea River forms part of the boundary between Barbour and Pike counties. The map’s teal wetland corridors and eastern-edge wet areas fit that river-rich setting. This geographic context is helpful, but the Annual NLCD wetland class should not be substituted for a jurisdictional wetland determination or a regulatory flood map.
The forest-and-farmland view reveals a strong rural mosaic
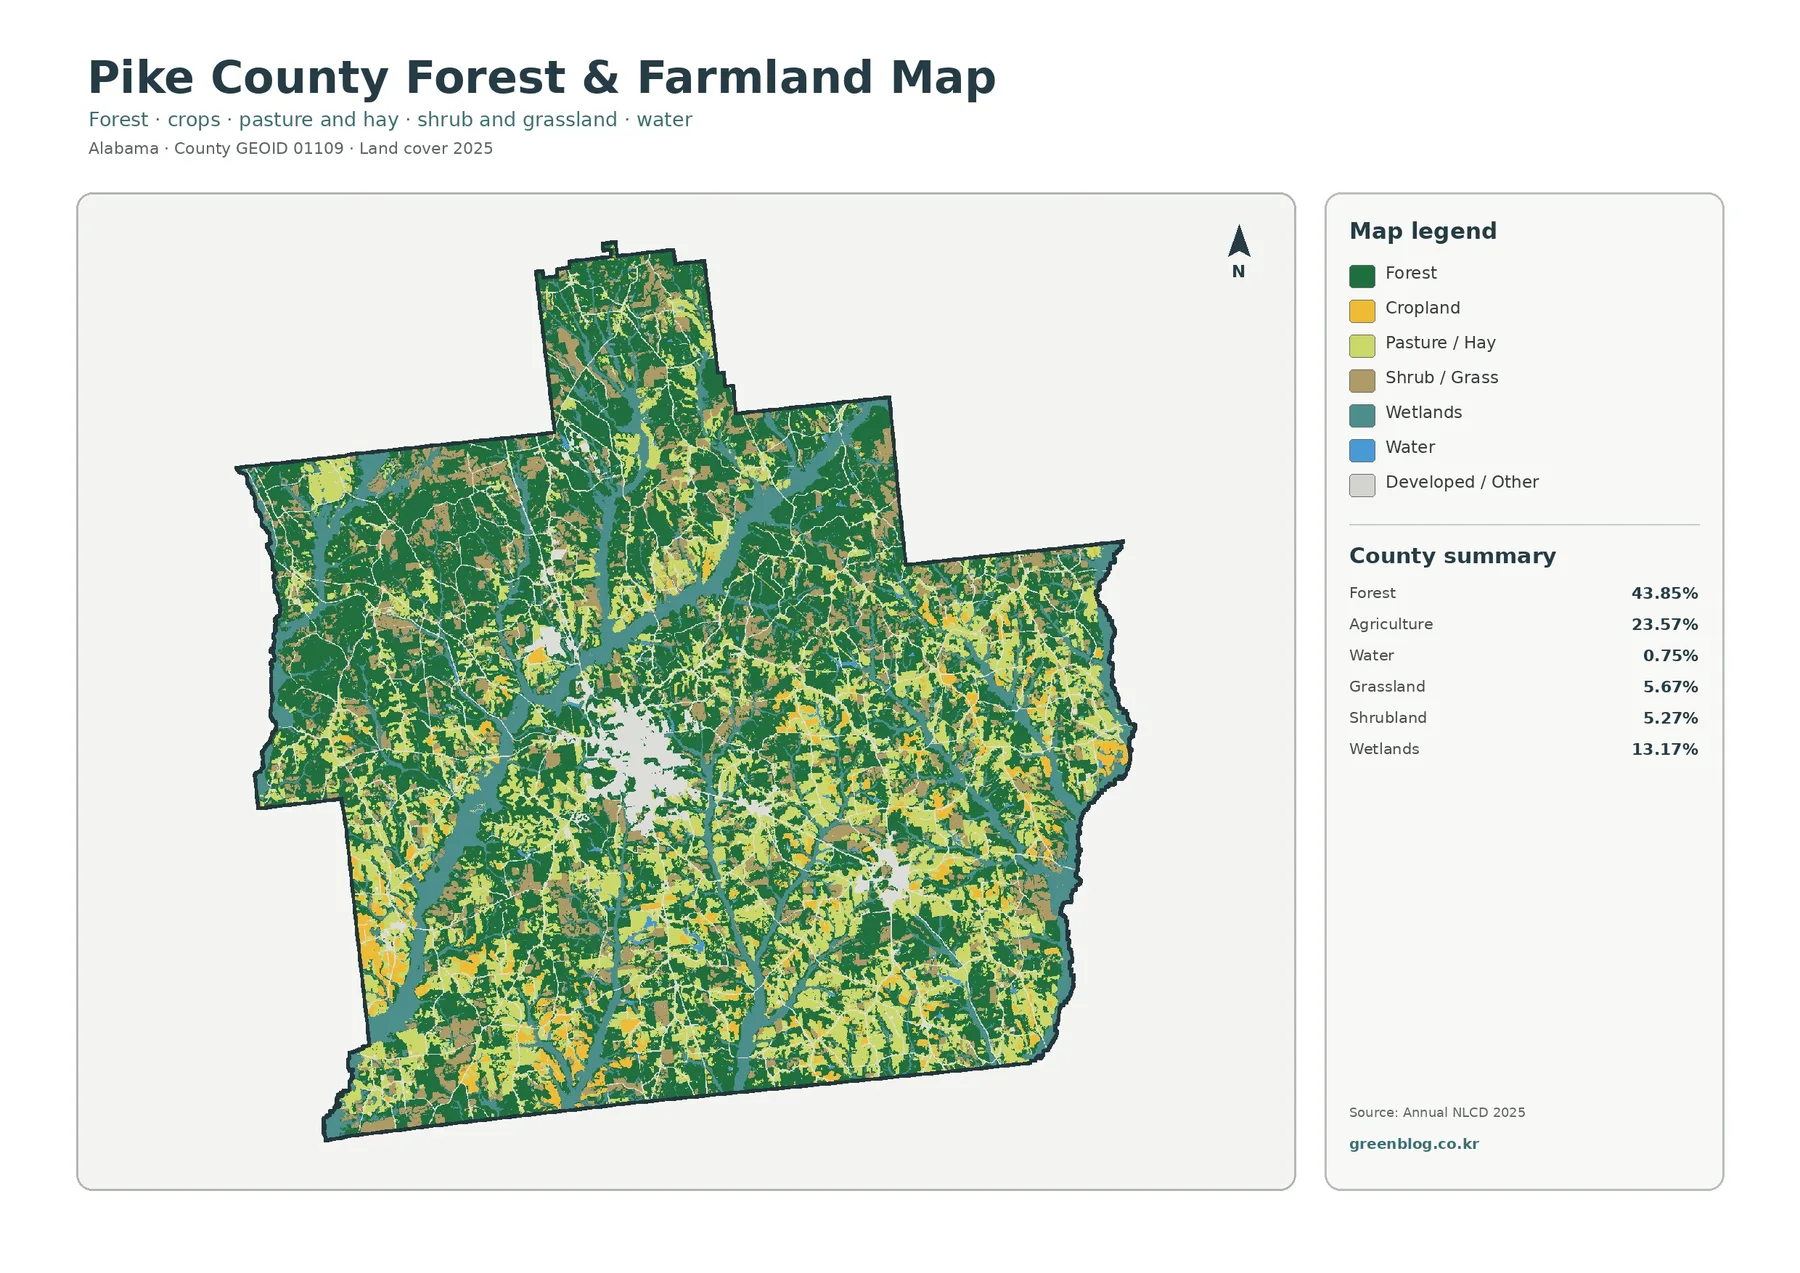
Once most developed and other cover is pushed into a neutral color, the relationship between woods and farmland becomes much clearer. Forest still forms the largest blocks, but cropland and pasture/hay are distributed through much of the county. Agricultural cover is especially noticeable across the southern and eastern portions, yet sizable farm patches also occur farther north. The pattern is not a straight north-south division; wooded tracts and agricultural openings repeatedly meet one another across Pike County.
The change map is a record of class differences, not a single story of urban growth
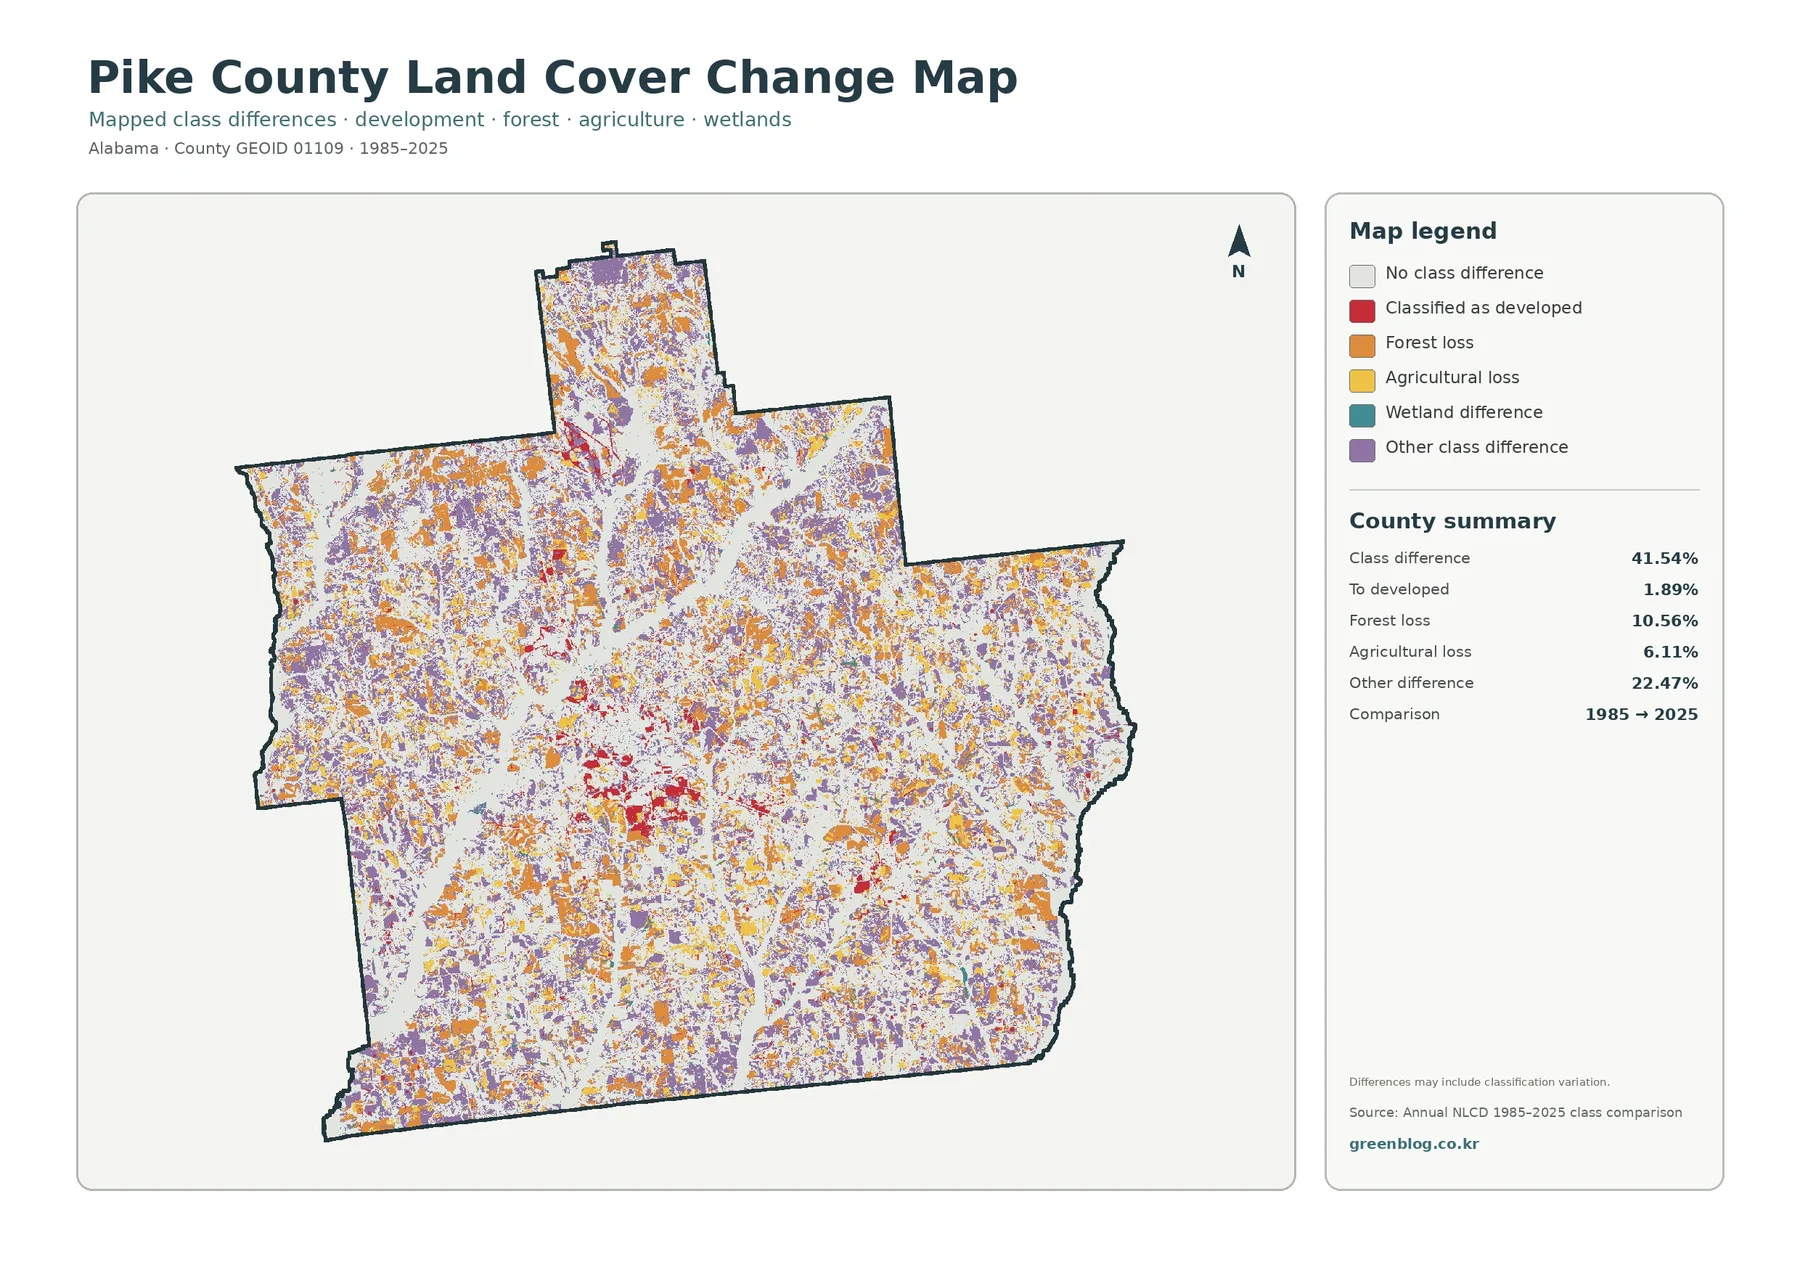
At first glance, the change map is much busier than the 2025 maps. Purple “other difference” and orange forest-loss patches are scattered across the county, while red areas classified to developed are more localized. The summary reports a total class difference of 41.54%. That number should never be read as 41.54% urbanized, cleared, or permanently damaged. The portion classified to developed is 1.89%, and the remaining differences include forest loss, agricultural loss, wetland differences, and other category changes.
Forest loss is listed at 10.56% and agricultural loss at 6.11%, while other differences account for 22.47%. A long comparison period can capture harvest and regrowth, conversion among grass, shrub, farm, and forest classes, changes in water or wetland classification, and differences caused by imagery or classification methods. A mixed pixel near the edge of a field or forest may also change categories even when the ground transition is gradual. The map therefore works best as a screening layer that points to places worth checking in additional years.
A practical order for reading the four Pike County maps
Start with the current land-cover view to identify the main forest, farm, wetland, and developed areas. If the question concerns rural land, switch to the forest-and-farmland map, where cropland, pasture/hay, shrub and grass cover are easier to separate from the built environment. For Troy or another settlement, the impervious map is the better second step because it distinguishes hard surfaces from the broader developed class. Use the change map last, after you already understand the current landscape, so the many colors have a clear reference point.
This sequence is useful in education because each map answers a different level of question without requiring advanced GIS software. Students can first identify the largest 2025 class, then compare forest with agriculture, then ask where hard surfaces are concentrated, and finally examine where the 1985 and 2025 classifications differ. A presentation can use the same approach, choosing only the map that supports the point being discussed instead of crowding a slide with four legends at once.
Keep the classification year and raster scale in mind
Annual NLCD is a raster dataset, meaning the landscape is represented by a grid of cells rather than surveyed parcel lines. A cell can contain more than one real-world surface. When trees, grass, a narrow road, and part of a building share the same cell, the classification necessarily simplifies that mixture. Boundaries that look crisp on the image should therefore be treated as generalized map boundaries, not fence lines, property lines, or engineering measurements.
Download the four Pike County land-cover JPG maps
The ZIP contains one original JPG for each map shown on the page: general land cover, forest and farmland, impervious surface/developed land, and 1985–2025 land-cover change. Every JPG is 2480 × 1754 pixels. The online WebP previews are 1800 pixels wide and are intended for convenient browser viewing, while the JPG files are the better choice for saving, inserting into a presentation, or testing a print. The source package does not mark these originals as meeting an A3 high-resolution reference, so check print quality at your intended output size.
Frequently Asked Questions
What is the largest land-cover class in Pike County?
Forest is the largest 2025 class at 43.85%. Agriculture is also extensive at 23.57%, followed by wetlands at 13.17%. The county is therefore better described as a mixed forest-and-farm landscape with important wet corridors than as a uniformly forested area.
Why is developed cover 7.68% when mean imperviousness is only 1.44%?
The developed class can include vegetation and other permeable surfaces around buildings and roads. Imperviousness measures the fraction of hard surface within the mapped cells. A neighborhood can therefore be classified as developed even though lawns, trees, and soil still occupy much of its area.
Does the 41.54% class-difference value mean that much of the county was developed?
No. The 41.54% figure includes all mapped category differences between 1985 and 2025. Only 1.89% is listed as change to developed. Forest loss, agricultural loss, wetland differences, other class changes, and classification variation make up the rest of the total.
What is included in the download?
The ZIP contains four 2480 × 1754 JPG files: the general land-cover map, forest-and-farmland map, impervious-surface/developed-land map, and 1985–2025 land-cover-change map. The WebP images shown in the article are browser previews and are not the files listed as the original download set.
Map File Information
Pike County Land Cover JPG Set
- Printable Size: 2480 × 1754 pixels each
Related Maps
- Autauga County Alabama Land Cover Map
- Baldwin County Alabama Land Cover Map
- Barbour County Alabama Land Cover Map
Sources and reference data
- MRLC Annual NLCD Data — source portal for the mapped 2025 land-cover and impervious products
- USGS Annual NLCD Land Cover Classification — definitions for forest, agriculture, wetlands, developed land, and other classes
- USGS Conecuh River Near Troy, Alabama — stream-location context within Pike County
- Outdoor Alabama: Pea River — state resource describing the Pea River along the Pike–Barbour County boundary
- City of Troy: About Troy — official city context for Pike County’s county seat
- Atlas Alabama: Brundidge — local context for Brundidge on U.S. Highway 231 in Pike County
Green Map creates custom-edited map images using open geographic data sources such as geoBoundaries, Natural Earth, OpenStreetMap, and government open data.
These maps are edited visual materials, not raw data files, and are provided for education, documents, presentations, and graphic reference.